. 2025 Jan 30:11:1528331.
doi: 10.3389/fvets.2024.1528331. eCollection 2024.

Effects of different Lys/Met ratios on the antioxidant capacity, tissue morphology, and fatty acid composition of subcutaneous fat in Tibetan sheep on low-protein diets: a lipidomic analysis

Affiliations

Effects of different Lys/Met ratios on the antioxidant capacity, tissue morphology, and fatty acid composition of subcutaneous fat in Tibetan sheep on low-protein diets: a lipidomic analysis

Rengeerli Sa et al. Front Vet Sci. .

Abstract

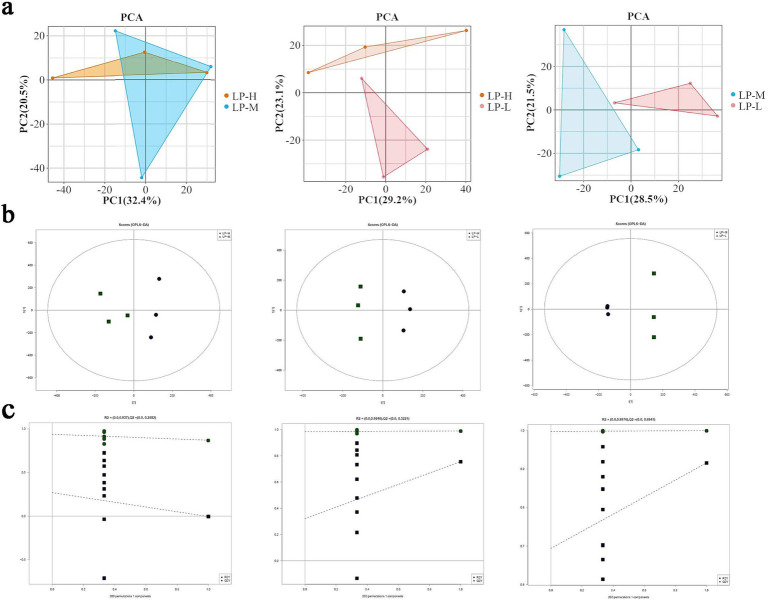
Introduction: This study employed lipidomics to investigate the effects of varying lysine (Lys)- to-methionine (Met) ratios on the antioxidant capacity, tissue morphology, and fatty acid composition of subcutaneous fat in Tibetan sheep fed a low-protein diet.

Methods: Ninety healthy male Tibetan sheep of similar body weight were randomly allocated into three groups. These sheep were fed a low-protein diet containing Lys/Met ratios of 1:1, 2:1, and 3:1. Ultra-High Performance Liquid Chromatography-tandem Mass Spectrometry (UHPLC-MS/MS) was employed to explore the changes in various lipid subclasses in subcutaneous adipose tissue. The expression of genes associated with adipogenesis, antioxidant capacity, and fatty acid metabolism was also examined.

Results: The results indicated that the 1:1 Lys/Met group exhibited significantly higher antioxidant capacity (glutathione peroxidase, GSH-Px), with more orderly adipocyte arrangement, uniform cell size, and a general increase in unsaturated fatty acid levels. Additionally, several lipid molecules associated with the phenotype (Antioxidant index and fatty acid content) were identified, namely, DG(38:3e) + Na, PE(17:1_22:2)-H, PI(17:0_20:3)-H, TG(33:0e) + NH4, Cer(d14:0_17:1) + H, and CL(81:13)-2H. Furthermore, the findings showed that the upregulation of PPARγ, FASN, FAD4, CPT1A, and GPX4 can enhance adipocyte differentiation and lipid accumulation, thereby improving metabolic function in subcutaneous adipose tissue via the regulation of lipid metabolism and oxidative defense mechanisms.

Discussion: In summary, this study provides a theoretical foundation for optimizing precision feeding strategies for Tibetan sheep, offering crucial data to support enhancements in production efficiency and meat quality.

Keywords: amino acids; lipidomics; low protein; nutritional regulation; subcutaneous fat.


Conflict of interest statement

The authors declare that the research was conducted in the absence of any commercial or financial relationships that could be construed as a potential conflict of interest.

Figures

Figure 1
Figure 1
Morphologic results of adipose tissue. (a) Adipose backfat thickness, adipocyte diameter and adipocyte area maps of subcutaneous fat among the three groups. (b) HE sections of adipocytes of the three groups at 200 μm and 50 μm field of view.
Figure 2
Figure 2
Model quality validation based on LC–MS/MS data: (A) PCA plots for the LP-H, LP-M, and LP-L groups; (B) OPLS-DA score plots for the LP-H, LP-M, and LP-L groups; (C) Permutation test plots for the OPLS-DA models.
Figure 3
Figure 3
Differential lipid analysis: (A) Volcano plots comparing the LP-H vs. LP-M, LP-H vs. LP-L, and LP-M vs. LP-L groups (rose: significantly different lipid molecules; black: non-significantly different lipid molecules); (B) Trend analysis plots for lipid profiles 2–7 (each dot represents a sample, lines represent changes in lipid molecules between samples, and different colored lines represent different lipid molecules).
Figure 4
Figure 4
Analysis of lipidomics results. (A) The number of lipid subclasses and lipid molecules identified through positive and negative ion modes. (B) Composition distribution map of LP-H lipid subclasses (C) Composition distribution diagram of LP-M lipid subclasses (D) Composition distribution map of LP-L lipid subclasses.
Figure 5
Figure 5
Significantly different lipid molecules between treatment groups. Bubbles represent lipid molecules with significant differences between (A) LP-H and LP-M, (B) LP-H and LP-L, and (C) LP-M and LP-L. The vertical axis indicates lipid subclasses, distinguished by colors. Bubble size represents the significance of the difference, with smaller bubbles indicating significant differences (0.01 < p < 0.05) and larger bubbles indicating highly significant differences (p < 0.01). The horizontal axis shows the percentage difference in lipid molecule levels between the compared groups.
Figure 6
Figure 6
Correlation analysis. In a Spearman’s correlation analysis, blue indicates a negative correlation, red indicates a positive correlation, and the darker the color, the stronger the correlation. Edge width corresponds to the Mantel’s r statistic for the corresponding distance correlation, and edge color denotes statistical significance. * p < 0.05. ** p < 0.01. *** p < 0.001. (A) Correlation analysis of lipid molecules with fatty acid content index. (B) Correlation analysis of lipid molecules with sebum antioxidant index. (C) Correlation analysis of lipid molecules with adipose tissue morphology.
Figure 7
Figure 7
Effect of dietary Lys/Met ratio on the expression of genes related to adipocyte metabolism in subcutaneous fat.

References

    1. Zhu W, Xu W, Wei C, Zhang Z, Jiang C, Chen X. Effects of decreasing dietary crude protein level on growth performance, nutrient digestion, serum metabolites, and nitrogen utilization in growing goat kids (Capra hircus). Animals (Basel). (2020) 10:151. doi: 10.3390/ani10010151, PMID: - DOI - PMC - PubMed
    1. Zhang F, Zhang Y, He T, Ji Q, Hou S, Gui L. Changes in rumen microbiology and metabolism of Tibetan sheep with different Lys/met ratios in low-protein diets. Animals (Basel). (2024) 14:1533. doi: 10.3390/ani14111533, PMID: - DOI - PMC - PubMed
    1. Chang C, Zhao W, Zhang Q, Wang X, Zhang J, Yan Z, et al. . Dietary crude protein and lysine levels affect meat quality and Myofiber characteristic of slow-growing chicken. Animals (Basel). (2024) 14:2068. doi: 10.3390/ani14142068, PMID: - DOI - PMC - PubMed
    1. Chen X, Song P, Fan P, He T, Jacobs D, Levesque CL, et al. . Moderate dietary protein restriction optimized gut microbiota and mucosal barrier in growing pig model. Front Cell Infect Microbiol. (2018) 8:246. doi: 10.3389/fcimb.2018.00246, PMID: - DOI - PMC - PubMed
    1. Ji Q, Zhang F, Su Q, He T, Wu Z, Zhu K, et al. . Effect of supplementing lysins and methionine to low-protein diets on growth performance, hepatic antioxidant capacity, immune status, and glycolytic activity of tibetan sheep. BMC Genomics. (2024) 25:557. doi: 10.1186/s12864-024-10480-2, PMID: - DOI - PMC - PubMed

LinkOut - more resources