. 2025 Jan 19;28(2):111833.
doi: 10.1016/j.isci.2025.111833. eCollection 2025 Feb 21.

Adenylate cyclase 10 promotes brown adipose tissue thermogenesis

Affiliations

Adenylate cyclase 10 promotes brown adipose tissue thermogenesis

Anupam Das et al. iScience. .

Abstract

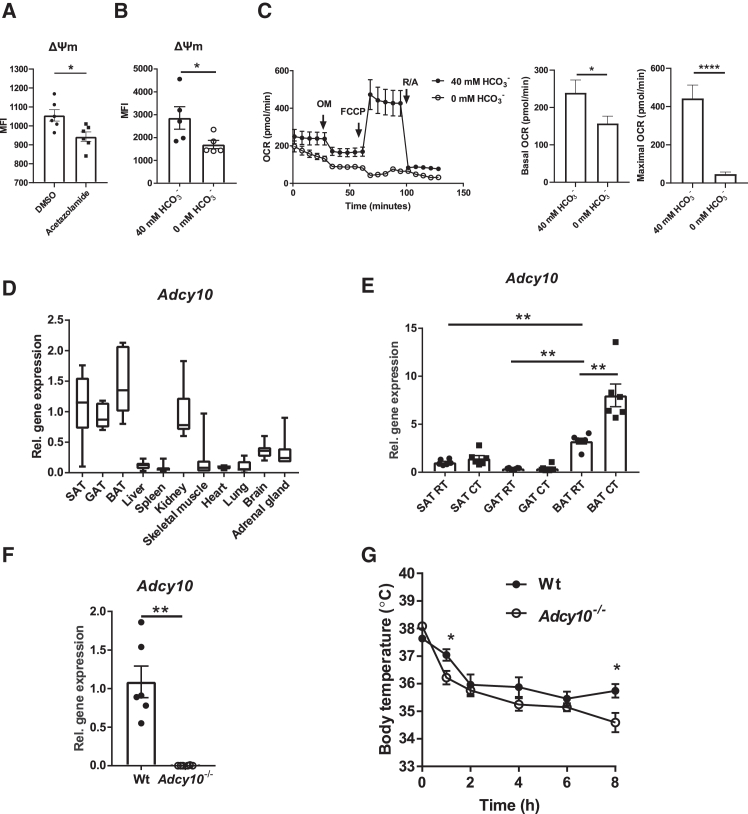
Brown adipose tissue (BAT) thermogenesis dissipates energy through heat production and thereby it opposes metabolic disease. It is mediated by mitochondrial membrane uncoupling, yet the mechanisms sustaining the mitochondrial membrane potential (ΔΨm) in brown adipocytes are poorly understood. Here we show that isocitrate dehydrogenase (IDH) activity and the expression of the soluble adenylate cyclase 10 (ADCY10), a CO2/bicarbonate sensor residing in mitochondria, are upregulated in BAT of cold-exposed mice. IDH inhibition or ADCY10 deficiency reduces cold resistance of mice. Mechanistically, IDH increases the ΔΨm in brown adipocytes via ADCY10. ADCY10 sustains complex I activity and the ΔΨm via exchange protein activated by cAMP1 (EPAC1). However, neither IDH nor ADCY10 inhibition affect uncoupling protein 1 (UCP1) expression. Hence, we suggest that ADCY10, acting as a CO2/bicarbonate sensor, mediates the effect of IDH on complex I activity through cAMP-EPAC1 signaling, thereby maintaining the ΔΨm and enabling thermogenesis in brown adipocytes.

Keywords: Cell biology; Molecular biology; Physiology.


Conflict of interest statement

The authors declare no competing interests.

Figures

None
Graphical abstract
Figure 1
Figure 1
IDH promotes brown adipose tissue thermogenesis (A) TCA cycle metabolite levels or ratios in BAT of WT mice kept for 8 h at 4°C (CT) or room temperature (RT, 22°C) measured by LC-MS/MS (n = 6 mice per group). (B) NAD+ and NADP+-dependent IDH activity normalized to protein concentration in BAT of WT mice kept for 8 h at CT or RT (n = 6 mice per group). (C) Relative gene expression of Idh3a and Idh3g in BAT of mice kept for 8 h at CT or RT. Gene expression is set as 1 for RT samples (n = 6 mice per group). (D and E) ΔΨm and mitochondrial load measured by TMRE and MitoTracker Green FM staining, respectively, and fluorescence-activated cell sorting (FACS) in brown preadipocytes (cell line) 48 h after transfection with siRNA against Idh3a or siCtrl (n = 6). (F) NADP+ and NAD+-dependent IDH activity measured in brown adipocytes (cell line) treated for 18 h with 5 μΜ AG-221 or same amount of DMSO (n = 6). (G and H) ΔΨm and mitochondrial load in brown adipocytes (cell line) treated for 18 h with 5 μΜ AG-221 or same amount of DMSO (n = 6). Mean fluorescence intensity (MFI) is shown in (D, E, G and H). (I) Body temperature of mice pre-treated 2 h prior to cold exposure with 40 mg/kg AG-221 or control solution (0.5% methylcellulose/0.2% Tween 80% in water) and exposed for 8 h to 4°C (n = 7–8 mice per group). All data are shown as mean ± SEM. ∗p < 0.05, ∗∗p < 0.01, ns: not significant.
Figure 2
Figure 2
ADCY10 promotes thermogenesis in brown adipose tissue (A) Brown adipocytes (cell line) were treated for 18 h with 1 mM acetazolamide or carrier (DMSO) and the ΔΨm was measured by TMRE staining and FACS (n = 6). (B) Primary brown adipocytes were kept for 24 h in a CO2-free atmosphere and the ΔΨm was measured by TMRE staining (n = 5). (C) The OCR was measured in primary brown adipocytes kept for 24 h in a CO2-free atmosphere (left). Quantification of basal and maximal OCR is shown (right) (n = 15). OM: oligomycin, R/A: rotenone/antimycin. (D) Adcy10 relative gene expression in different organs and tissues of WT mice (n = 7). (E) Adcy10 relative gene expression in subcutaneous (SAT), gonadal (GAT), and brown adipose tissue (BAT) in WT mice kept for 8 h at CT or RT (n = 6). (F) Adcy10 relative gene expression in BAT of WT and Adcy10−/− mice; gene expression was set as 1 in WT mice (n = 6). (G) Body temperature of WT and Adcy10−/− mice exposed for 8 h to 4°C (n = 10–14 mice per group). Data are shown as mean ± SEM. ∗p < 0.05, ∗∗p < 0.01, ∗∗∗∗p < 0.0001.
Figure 3
Figure 3
ADCY10 maintains the mitochondrial membrane potential via cAMP-EPAC1 (A) OCR measured in WT and Adcy10−/− primary brown adipocytes (left) and quantification of basal and maximal OCR (right) (n = 12). (B) Brown preadipocytes were plasmid transfected to overexpress ADCY10 and 48 h later the ΔΨm was measured by TMRE staining and FACS (n = 6). (C) Brown adipocytes (cell line) were treated for 2 h with 10 μΜ KH7 and cAMP was measured in isolated mitochondria (n = 3–4). (D) Brown preadipocytes (cell line) were transfected with Idh2-overexpressing plasmid or control plasmid for 48 h and treated with 10 μΜ KH7 or control carrier (DMSO) for 2 h; the ΔΨm was measured by TMRE staining and FACS (n = 6). (E) Brown preadipocytes (cell line) were transfected with an ADCY10-overexpressing or a control plasmid for 48 h and treated the last 24 h with 10 μΜ H89 or DMSO; the ΔΨm was measured by TMRE staining and FACS (n = 3). (F) Brown preadipocytes were plasmid transfected for 48 h to overexpress ADCY10 and treated for 2 h with 10 μΜ (R)-CE3F4 or DMSO. The ΔΨm was measured by TMRE staining and FACS (n = 6). (G and H) Brown adipocytes (cell line) were treated for 18 h with 10 μΜ KH7 or 50 μΜ LRE1 or DMSO and 100 μΜ 8-CPT-2Me-cAMP or PBS and the ΔΨm was measured by TMRE staining and FACS (n = 5–6). (I and K) Brown adipocytes (cell line) were treated for 2 h with 50 μΜ LRE1, 10 μΜ (R)-CE3F4 or DMSO and complex I and II activity was measured by high-resolution respirometry by sequential addition of 5 mM pyruvate, 2 mM malate, 5 mM ADP+Mg2+, 0.5 μM rotenone, 10 mM succinate, 12.5 μM thenoyltrifluoroacetone (TTFA) and 2.5 μM antimycin (AMA) (n = 3–5). (J) Brown adipocytes (cell line) were treated for 2 h with 50 μΜ LRE1 and complex IV activity was measured by high-resolution respirometry by addition of 0.5 mM tetramethyl-p-phenylenediamine (TMPD) and 40 mM sodium azide (Azd) (n = 4). Data are shown as mean ± SEM. ∗p < 0.05, ∗∗p < 0.01, ∗∗∗p < 0.001, ns: not significant.

References

    1. Chouchani E.T., Kazak L., Spiegelman B.M. New Advances in Adaptive Thermogenesis: UCP1 and Beyond. Cell Metabol. 2019;29:27–37. doi: 10.1016/j.cmet.2018.11.002. - DOI - PubMed
    1. Harms M., Seale P. Brown and beige fat: development, function and therapeutic potential. Nat. Med. 2013;19:1252–1263. doi: 10.1038/nm.3361. - DOI - PubMed
    1. Bertholet A.M., Kirichok Y. UCP1: A transporter for H(+) and fatty acid anions. Biochimie. 2017;134:28–34. doi: 10.1016/j.biochi.2016.10.013. - DOI - PMC - PubMed
    1. Liu X., Zhang Z., Song Y., Xie H., Dong M. An update on brown adipose tissue and obesity intervention: Function, regulation and therapeutic implications. Front. Endocrinol. 2022;13 doi: 10.3389/fendo.2022.1065263. - DOI - PMC - PubMed
    1. Kajimura S., Spiegelman B.M., Seale P. Brown and Beige Fat: Physiological Roles beyond Heat Generation. Cell Metabol. 2015;22:546–559. doi: 10.1016/j.cmet.2015.09.007. - DOI - PMC - PubMed

LinkOut - more resources