. 2025 Feb 8;53(4):gkaf068.
doi: 10.1093/nar/gkaf068.

DHX9 helicase impacts on splicing decisions by modulating U2 snRNP recruitment in Ewing sarcoma cells

Affiliations

DHX9 helicase impacts on splicing decisions by modulating U2 snRNP recruitment in Ewing sarcoma cells

Valentina Frezza et al. Nucleic Acids Res. .

Abstract

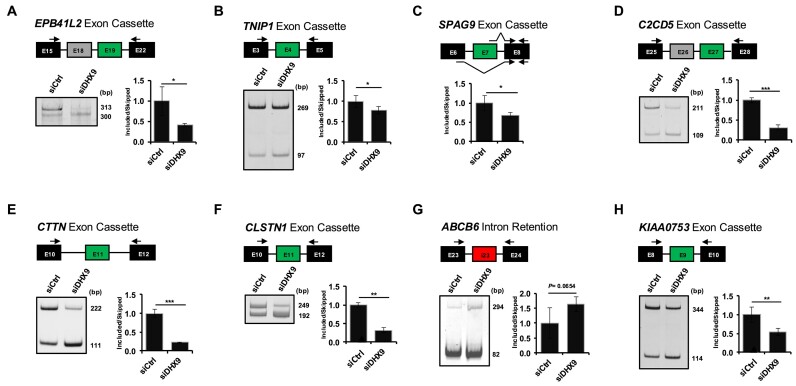
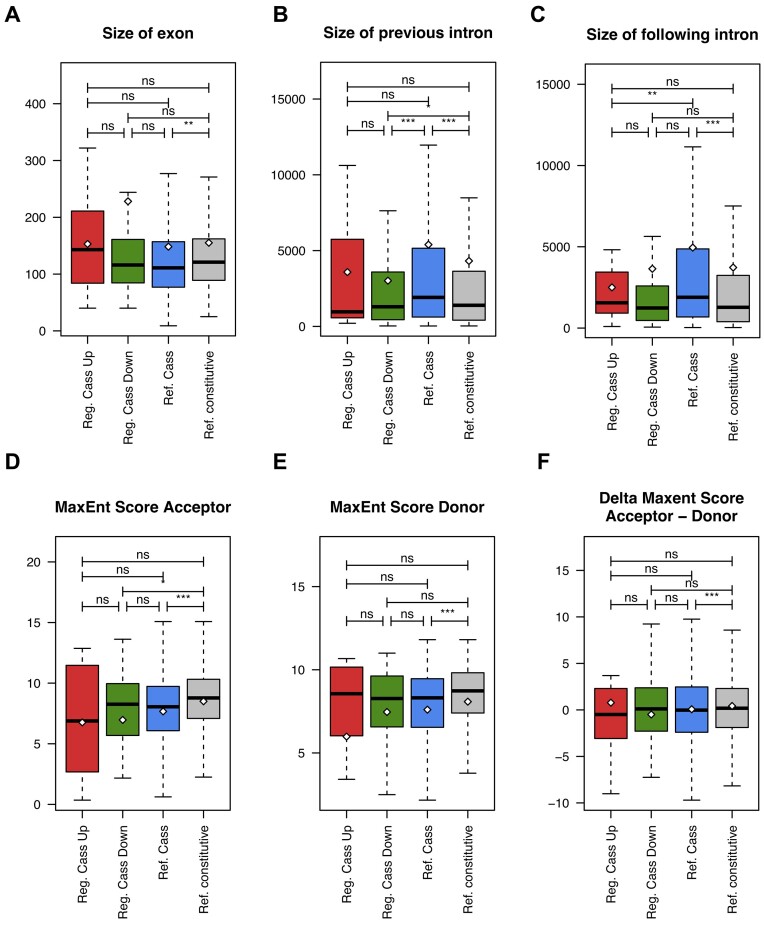
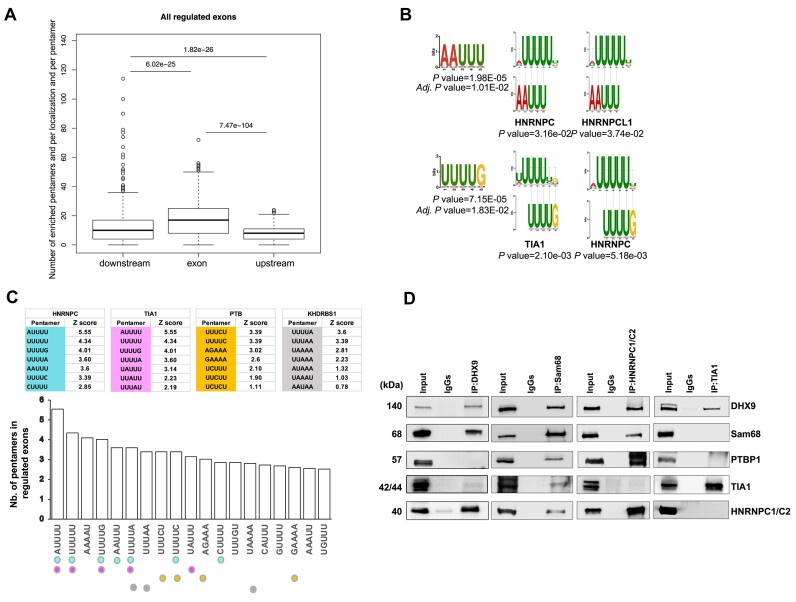
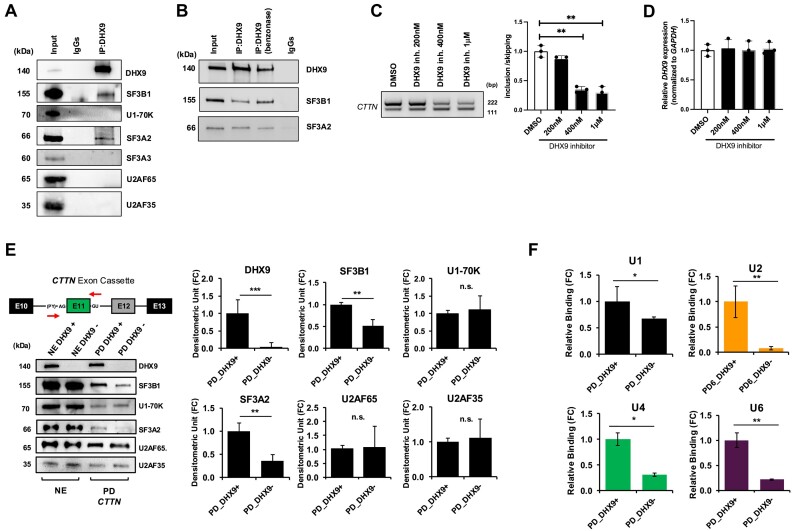
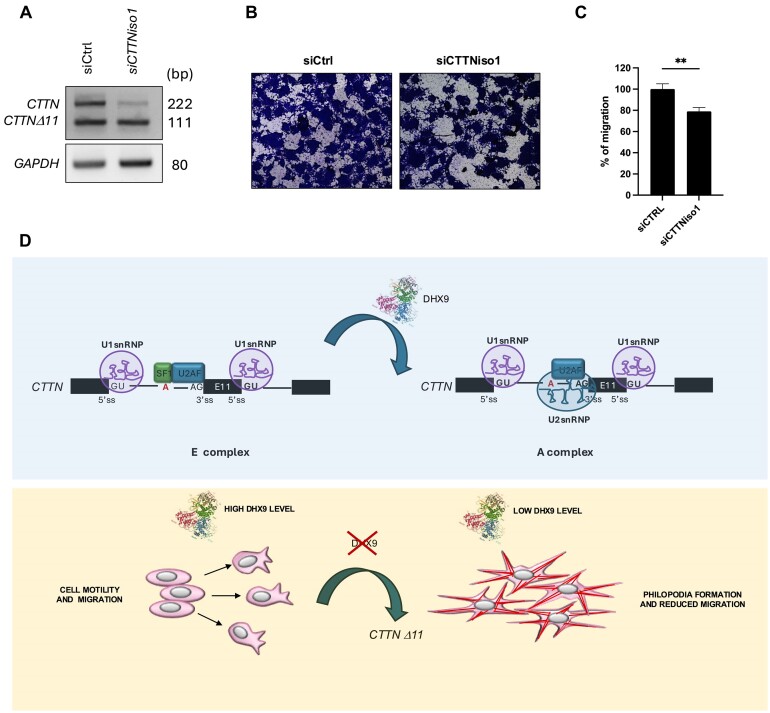
Ewing sarcomas (ESs) are biologically aggressive tumours of bone and soft tissues caused by chromosomal translocations yielding in-frame fusion proteins driving the neoplastic transformation. The DNA/RNA helicase DHX9 is an important regulator of cellular processes often deregulated in cancer. Using transcriptome profiling, our study reveals cancer-relevant genes whose splicing is modulated by DHX9. Immunodepletion experiments demonstrate that DHX9 impacts on the recruitment of U2 small nuclear RNP (snRNP) onto the pre-mRNA. Analysis of structure and sequence features of DHX9 target exons reveal that DHX9-sensitive exons display shorter flanking introns and contain HNRNPC and TIA1 consensus motifs. A prominent target of DHX9 is exon 11 in the Cortactin (CTTN) gene, which is alternatively spliced to generate isoforms with different activities in cell migration and tumour invasion. Alternative inclusion of the exon 11 in CTTN gene is one of the most recurrent isoform switches in multiple cancer types, thus highlighting the pivotal role of DHX9 in defining the tumour phenotype. Biochemical analyses reveal that DHX9 binding promotes the recruitment of U2snRNP, SF3B1, and SF3A2 to the splice sites flanking exon 11. These findings uncover a new role of DHX9 in the control of co-transcriptional splicing in ES, which may represent a new druggable target to counteract ES malignancy.


Conflict of interest statement

None declared.

Figures

Graphical Abstract
Graphical Abstract
Figure 1.
Figure 1.
DHX9 impacts on alternative splicing choices in Ewing sarcoma cells. (A) RT-qPCR showing the levels of DHX9 transcript in TC-71 ES cells after 48 h of transfection with either siControl (siCtrl) or siDHX9 oligonucleotides. Values are the mean ± SD of three independent experiments, each performed in triplicate. Statistical analysis was performed by Student’s t-test. (B) Western blot showing the DHX9 protein levels in TC-71 cells after 48 h of transfection with either control siRNA or siDHX9, normalized to GAPDH expression. Values are the mean ± SD of three independent experiments, each performed in triplicate. Statistical analysis was performed by Student’s t-test. (C) Venn diagram showing overlap between transcriptional- and splicing- regulated genes, identified by comparison of siDHX9 versus siCtrl TC-71 ES cells (P < 5.053e-06). (D) Bar graph showing percentages of AS pattern differentially regulated between siDHX9 and siCtrl. (E) Bar graph showing Fold enrichment of Gene Ontology categories (GO) of differentially splicing-regulated genes enriched in siDHX9 TC-71 cells. Histograms represent the fold enrichment score and the -log10 (P-values).
Figure 2.
Figure 2.
DHX9 affects alternative splicing choices of ES cells. (A–H) Representative images of the PCR analyses for the indicated alternative splicing events differentially regulated between TC-71 cells transfected with either siCtrl or siDHX9. Schematic representation for each event analyzed is depicted above the representative agarose gel. Green and red boxes indicate the regulated exons in siDHX9 compared with control TC-71 cells, either skipped (green) or included (red). Black arrows in the scheme indicate primers used for the PCR analysis of EPB41L2,TNIP1,SPAG9,C2CD5,CTTN,CLSTN1,ABCB6, and KIAA0753 event. The graphs show the densitometric analysis of the ratio between isoforms with included and skipped exons. P-values were determined by Student’st-test *P≤ 0.05, **P≤ 0.01, and ***P≤ 0.001 (n = 3; mean ± SD).
Figure 3.
Figure 3.
Structural features of DHX9-sensitive exons. Box plots representing comparison between up- regulated, down-regulated, reference (not-regulated in our experiment), and constitutive exons for size (A), previous intron size (B), following intron size (C), MaxEnt Donor Score (D), MaxEnt Acceptor Score (E), and MaxEnt Acceptor -Donor Score (F). P-values are measured by Fisher test.
Figure 4.
Figure 4.
Sequence features of DHX9-sensitive exons. (A) Number of enriched pentamers in the regulated exons or in the nearby regions (downstream and upstream). (B) Most significant sequence motifs in the regions nearby or within DHX9-sensitive exons (adjusted P-value <0.05). Tomtom Motif Comparison tool, (https://meme-suite.org/meme/tools/tomtom) identified the AAUUU and UUUUG motifs as binding sites for HNRNPC, HNRNPCL1, and TIA1. (C) Z score was calculated by counting the number of exons with a pentamer (upper part) and by counting the number of pentamers in each exon. (D) Immunoprecipitation (IP) experiments were performed to evaluate the interaction between DHX9 and the identified splicing factors in panel (C). Immunoprecipitated proteins were separated by Western blot analysis. The interaction of HNRNPC, Sam68, PTB, and TIA1 with DHX9 was evaluated.
Figure 5.
Figure 5.
DHX9 immuno-depletion affects U2snRNP recruitment on CTTN pre-mRNA. (A) Western blot analysis of SF3B, U1-70K, SF3A2, SF3A3, U2AF65, U2AF35, and DHX9 after IP of endogenous proteins from TC-71 nuclear extracts with anti-DHX9 or control mouse IgGs. The experiments were performed at least three times; statistical analysis was performed by Student’st-test (P < 0.01 **). (B) IP experiments were performed to evaluate the interaction between DHX9 and the splicing factors identified in A after Benzonase treatment (50 U/ml, for 2 h). (C) TC-71 cells were treated with DHX9 inhibitor for 48 hours at the indicated concentrations and PCR analyses for the CTTN alternative splicing event was performed. The graphs show the densitometric analysis of the ratio between isoforms with included and skipped exons. P-values were determined by Student’s t-test *P≤ 0.05, **P≤ 0.01, and ***P≤ 0.001 (n = 3; mean ± SD). (D) DHX9 expression has been evaluated by RT-qPCR. (E) In the upper part, scheme of the affinity chromatography assays from TC-71 nuclear extracts using biotinylated RNA corresponding to CTTN exon 11 pre-mRNA and flanking intronic sequences. Pull-down assays of TC-71 nuclear extracts immunodepleted using either purified rabbit IgGs or anti-DHX9 antibody. The RNA pull-down was performed using in vitro transcribed biotinylated RNA corresponding to CTTN exon 6 pre-mRNA and flanking intronic sequences spanning from −79 to +72 nucleotides as a bait. After extensive washes, pulled-down proteins were analyzed by Western blot using antibodies against DHX9, U170K, U2AF65, U2AF35, SF3B1, and SF3A2. On the right, quantification of pull-down results by densitometric analysis. Bars indicate mean values ± SD of three independent experiments. Significance: binding to CTTN pre- mRNA sequences was evaluated using Student’st-test: P < 0.05,∗∗P < 0.01, and ∗∗∗P < 0.001. (F) Quantification of pull-down of U1, U2, U4, and U6 snRNPs by RT-qPCR. Bars indicate mean values ± SD of three independent experiments. Significance: cross-link to CTTN pre- mRNA sequences was evaluated using Student’s t-test: P < 0.05, ∗∗P < 0.01, and ∗∗∗P < 0.001. NE = nuclear extracts; and PD = pull down.
Figure 6.
Figure 6.
DHX9 knockdown modulates cellular morphology via CTTN alternative splicing. (A) Western blot analysis showing CTTN protein isoforms upon DHX9 silencing. Ten micrograms of total protein extracts were loaded in each lane. β-actin content was used as loading control. (B) Representative pictures showing cellular morphology after transfection with either siCTRL or siDHX9 oligonucleotides. Phalloidin staining was used to detect filipodia, DAPI was used for DNA staining. (C) TC-71 cells were transfected as in panel (A) and migration assay was performed. The crystal violet-stained migrating cells were photographed and counted. (D) Values are the mean ± SD of three independent experiments, each performed in triplicate, considering the migration of siCtrl as 100%. Statistical analyses were performed by Student’s t-test. *P≤ 0.05; **P≤0.01; and ***P≤ 0.001. (E) Measurement of tumour xenograft from shCTRL and shDHX9 mice at 28 days after injection. Statistical analysis was performed by Student’st-test, P-values: ****P≤ 0.0001. (F) Tumour xenografts were collected from shCTRL and shDHX9 mice (n = 8 for each group) and weighed. Graph represents the mean of the weights ± SD. Statistical analysis was performed by Student’st-test, P-values: ****P≤ 0.0001. (G) Representative IHC images of Cortactin staining in tumour xenografts originated from shCTRL and shDHX9 cells. Scale bar: 10 μm. (H) Western blot analysis for the expression of Cortactin and Tubulin from xenografts formed by shCTRL and shDHX9 TC-71 cells. On the right, densitometric analysis to evaluate full length and Δexon 11 isoforms of Cortactin. Statistical analysis was performed by Student’st-test, P-values: **P≤ 0.01.
Figure 7.
Figure 7.
CTTN alternative splicing affects cell migration. (A) PCR analysis to monitor CTTN splicing from TC-71 cells transfected with either control or siCTTN oligonucleotides directed against the isoform 1 of CTTN containing exon 11. (B) Migration assay of siCtrl and siCTTN. Crystal violet-stained migrating cells were photographed and counted. (C) Histograms represent the mean ± SD of three independent experiments, each performed in triplicate, considering the migration of siCtrl as 100%. Statistical analysis was performed by Student’st-test. *P≤ 0.05; **P≤0.01; and ***P≤ 0.001. (D) Hypothetical model of DHX9 splicing regulation (upper part) and its impact on cancer cell migration and invasion (lower part).

References

    1. Jedlicka P Ewing sarcoma, an enigmatic malignancy of likely progenitor cell origin, driven by transcription factor oncogenic fusions. Exp Cell Res. 2010; 3:1658–70. - PMC - PubMed
    1. Delattre O, Zucman J, Plougastel B et al. . Gene fusion with an ETS DNA-binding domain caused by chromosome translocation in human tumours. Nature. 1992; 359:162–65.10.1038/359162a0. - DOI - PubMed
    1. Cidre-Aranaz F, Watson S, Amatruda JF et al. . Small round cell sarcomas. Nat Rev Dis Primers. 2022; 8:66.10.1038/s41572-022-00393-3. - DOI - PubMed
    1. Knoop LL, Baker SJ EWS/FLI alters 5'-splice site selection. J Biol Chem. 2001; 276:22317–22.10.1074/jbc.M008950200. - DOI - PubMed
    1. Knoop LL, Baker SJ The splicing factor U1C represses EWS/FLI-mediated transactivation. J Biol Chem. 2000; 275:24865–71.10.1074/jbc.M001661200. - DOI - PubMed

MeSH terms

LinkOut - more resources