

Hidden Brain States Reveal the Temporal Dynamics of Neural Oscillations During Metaphor Generation and Their Role in Verbal Creativity
- PMID: 39950503
- PMCID: PMC11826972
- DOI: 10.1111/psyp.70023
Hidden Brain States Reveal the Temporal Dynamics of Neural Oscillations During Metaphor Generation and Their Role in Verbal Creativity
Abstract
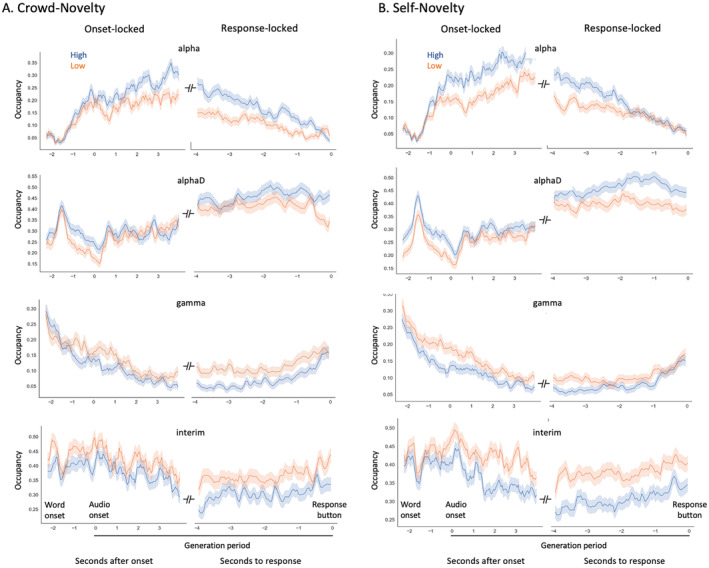
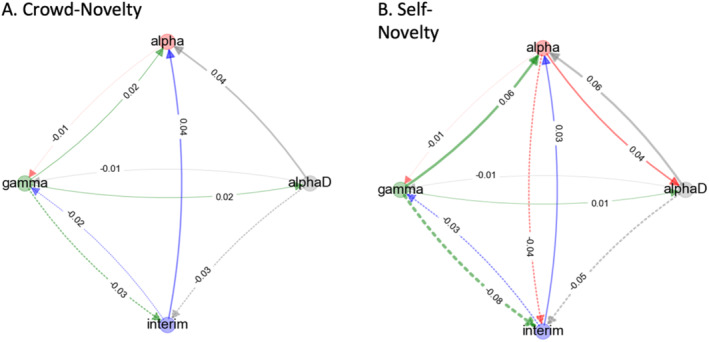
We investigated the oscillatory brain processes while people generated metaphors for science concepts. Applying a hidden Markov model, we extracted brain states, representing temporally disentangled oscillatory processes, from EEG data. By associating the trial-by-trial occupancy of brain states with the creative quality, novelty, and aptness of the generated metaphors, we identified oscillatory processes that played a role in creative ideation in a data-driven manner. Metaphor novelty was positively associated with occupancy in a state featuring widespread alpha-band synchronization during the early trial stage and occupancy in a state featuring alpha-band desynchronization during the later trial stage. In addition, metaphor novelty was negatively associated with gamma-band power. Our results not only extend previous literature on the role of oscillatory processes in creative ideation but also highlight the importance of temporal dynamics in understanding the brain mechanisms during sustained cognitive task performance.
Keywords: EEG; creativity; hidden Markov model; idea generation; metaphor.
© 2025 The Author(s). Psychophysiology published by Wiley Periodicals LLC on behalf of Society for Psychophysiological Research.
Conflict of interest statement
The authors declare no conflicts of interest.
Figures

Similar articles
-
The creative brain in the figural domain: Distinct patterns of EEG alpha power during idea generation and idea elaboration.Neuropsychologia. 2018 Sep;118(Pt A):13-19. doi: 10.1016/j.neuropsychologia.2018.02.013. Epub 2018 Feb 13. Neuropsychologia. 2018. PMID: 29452125
-
Effects of alpha and gamma transcranial alternating current stimulation (tACS) on verbal creativity and intelligence test performance.Neuropsychologia. 2018 Sep;118(Pt A):91-98. doi: 10.1016/j.neuropsychologia.2017.10.035. Epub 2017 Oct 31. Neuropsychologia. 2018. PMID: 29100950
-
Exploring How Generating Metaphor Via Insight Versus Analysis Affects Metaphor Quality and Learning Outcomes.Cogn Sci. 2024 Aug;48(8):e13488. doi: 10.1111/cogs.13488. Cogn Sci. 2024. PMID: 39154376 Free PMC article.
-
EEG alpha power and creative ideation.Neurosci Biobehav Rev. 2014 Jul;44(100):111-23. doi: 10.1016/j.neubiorev.2012.12.002. Epub 2012 Dec 12. Neurosci Biobehav Rev. 2014. PMID: 23246442 Free PMC article. Review.
-
Dissociable neural systems for analogy and metaphor: implications for the neuroscience of creativity.Br J Psychol. 2012 Aug;103(3):302-16. doi: 10.1111/j.2044-8295.2011.02073.x. Epub 2011 Oct 3. Br J Psychol. 2012. PMID: 22804698 Review.
References
-
- Acar, S. , and Runco M. A.. 2014. “Assessing Associative Distance Among Ideas Elicited by Tests of Divergent Thinking.” Creativity Research Journal 26, no. 2: 229–238. 10.1080/10400419.2014.901095. - DOI
-
- Amabile, T. M. 1982. “Social Psychology of Creativity: A Consensual Assessment Technique.” Journal of Personality and Social Psychology 43, no. 5: 997–1013. 10.1037/0022-3514.43.5.997. - DOI
-
- Amin, T. G. 2015. “Conceptual Metaphor and the Study of Conceptual Change: Research Synthesis and Future Directions.” International Journal of Science Education 37, no. 5–6: 966–991. 10.1080/09500693.2015.1025313. - DOI
MeSH terms
Grants and funding
LinkOut - more resources
Full Text Sources
