. 2025 May;12(18):e2408635.
doi: 10.1002/advs.202408635. Epub 2025 Feb 14.

Epithelial Cell Mechanoresponse to Matrix Viscoelasticity and Confinement Within Micropatterned Viscoelastic Hydrogels

Affiliations

Epithelial Cell Mechanoresponse to Matrix Viscoelasticity and Confinement Within Micropatterned Viscoelastic Hydrogels

Giuseppe Ciccone et al. Adv Sci (Weinh). 2025 May.

Abstract

Extracellular matrix (ECM) viscoelasticity has emerged as a potent regulator of physiological and pathological processes, including cancer progression. Spatial confinement within the ECM is also known to influence cell behavior in these contexts. However, the interplay between matrix viscoelasticity and spatial confinement in driving epithelial cell mechanotransduction is not well understood, as it relies on experiments employing purely elastic hydrogels. This work presents an innovative approach to fabricate and micropattern viscoelastic polyacrylamide hydrogels with independently tuneable Young's modulus and stress relaxation, specifically designed to mimic the mechanical properties observed during breast tumor progression, transitioning from a soft dissipative tissue to a stiff elastic one. Using this platform, this work demonstrates that matrix viscoelasticity differentially modulates breast epithelial cell spreading, adhesion, YAP nuclear import and cell migration, depending on the initial stiffness of the matrix. Furthermore, by imposing spatial confinement through micropatterning, this work demonstrates that confinement alters cellular responses to viscoelasticity, including cell spreading, mechanotransduction and migration. These findings establish ECM viscoelasticity as a key regulator of epithelial cell mechanoresponse and highlight the critical role of spatial confinement in soft, dissipative ECMs, which was a previously unexplored aspect.

Keywords: confinement; epithelial cells; extracellular matrix; hydrogels; micropatterning; viscoelasticity.


Conflict of interest statement

The authors declare no conflict of interest.

Figures
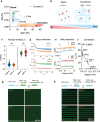
Figure 1
Figure 1
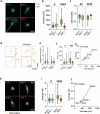
Micropatterned viscoelastic PAAm hydrogels to capture the pathophysiology of the breast tissue microenvironment. a) Phase diagram showing the percentages of bisacrylamide (Bis) cross‐linker and acrylamide (AAm) monomer used to tune the viscoelastic properties of PAAm hydrogels in this study. Viscoelastic hydrogels have a high AAm to Bis ratio compared to elastic hydrogels. Soft E = soft elastic, Soft V = soft viscoelastic, Stiff E = stiff elastic, Stiff V = stiff viscoelastic. The dashed gray lines connect hydrogels of similar Young's modulus (E) (≈ 0.3 and ≈ 3 kPa) but different viscoelastic properties. b) Schematic representation of the strategy used to obtain elastic and viscoelastic hydrogels with the same initial E. The amount of Bis is decreased while concurrently increasing the amount of AAm to favor physical entanglements. Red dots represent chemical cross‐links, idealized by an elastic spring. Chain entanglements are idealized by a viscous dashpot. c) E of hydrogels used in this work. Each point represents a single indentation, with at least 121 indentations (121≤ n ≤ 173) from three independently prepared samples. ns p = 0.3427 (Soft group) and p = 0.1453 (Stiff group), two‐way ANOVA with Bonferroni's multiple comparisons test. Data is shown as mean ± SD. d) Average stress relaxation profiles of hydrogels used in this work. Curves were obtained by averaging at least 121 individual curves (121≤ n ≤ 151) coming from at least two independent experiments. Data is shown as mean ± SD. e) tan(δ) obtained from bulk rheology oscillatory sweeps of hydrogels used in this work (strain 1 %, Experimental Section). Data has been averaged over three independent samples. Data is shown as mean ± SD. f) Correlation between the relaxation half‐time (τ12) obtained from nanoindentation experiments and the tan(δ) at 0.1 Hz obtained from bulk rheology experiments for the same data shown in d and e (R 2 = 0.9797, mean ± SD). Note that elastic hydrogels dissipated less than 50% of the original stress, so the relaxation half time was taken from the time point resulting in a stress value as close as possible to 50%. g) Representative images of homogeneous fibronectin (FN) coating on elastic and viscoelastic PAAm hydrogels. h) Representative images of micropatterned FN coating on elastic and viscoelastic PAAm hydrogels.
Figure 2
Figure 2
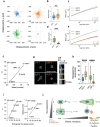
Viscoelasticity modulates cell spreading, FAs, and YAP nuclear import in opposite directions on soft and stiff substrates. a) Representative Actin/DNA images of typical MCF‐10A cell morphologies observed on elastic and viscoelastic PAAm matrices. b) Quantification of MCF‐10A cell spreading area on Soft E (n = 74 cells), Soft V (n = 51 cells), Stiff E (n = 100 cells), and Stiff V (n = 49 cells) hydrogels from at least two independent experiments. * p = 0.0148, **** p < 0.0001, two‐way ANOVA with Bonferroni's multiple comparisons test. c) Quantification of MCF‐10A cell circularity on Soft E (n = 74 cells), Soft V (n = 51 cells), Stiff E (n = 100 cells), and Stiff V (n = 49 cells) hydrogels from at least two independent experiments. ** p = 0.0061, **** p < 0.0001, two‐way ANOVA with Bonferroni's multiple comparisons test. d) Representative FAs (Vinculin) images of MCF‐10A cells cultured on elastic and viscoelastic PAAm hydrogels. e) Distribution of individual FA area of MCF‐10A cells cultured on Soft E (n = 685 adhesions), Soft V (n = 1301 adhesions), Stiff E (n = 3055 adhesions) and Stiff V (n = 580 adhesions) hydrogels. Data was obtained from at least two independent experiments. f) Quantification of the number of FAs per cell (#FAs/cell) of MCF‐10A cells cultured on Soft E (n = 33 cells), Soft V (n = 41 cells), Stiff E (n = 58 cells) and Stiff V (n = 27 cells) hydrogels from at least two independent experiments. ns p = 0.1413, **** p < 0.0001, two‐way ANOVA with Bonferroni's multiple comparisons test. g) Plotting the #FAs/cell versus the cell spreading area reveals a linear relationship between the two variables (R 2 = 0.9758, mean ± SEM). h) Representative YAP images of MCF‐10A cells cultured on elastic and viscoelastic PAAm hydrogels. The cell's outline is highlighted by a dashed yellow line. Note the absence of almost any cytoplasmic YAP on Stiff E matrices compared to the other conditions. i) Quantification of the Nuclear to Cytoplasmic (Nuc/Cyto) YAP ratio of MCF‐10A cells cultured on Soft E (n = 157 cells), Soft V (n = 128 cells), Stiff E (n = 320 cells), Stiff V (n = 113 cells) hydrogels from at least two independent experiments. ns p = 0.5161, **** p < 0.0001, two‐way ANOVA with Bonferroni's multiple comparisons test. j) Nuc/Cyto YAP ratio increases linearly with cell spreading area on viscoelastic PAAm hydrogels (R 2 = 0.9319, mean ± SEM).
Figure 3
Figure 3
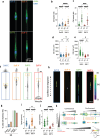
Viscoelasticity enhances migration speed and persistence on soft substrates, while impeding them on stiff substrates via actin retrograde flow and adhesions regulation. a) Representative x–y trajectories of MCF‐10A cells on elastic and viscoelastic PAAm hydrogels over 5 h (n = 48 trajectories for Soft E, n = 43 trajectories for Soft V, n = 49 trajectories for Stiff E, n = 34 trajectories for Stiff V). b) MCF‐10A cell migration speed on soft elastic (Soft E, n = 56 cells) and viscoelastic (Soft V, n = 61 cells) matrices obtained from three independent experiments. *** p = 0.0007, unpaired two‐tailed t‐test. c) Average mean square displacement (MSD) versus lag time for MCF‐10A cells on soft elastic (Soft E) and viscoelastic (Soft V) matrices. The diffusion exponent, α, is shown in the graph. Data is shown as mean ± SEM (n = 48 cells for Soft E, n = 43 cells for Soft V) from three independent experiments. d) MCF‐10A cell migration speed on stiff elastic (Stiff E, n = 55 cells) and viscoelastic (Stiff V, n = 35 cells) matrices obtained from at least two independent experiments. *** p = 0.0007, unpaired two‐tailed t‐test. **** p < 0.0001, unpaired two‐tailed t‐test. e) Average MSD versus lag time for cells on stiff elastic (Stiff E) and viscoelastic (Stiff V) matrices. The diffusion exponent, α, is shown in the graph. Data is shown as mean ± SEM (n = 49 cells for Stiff E, n = 34 cells for Stiff V) from at least two independent experiments. f) Diffusion exponent, α, plotted against average cell migration speed (R 2 = 0.8414, mean ± SEM) for the same number of cells and independent experiments as in b–d (for cell migration speed) and c–e (for MSD). g) Representative images of MCF‐10A tagged with live Spy555‐FastAct on elastic and viscoelastic PAAm hydrogels. Yellow line shows location where kymographs were computed, on average. Insets show representative kymographs for each condition, with yellow line indicating the slope from which the actin retrograde flow speed is computed. The spatial scale bar in the inset is 2 µm, whereas the temporal scale bar is 2 min. h) Quantification of actin retrograde flow speed for MCF‐10A cells cultured on Soft E (n = 19 kymographs), Soft V (n = 48 kymographs), Stiff E (n = 44 kymographs) and Stiff V (n = 52 kymographs) hydrogels from at least two independent experiments. **** p < 0.0001, two‐way ANOVA with Bonferroni's multiple comparisons test. i) Diffusion exponent, α, versus actin retrograde flow speed (left, R 2 = 0.9711); and migration speed versus actin retrograde flow speed (right, R 2 = 0.8322). Data is shown as mean ± SEM for the same number of cells/kymographs as in c‐e and h, respectively. j) Schematic summary of experimental findings on how matrix viscoelasticity modulates MCF‐10A cell migration speed and persistence via actin retrograde flow speed and adhesion dynamics. Green arrows inside the cells represent actin retrograde flow, whereas colorful arrows outside the cell depict schematic migration trajectories. Dashed blue box shows condition where optimal migration occurs (Soft V).
Figure 4
Figure 4
Spatial confinement blunts viscoelasticity‐mediated effects on soft matrices and reduces them on stiff matrices. a) Representative Actin/DNA images of confined MCF‐10A cells on 5 µm FN lines on elastic and viscoelastic PAAm hydrogels. FN lines are schematically represented as dashed lines for clarity. b) Quantification of MCF‐10A cell aspect ratio on 2D and 1D soft elastic (Soft E) and viscoelastic (Soft V) matrices (n = 74 cells for Soft E 2D, n = 40 cells for Soft E 1D, n = 50 cells for Soft V 2D, n = 24 cells for Soft V 1D) from at least two independent experiments. **** p < 0.0001, two‐way ANOVA with Tukey's multiple comparisons test. c) Quantification of MCF‐10A cell aspect ratio on 2D and 1D stiff elastic (Stiff E) and viscoelastic (Stiff V) matrices (n = 100 cells for Stiff E 2D, n = 59 cells for Stiff E 1D, n = 48 cells for Stiff V 2D, n = 29 cells for Stiff V 1D) from at least two independent experiments. **** p < 0.0001, *** p = 0.0006, two‐way ANOVA with Tukey's multiple comparisons test. d) Quantification of MCF‐10A cell spreading area on 2D and 1D soft elastic (Soft E) and viscoelastic (Soft V) matrices (n = 74 cells for Soft E 2D, n = 40 cells for Soft E 1D, n = 50 cells for Soft V 2D, n = 24 cells for Soft V 1D) from at least two independent experiments. ns p > 0.05, two‐way ANOVA with Tukey's multiple comparisons test. e) Quantification of MCF‐10A cell spreading area on 2D and 1D stiff elastic (Stiff E) and viscoelastic (Stiff V) matrices (n = 100 cells for Stiff E 2D, n = 59 cells for Stiff E 1D, n = 48 cells for Stiff V 2D, n = 29 cells for Stiff V 1D) from at least two independent experiments. **** p < 0.0001, * p = 0.0473, ns p = 0.0588, two‐way ANOVA with Tukey's multiple comparisons test. f) Representative FAs (Vinculin) images of confined MCF‐10A cells on 5 µm FN lines on elastic and viscoelastic PAAm hydrogels. FN lines are schematically represented as dashed lines for clarity. Scale bar in the inset is 5 µm. g) Percentage of cells forming front and rear vinculin adhesions pooled from two independent experiments (n = 13 cells for Soft E, n = 17 cells for Soft V, n = 31 cells for Stiff E, n = 16 cells for Stiff V). h) Representative temporal color‐coded time lapses of MCF‐10A migrating on 5 µm FN lines. The direction of confined migration is shown by a dashed line. i) Quantification of MCF‐10A cell migration speed on 2D and 1D soft elastic (Soft E) and viscoelastic (Soft V) matrices (n = 56 cells for Soft E 2D, n = 38 cells for Soft E 1D, n = 61 cells for Soft V 2D, n = 14 cells for Soft V 1D) from at least two independent experiments. **** p < 0.0001, ns p = 0.9911, two‐way ANOVA with Tukey's multiple comparisons test. j) Quantification of MCF‐10A cell migration speed on 2D and 1D stiff elastic (Stiff E) and viscoelastic (Stiff V) matrices (n = 55 cells for Stiff E 2D, n = 61 cells for Stiff E 1D, n = 35 cells for Stiff V 2D, n = 26 cells for Stiff V 1D) from at least two independent experiments. **** p < 0.0001, two‐way ANOVA with Tukey's multiple comparisons test. k) Schematic representation of how confinement modulates viscoelasticity sensing compared to 2D matrices. Colorful arrows show how clutch sensitivity (as indicated by the measured outputs) to ECM viscoelastic properties (here schematically represented by a standard linear solid lumped model) changes in each condition. Overall, confinement blunts ECM viscoelasticity mechanotransduction effects on soft ECMs and reduces them on stiff ECMs. Dashed blue boxes show conditions where optical migration occurs (Soft V 2D and Stiff E 1D). For all plots in this figure the central bar represents the mean, whereas the error bars represent the SD.

References

    1. Guimarães C. F., Gasperini L., Marques A. P., Reis R. L., Nat. Rev. Mater. 2020, 5, 351.
    1. Atcha H., Choi Y. S., Chaudhuri O., Engler A. J., Cell Stem Cell 2023, 30, 750. - PMC - PubMed
    1. Kechagia J. Z., Ivaska J., Roca‐Cusachs P., Nat. Rev. Mol. Cell Biol. 2019, 20, 457. - PubMed
    1. Janmey P. A., Fletcher D. A., Reinhart‐King C. A., Physiol. Rev. 2020, 100, 695. - PMC - PubMed
    1. Lo C.‐M., Wang H.‐B., Dembo M., Wang Y., Biophys. J. 2000, 79, 144. - PMC - PubMed

LinkOut - more resources