Clinical Trial
. 2025 Mar;7(2):e240138.
doi: 10.1148/rycan.240138.

Tumor Biomechanics Quantified Using MR Elastography to Predict Response to Neoadjuvant Chemotherapy in Individuals with Breast Cancer

Affiliations
Clinical Trial

Tumor Biomechanics Quantified Using MR Elastography to Predict Response to Neoadjuvant Chemotherapy in Individuals with Breast Cancer

Aaditya P Sinha et al. Radiol Imaging Cancer. 2025 Mar.

Abstract

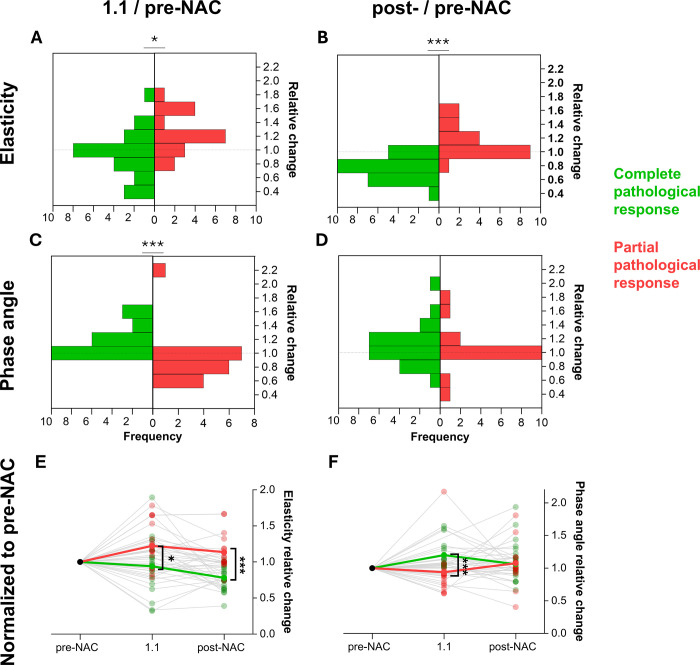
Purpose To evaluate the ability of MR elastography (MRE) to noninvasively quantify tissue biomechanics and determine the added diagnostic value of biomechanics for predicting response throughout neoadjuvant chemotherapy (NAC). Materials and Methods In this prospective study (between September 2020 and August 2023; registration no. NCT03238144), participants with breast cancer scheduled to undergo NAC underwent five MRE scans at different time points alongside clinical dynamic contrast-enhanced MRI (DCE MRI). Regions of interest were drawn over the tumor region for the first two scans, while for the post-NAC scan, the initial pre-NAC tumor footprint was used. Biomechanics, specifically tumor stiffness and phase angle within these regions of interest, were quantified as well as the corresponding ratios relative to before NAC (tumor-stiffness ratio and phase-angle ratio, respectively). Postsurgical pathologic analysis was used to determine complete and partial responders. Furthermore, a repeatability analysis was performed for 18 participants. Results Datasets of 41 female participants (mean age, 47 years ± 12.5 [SD]) were included in this analysis. The tumor-stiffness ratio following NAC decreased significantly for complete responders and increased for partial responders (0.76 ± 0.16 and 1.14 ± 0.24, respectively; P < .001). The phase-angle ratio after the first cycle of the first NAC regimen compared with before NAC predicted pathologic response (1.23 ± 0.31 vs 0.91 ± 0.34; P < .001). Combining the tumor stiffness ratio with DCE MRI improved specificity compared with DCE MRI alone (96% vs 44%) while maintaining the high sensitivity of DCE MRI (94%). Repeatability analysis showed excellent agreement for elasticity (repeatability coefficient, 8.3%) and phase angle (repeatability coefficient, 5%). Conclusion MRE-derived phase-angle ratio and tumor stiffness ratio were associated with pathologic complete response in participants with breast cancer undergoing NAC, and a combined DCE MRI plus MRE approach significantly enhanced specificity for identification of complete responders after NAC, while maintaining high sensitivity. Keywords: Breast Cancer, MR Elastography, Neoadjuvant Chemotherapy, Dynamic Contrast-enhanced MRI Supplemental material is available for this article. Clinical trials registration no. NCT03238144 Published under a CC BY 4.0 license.

Keywords: Breast Cancer; Dynamic Contrast-enhanced MRI; MR Elastography; Neoadjuvant Chemotherapy.


Conflict of interest statement

Disclosures of conflicts of interest: A.P.S. No relevant relationships. P.J. No relevant relationships. A.S.v.S. No relevant relationships. O.D. No relevant relationships. B.S. No relevant relationships. G.A. No relevant relationships. Z.P. No relevant relationships. H.J. No relevant relationships. K.W. No relevant relationships. A.M. No relevant relationships. J.S. No relevant relationships. A.K. No relevant relationships. H.H. No relevant relationships. G.B. No relevant relationships. V.K. No relevant relationships. M.T. Data safety monitoring board member of multiple clinical trials (ADD-Aspirin, CaPP3, GISTAR, COLO-PREVENT, TARGIT-B, TOGAS); steering committee member of multiple societies (International Cancer Prevention Society, UK Therapeutic Cancer Prevention Network, Cancer Prevention Europe, European Code Against Cancer 5 working group, Advisory Committee on Clinical Impact Awards sub-committee, The Norwegian Cancer Society, Research Peer-Review Committee Cancer Research UK, Prevention and Population Research Committee Expert Review Panel [ad hoc member]). E.S. No relevant relationships. A.S. No relevant relationships. A.R. No relevant relationships. T.N. Grants from EU IMI2, CRUK City of London Cancer Centre: a UCL-Barts-King’s-Crick CRUK Major Centre initiative, GSK-KCL Translational Oncology Research Hub, CRUK Early Detection and Diagnosis (ED&D) Programme, UCB, Incyte Corporation, Cancer Research UK Early Detection Committee, Cancer Research UK Wellcome Trust, Wellcome Leap, and National Cancer Imaging Translational Accelerator; part-time employee of GSK but this manuscript entirely relates to KCL appointment and the findings bear no impact or relationship to work within GSK. S.P. Grants from the National Institute for Health Research, Guy’s & St Thomas’ Charity, Medical Research Council, Wellcome Leap, Butterfield Trust, and Cancer Research UK; payment for educational events from Exact Science, Daiichi-Sankyo, Roche, and AstraZeneca; travel support from Exact Science, India Breast Meeting 2024, Roche, and AstraZeneca; advisory board member for Exact Science; independent data monitoring committees for POETIC-A and c-TRAK TN in the last 3 years; chair of the UK National Coordinating Committee for Breast Pathology and president of the Association of Breast Pathology (both unpaid). R.S. No relevant relationships. A.P. Grants from Wellcome LEAP, Cancer Research UK, Medical Research Council, and Guy’s Cancer Charity; leadership roles with Maggie’s Charity and Richard Dimbleby Cancer Fund Charity.

Figures

None
Graphical abstract
Flowchart and study pathway. (A) Flowchart of participant inclusion.
Ultimately, datasets from 41 participants who fulfilled all necessary
criteria (ie, all scans performed throughout neoadjuvant chemotherapy [NAC],
all scans with sufficient quality, and post-NAC histopathologic analyses
available) were included in this analysis. (B) Participants received three
or four cycles of the first regimen and three or four cycles of the second
regimen prior to post-NAC surgical intervention. In total, five MRI and MR
elastography (MRE) sessions were interlaced with the NAC regimen.
Figure 1:
Flowchart and study pathway. (A) Flowchart of participant inclusion. Ultimately, datasets from 41 participants who fulfilled all necessary criteria (ie, all scans performed throughout neoadjuvant chemotherapy [NAC], all scans with sufficient quality, and post-NAC histopathologic analyses available) were included in this analysis. (B) Participants received three or four cycles of the first regimen and three or four cycles of the second regimen prior to post-NAC surgical intervention. In total, five MRI and MR elastography (MRE) sessions were interlaced with the NAC regimen.
Gravitational transducer (GT) setup for the breast MRI coil. (A) The
GT-based MR elastography breast setup consists of two eccentric masses that
rotate around an axis that is oriented right-left. The flexible shaft that
transmits the rotations from the motor to the transducer arrives from the
head direction and connects to the transducer via a bayonet connection. (B)
The entire GT setup is incorporated into the four-channel biopsy coil from
Siemens. It hosts the transducer as well as active and passive paddles. The
passive paddles are movable in the feet-head direction to ensure that the
breasts have proper mechanical contact with the active paddles, which are
fixed to the GT and only vibrate and cannot be moved. (C) Sketch of the
entire setup showing the patient, the paddles, the GT, and the rotating
flexible shaft entering from the head side. RF = radiofrequency.
Figure 2:
Gravitational transducer (GT) setup for the breast MRI coil. (A) The GT-based MR elastography breast setup consists of two eccentric masses that rotate around an axis that is oriented right-left. The flexible shaft that transmits the rotations from the motor to the transducer arrives from the head direction and connects to the transducer via a bayonet connection. (B) The entire GT setup is incorporated into the four-channel biopsy coil from Siemens. It hosts the transducer as well as active and passive paddles. The passive paddles are movable in the feet-head direction to ensure that the breasts have proper mechanical contact with the active paddles, which are fixed to the GT and only vibrate and cannot be moved. (C) Sketch of the entire setup showing the patient, the paddles, the GT, and the rotating flexible shaft entering from the head side. RF = radiofrequency.
Axial elastograms with corresponding T2-weighted images as examples
for biomechanical changes in the tumor region. (A, B) Stiffness evolution
for a responder (aged 72 years) and partial responder (aged 28 years) from
before NAC (left) to after NAC (right), respectively. Response appears to
lead to a relative drop in tumor bed stiffness, while resistance leads to a
corresponding increase. (C, D) Phase angle evolution for a responder (aged
47 years) and partial responder (aged 32 years) from before NAC (left) to
time point 1.1 (right), respectively. Response appears to lead to a relative
increase in phase angle within the tumor bed, while resistance leads to a
corresponding drop.
Figure 3:
Axial elastograms with corresponding T2-weighted images as examples for biomechanical changes in the tumor region. (A, B) Stiffness evolution for a responder (aged 72 years) and partial responder (aged 28 years) from before NAC (left) to after NAC (right), respectively. Response appears to lead to a relative drop in tumor bed stiffness, while resistance leads to a corresponding increase. (C, D) Phase angle evolution for a responder (aged 47 years) and partial responder (aged 32 years) from before NAC (left) to time point 1.1 (right), respectively. Response appears to lead to a relative increase in phase angle within the tumor bed, while resistance leads to a corresponding drop.
Changes in biomechanics at different time points. (A–D)
Histograms of the relative change for elasticity for cycle 1.1 and following
neoadjuvant chemotherapy (NAC) normalized to before NAC (A, B) and phase
angle for cycle 1.1 and following NAC normalized to before NAC (C, D),
respectively. (E, F) Stem plots are shown for the elasticity (E) and phase
angle (F) normalized to before NAC for postcycle 1.1 and following NAC. Note
that these measures originate before NAC and after NAC from the tumor
footprint while at 1.1 from the tumor region of interest. Green indicates
all participants with complete pathologic response and red indicates all
participants with partial pathologic response. * P < .05,
*** P < .001.
Figure 4:
Changes in biomechanics at different time points. (A–D) Histograms of the relative change for elasticity for cycle 1.1 and following neoadjuvant chemotherapy (NAC) normalized to before NAC (A, B) and phase angle for cycle 1.1 and following NAC normalized to before NAC (C, D), respectively. (E, F) Stem plots are shown for the elasticity (E) and phase angle (F) normalized to before NAC for postcycle 1.1 and following NAC. Note that these measures originate before NAC and after NAC from the tumor footprint while at 1.1 from the tumor region of interest. Green indicates all participants with complete pathologic response and red indicates all participants with partial pathologic response. * P < .05, *** P < .001.
Tumor stiffness and phase angle gauge pathologic response at
end–neoadjuvant chemotherapy (NAC) and early at 1.1, respectively.
(A) The change in tumor bed stiffness at post-NAC relative to pre-NAC is
shown for all participants (left) and consecutively as a function of the
individual receptor status of the patient. Green circles indicate
participants with pathologic complete response, while red circles indicate
participants with partial pathologic response (as established from
histopathologic analysis after surgery). A stable or rising ratio is
indicative of resistance, while a drop in this ratio is indicative of
response. As expected, most responders belong to the triple-negative breast
cancer (TNBC) receptor status group. The horizontal gray region indicates
the repeatability coefficient. (B) The change in phase angle within the
tumor region after the first cycle (1.1) relative to pre-NAC is shown for
all participants (left) and consecutively as a function of the individual
receptor status of the patient. Here, a drop in phase angle is indicative of
resistance while a rise is indicative of response.
Figure 5:
Tumor stiffness and phase angle gauge pathologic response at end–neoadjuvant chemotherapy (NAC) and early at 1.1, respectively. (A) The change in tumor bed stiffness at post-NAC relative to pre-NAC is shown for all participants (left) and consecutively as a function of the individual receptor status of the patient. Green circles indicate participants with pathologic complete response, while red circles indicate participants with partial pathologic response (as established from histopathologic analysis after surgery). A stable or rising ratio is indicative of resistance, while a drop in this ratio is indicative of response. As expected, most responders belong to the triple-negative breast cancer (TNBC) receptor status group. The horizontal gray region indicates the repeatability coefficient. (B) The change in phase angle within the tumor region after the first cycle (1.1) relative to pre-NAC is shown for all participants (left) and consecutively as a function of the individual receptor status of the patient. Here, a drop in phase angle is indicative of resistance while a rise is indicative of response.
Receiver operating characteristic (ROC) analysis for different
predictors of pathologic response. (A) ROC curve for different approaches to
predict complete pathologic response: tumor stiffness ratio (TSR; green),
classic MRI using dynamic contrast-enhanced (DCE) MRI (beige), and
dual-approach DCE MRI and MR elastography (MRE; blue). (B) Proposed decision
pathway to combine DCE MRI at post-NAC and TSR for predicting pathologic
response.
Figure 6:
Receiver operating characteristic (ROC) analysis for different predictors of pathologic response. (A) ROC curve for different approaches to predict complete pathologic response: tumor stiffness ratio (TSR; green), classic MRI using dynamic contrast-enhanced (DCE) MRI (beige), and dual-approach DCE MRI and MR elastography (MRE; blue). (B) Proposed decision pathway to combine DCE MRI at post-NAC and TSR for predicting pathologic response.

References

    1. Arnold M , Morgan E , Rumgay H , et al. . Current and future burden of breast cancer: Global statistics for 2020 and 2040 . Breast 2022. ; 66 : 15 – 23 . - PMC - PubMed
    1. Lifetime risk estimates calculated by the Cancer Intelligence Team at Cancer Research UK . https://www.cancerresearchuk.org/health-professional/cancer-statistics/s.... Published 2023. Updated December 14, 2023. Accessed 2024 .
    1. Simon A , Robb K . Cancer: breast . In: Ayers S , Baum A , McManus C , et al. , eds. Cambridge Handbook of Psychology, Health and Medicine . 2nd ed. Cambridge University Press; , 2022. ; 577 – 580 .
    1. Yau C , Osdoit M , van der Noordaa M , et al. . Residual cancer burden after neoadjuvant chemotherapy and long-term survival outcomes in breast cancer: a multicentre pooled analysis of 5161 patients . Lancet Oncol 2022. ; 23 ( 1 ): 149 – 160 . - PMC - PubMed
    1. Cheng Q , Huang J , Liang J , et al. . The Diagnostic Performance of DCE-MRI in Evaluating the Pathological Response to Neoadjuvant Chemotherapy in Breast Cancer: A Meta-Analysis . Front Oncol 2020. ; 10 : 93 . - PMC - PubMed

Publication types

Associated data