. 2025 Feb 25;44(2):115301.
doi: 10.1016/j.celrep.2025.115301. Epub 2025 Feb 12.

A microRNA-regulated transcriptional state defines intratumoral CD8+ T cells that respond to immunotherapy

Affiliations

A microRNA-regulated transcriptional state defines intratumoral CD8+ T cells that respond to immunotherapy

William W Tang et al. Cell Rep. .

Abstract

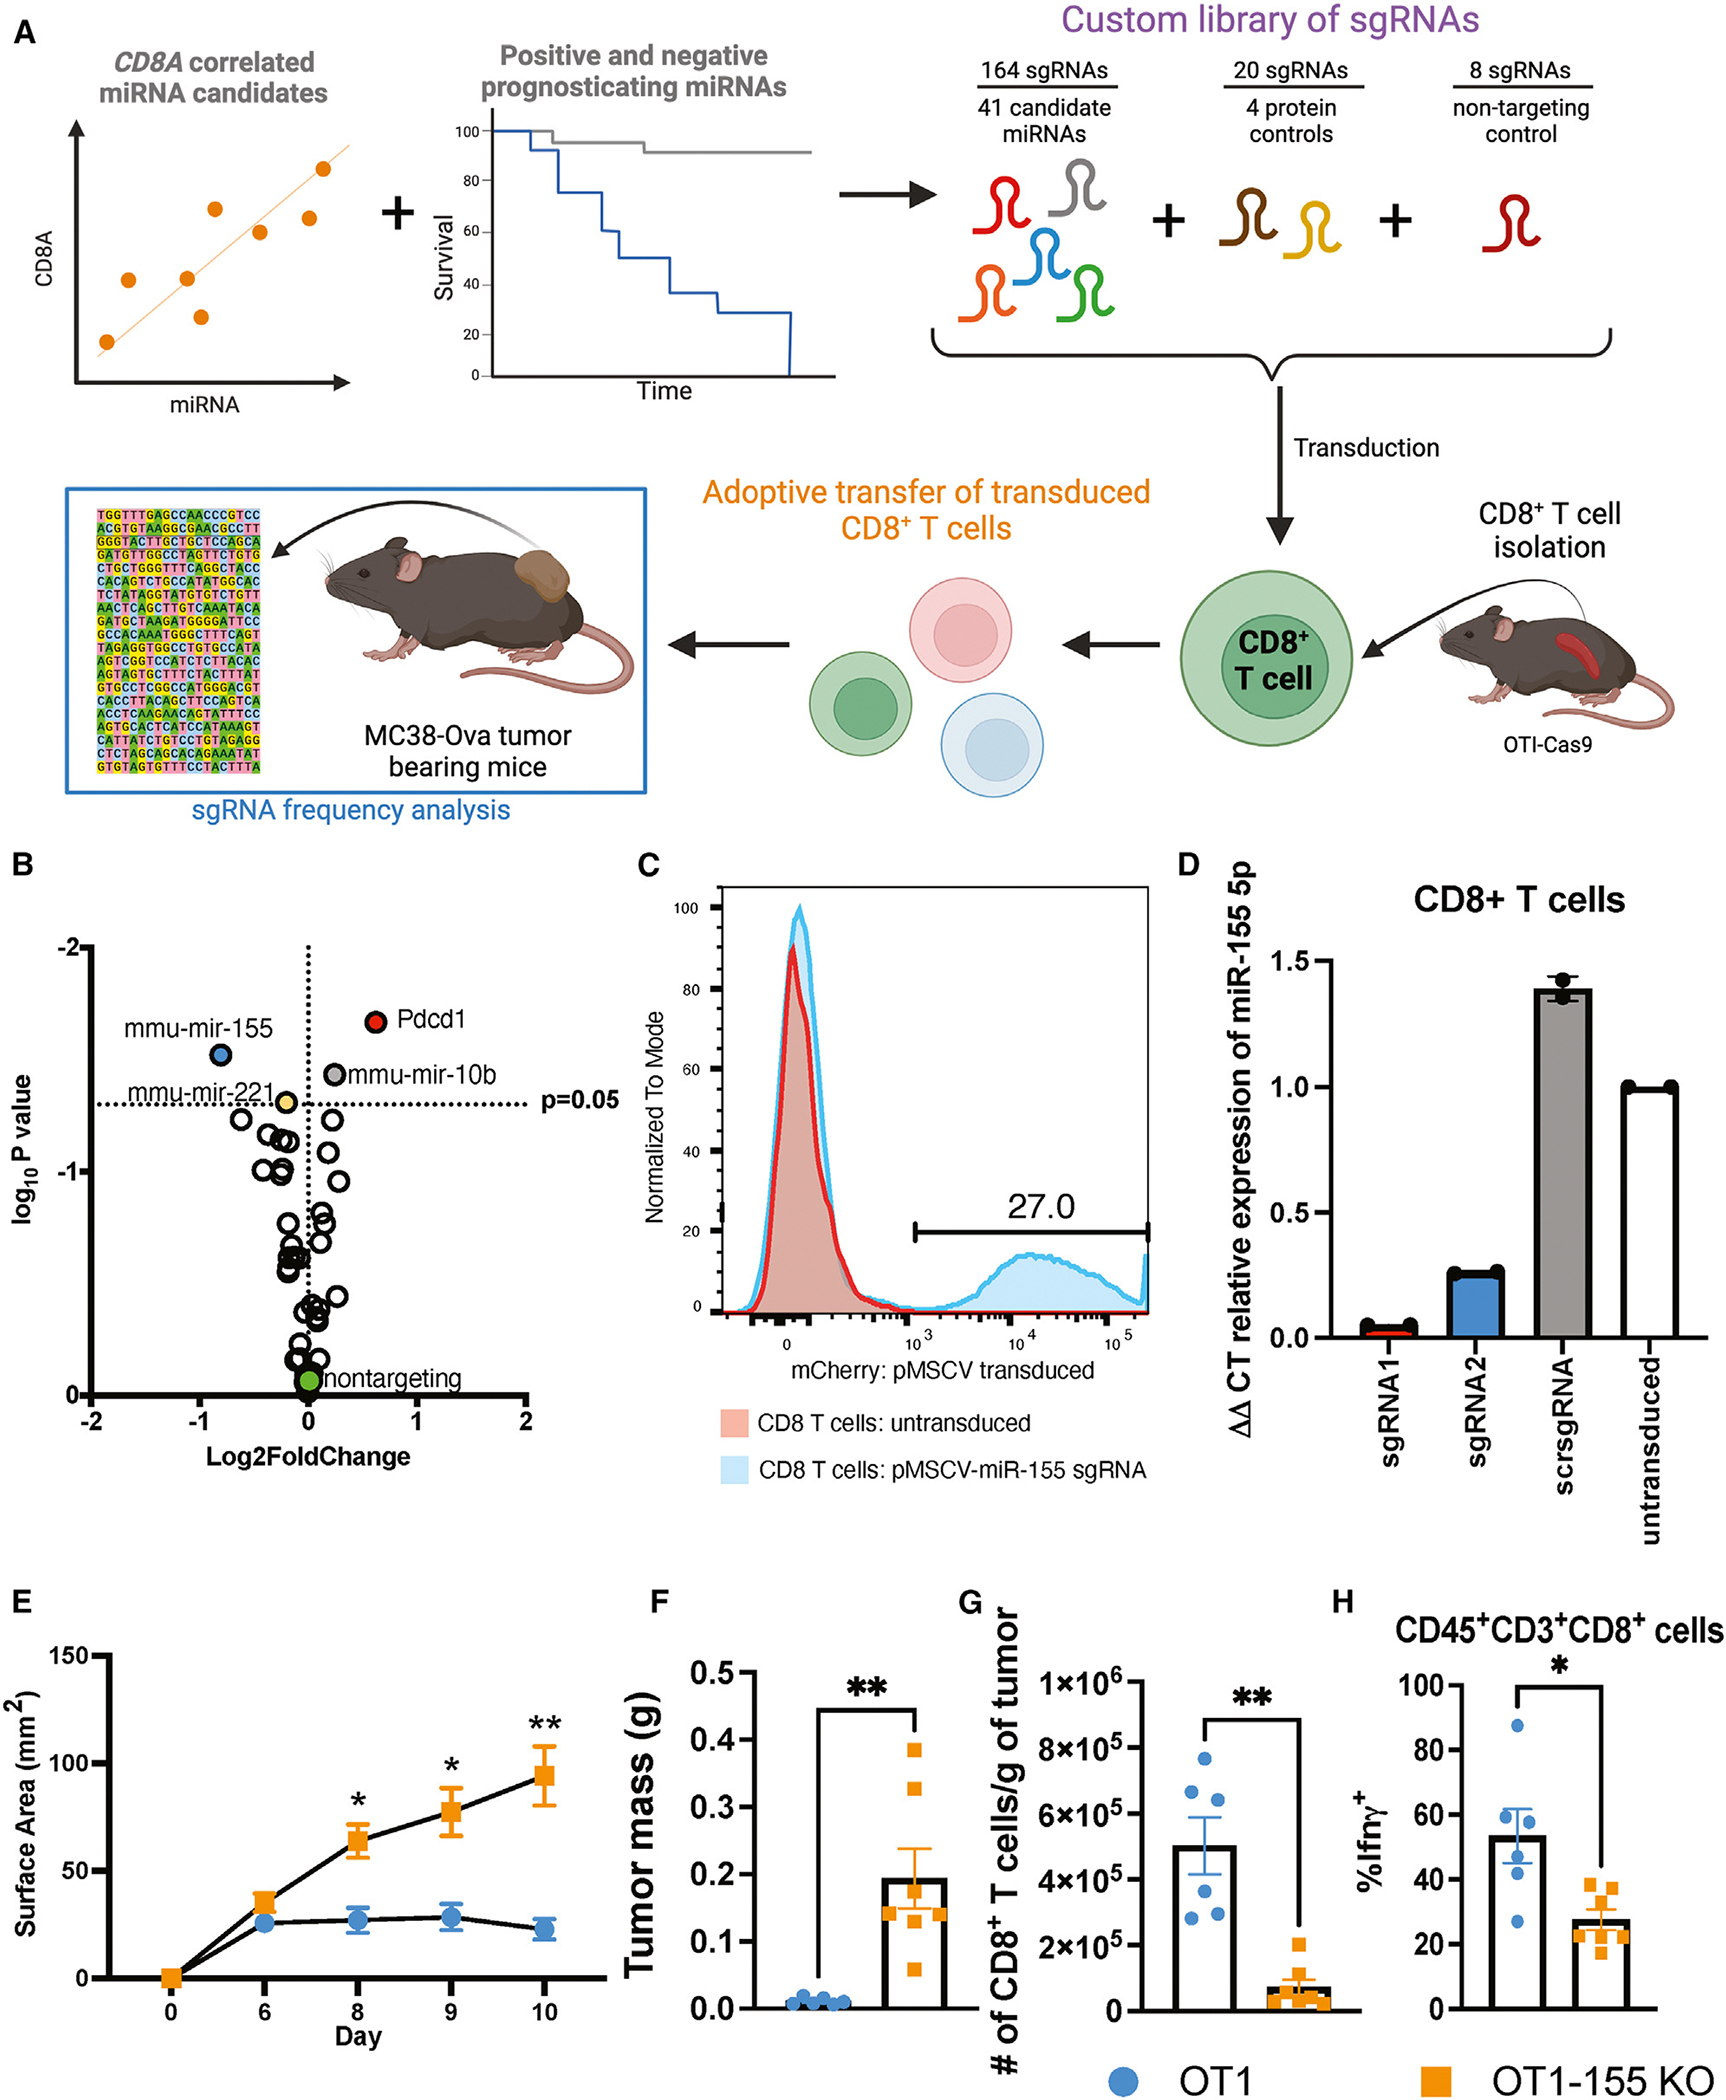
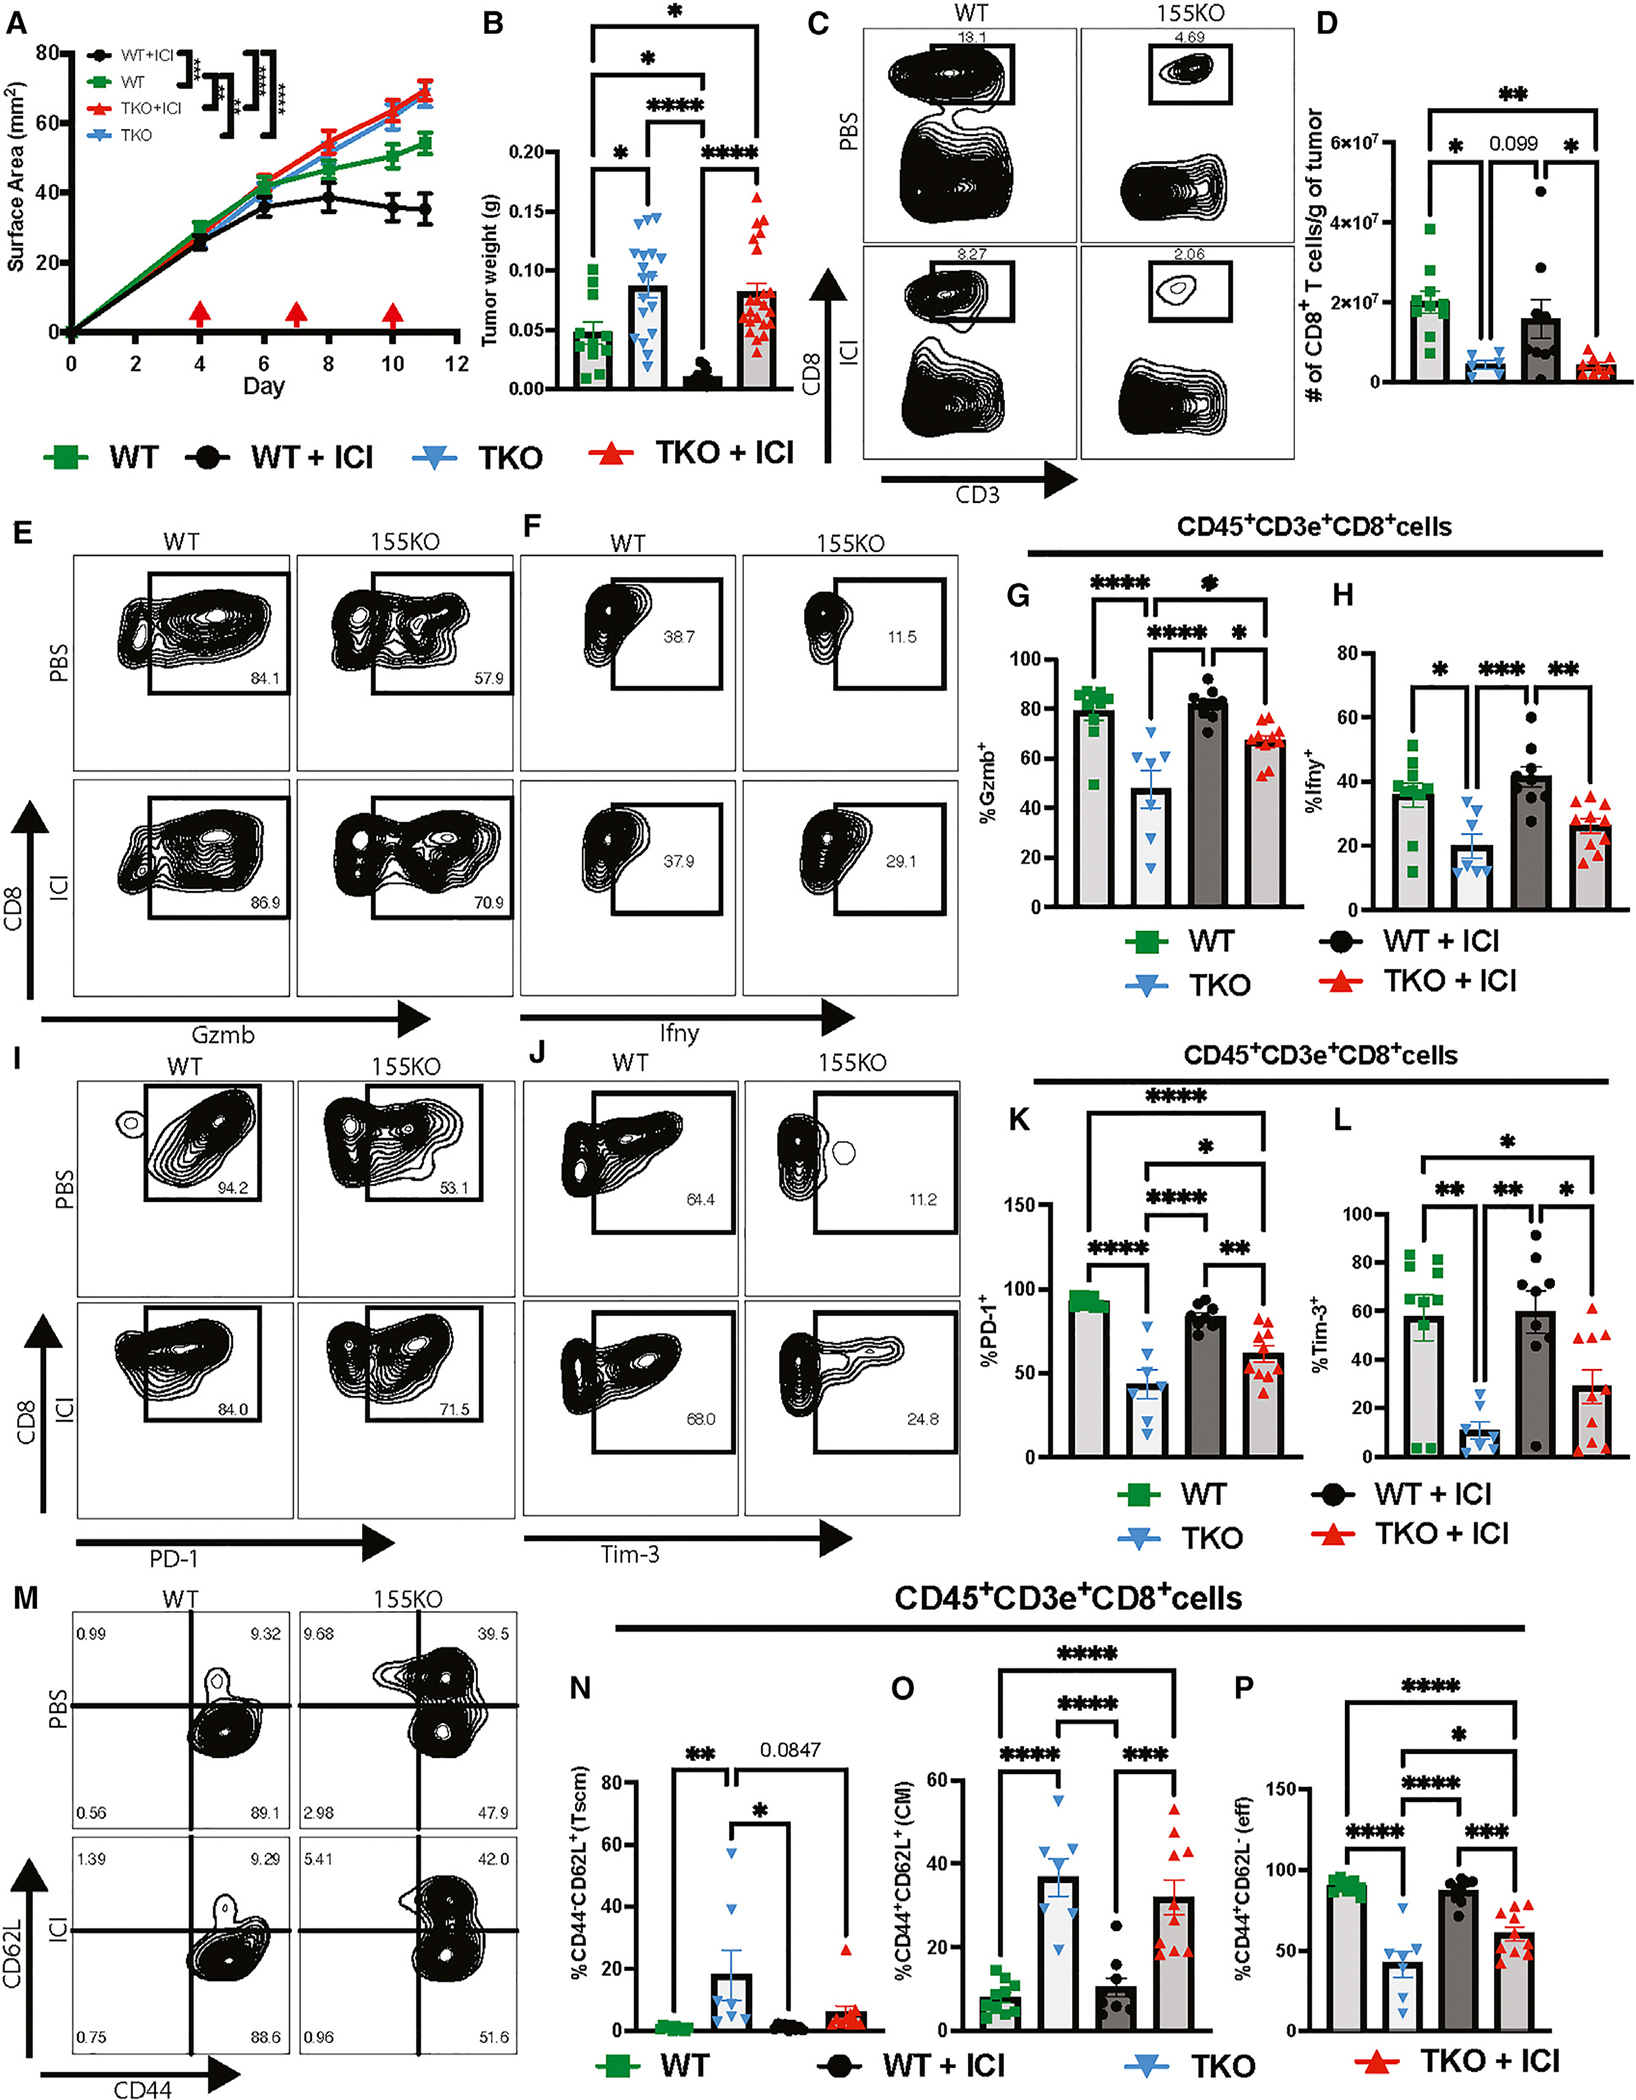
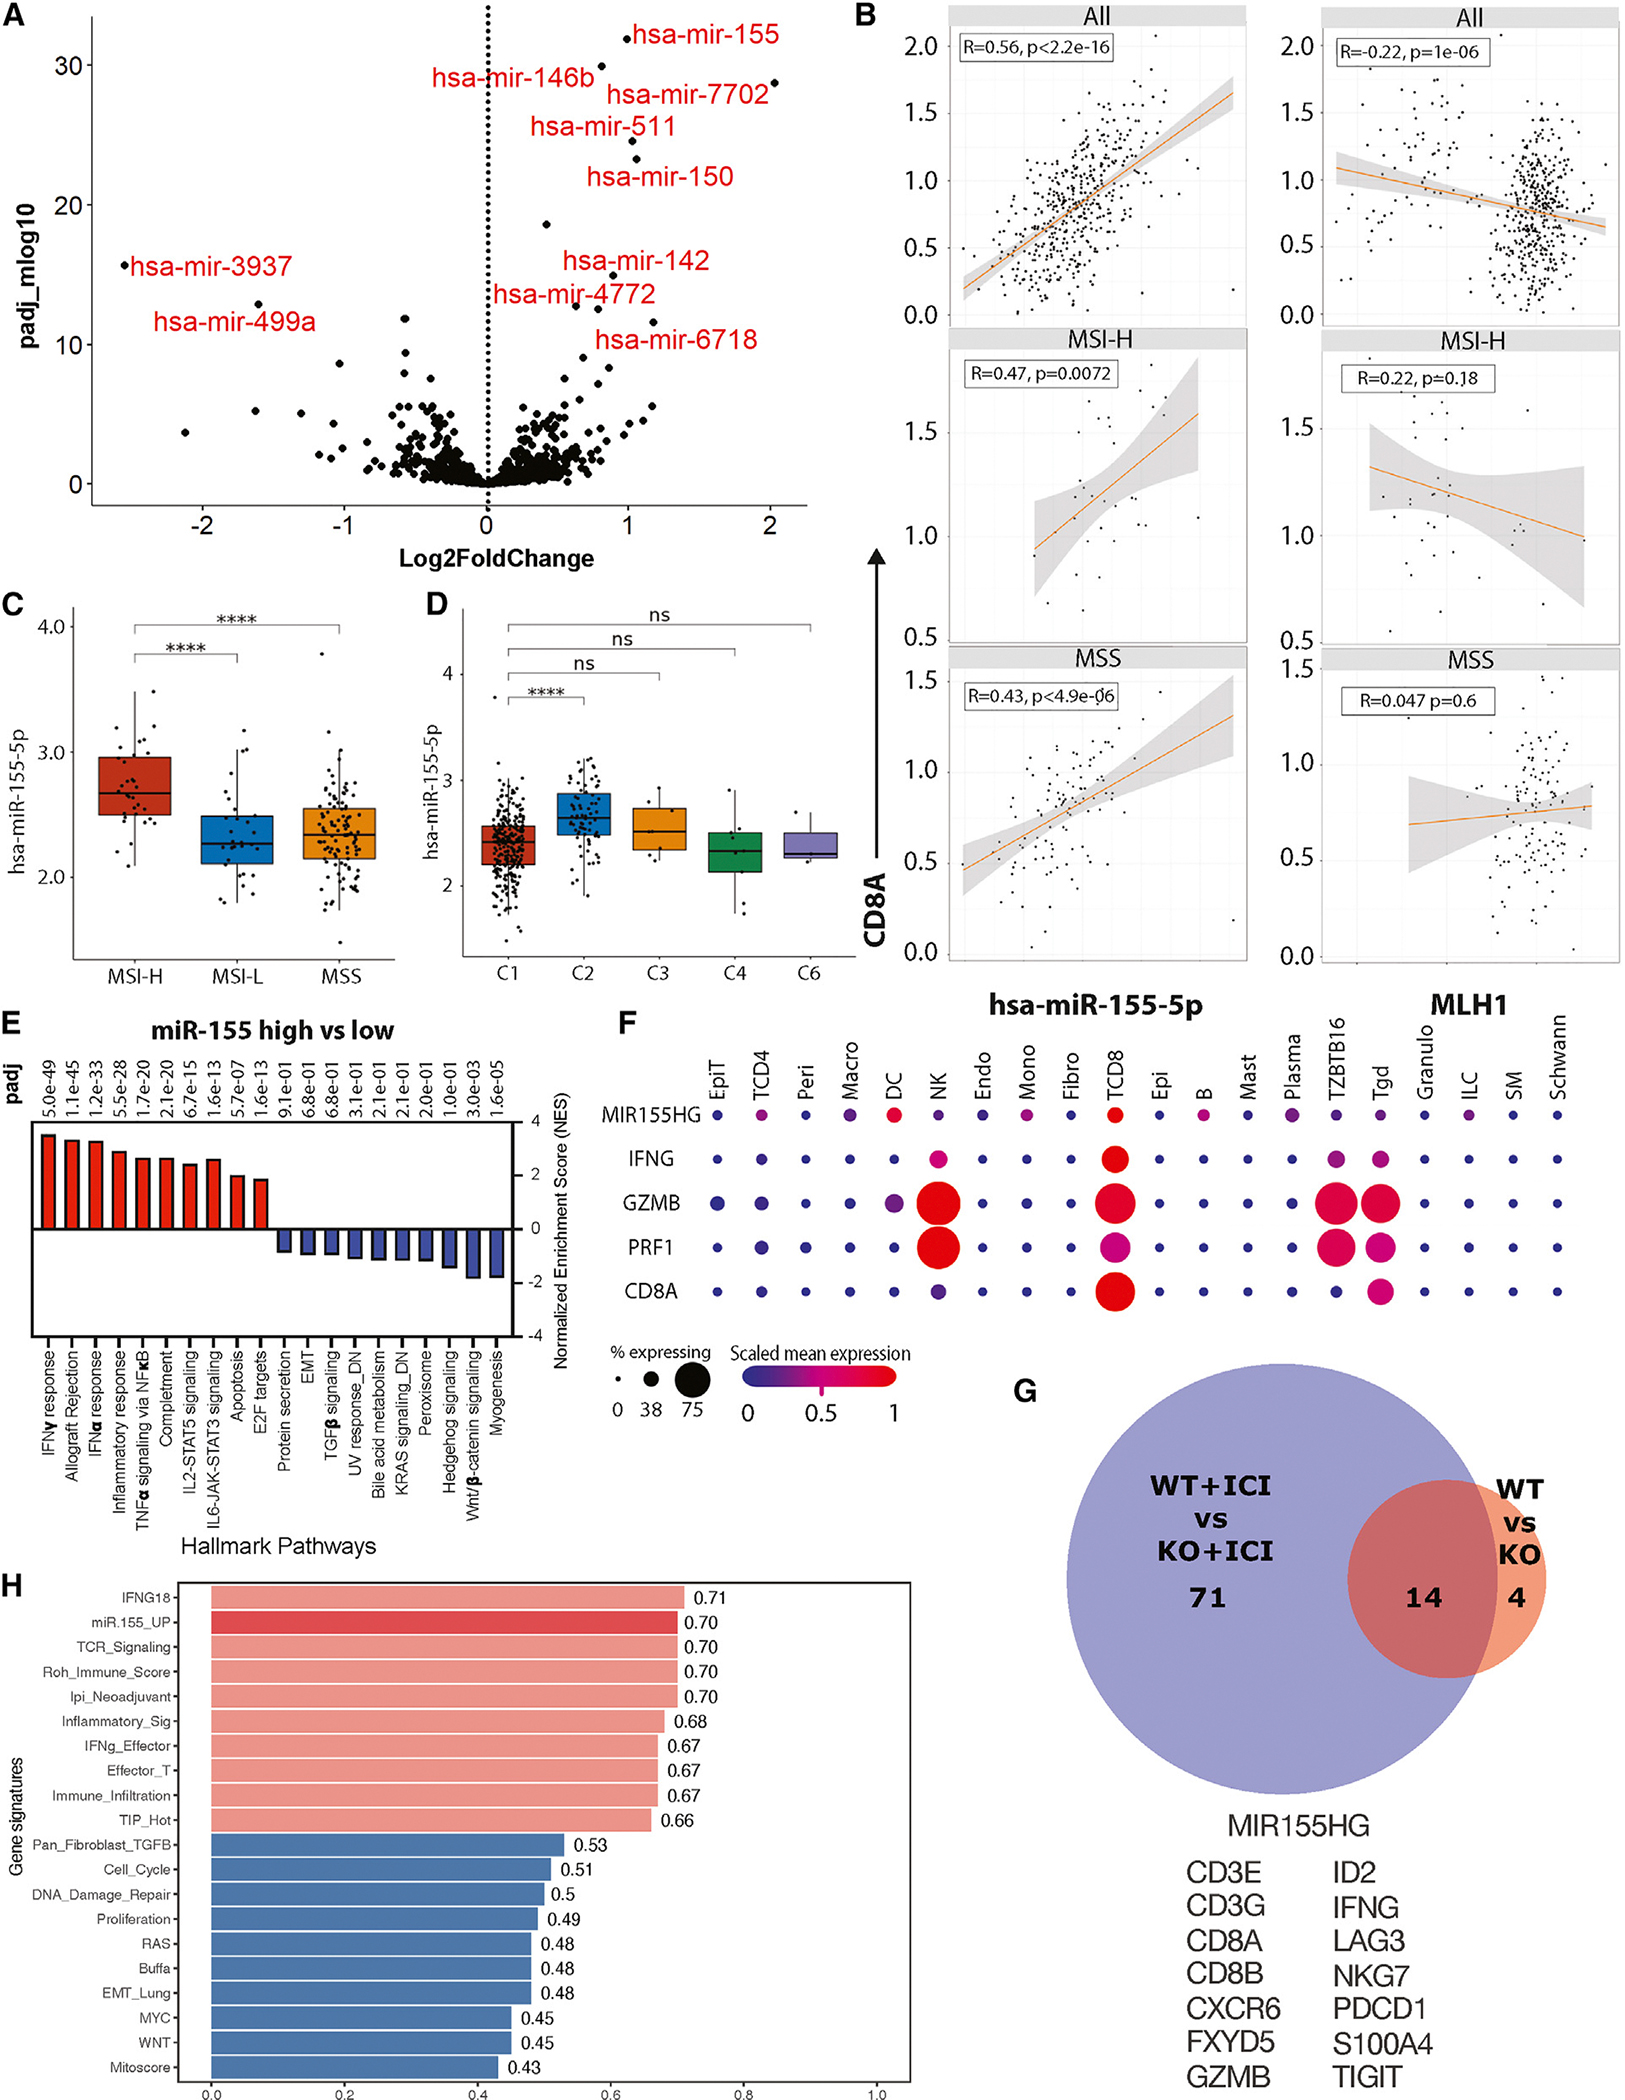
The rising incidence of advanced-stage colorectal cancer (CRC) and poor survival outcomes necessitate new and effective therapies. Immune checkpoint inhibitors (ICIs), specifically anti-PD-1 therapy, show promise, yet clinical determinants of a positive response are suboptimal. Here, we identify microRNA-155 (miR-155) as necessary for CD8+ T cell-infiltrated tumors through an unbiased in vivo CRISPR-Cas9 screen identifying functional tumor antigen-specific CD8+ T cell-expressed microRNAs. T cell miR-155 is required for anti-PD-1 responses and for a vital intratumor CD8+ T cell differentiation cascade by repressing Ship-1, inhibiting Tcf-1 and stemness, and subsequently enhancing Cxcr6 expression, anti-tumor immunity, and effector functions. Based on an underlying miR-155-dependent CD8+ T cell transcriptional profile, we identify a gene signature that predicts ICI responses across 12 diverse cancers. Together, our findings support a model whereby miR-155 serves as a central regulator of CD8+ T cell-dependent cancer immunity and ICI responses that may be leveraged for future therapeutics.

Keywords: CD8(+) T cell; CP: Cancer; CP: Immunology; Cxcr6; Ship-1; Tcf-1; anti-PD-1; biomarker; colorectal cancer; immune checkpoint inhibition; immunotherapy; microRNA-155.


Conflict of interest statement

Declaration of interests A provisional patent was filed on October 10, 2024, that is related to the miR-155 gene signature being a predictor of responses to ICI (U-8545).

Figures

Figure 1.
Figure 1.. A functional in vivo screen targeting miRNAs identifies miR-155 as selectively necessary for eff CD8+ T cell-mediated anti-tumor immunity.
(A) Schematic of the in vivo miRNA CRISPR-Cas9 screen. miRNAs were selected based on positive correlation with CD8A in COAD and TCGA projects with miRNA sequencing data, excluding leukemias and lymphomas, and with positive and negative prognostic power (Cox and Kaplan-Meier [KM] analysis in the SKCM-immune or cell-type identification by estimating relative subsets of RNA transcripts [CIBERSORT]-CD8a-high cohort). 2E5 mCherry+ (library-transduced) cells were adoptively transferred intravenously (i.v.) into TCRβKO mice 7 days post challenge with 1E6 MC38-OVA cells subcutaneously. (B) PCR barcode enrichment quantification with log2fold change normalized to input sgRNA barcode representation; one sample t and Wilcoxon tests; dashed line, p = 0.05; n = 4. (C and D) Representative mCherry+ FACs of transduced CD8+ T cells with psMSCV-miR-155 sgRNA (C) relative expression of miR-155–5p in mCherry+ CD8+ T cells (n = 2) (D). (E–H) TCRβKO mice challenged with MC38-OVA cells and given 2E5 OT1 or OT1-miR155 KO (OT1–155KO) CD8+ T cells i.v.; n= 6–8 per group; tumor growth kinetics (E), tumor mass (F), number of CD8+ T cells/g of tumor (G), percentage of IFNγ+ CD8+ T cells (H); two-way ANOVA with multiple comparisons; t test with Welsh’s correction; *p > 0.05, **p > 0.01. Bars represent mean; error bars represent SEM. See also Figure S1.
Figure 2.
Figure 2.. T cell miR-155 promotes eff T cell-mediated antitumor immunity in two molecular subtypes of colon cancer.
(A and B) Tumor growth kinetics (A) and tumor mass (B) of miR-155fl/fl (WT) or miR-155fl/fl CD4Cre+/ (miR-155 TKO) mice challenged with MC38-OVA cells and given 2E5 OT1 CD8+ T cells or PBS i.v. 3 days post-injection (d.p.i).; n= 6–8. (C–H) Frequency of intratumoral CD8+ T cells (C and D), IFNγ+ (E and G), and Gzmb+ (F and H) in WT or miR-155 TKO mice challenged with MC38 cells; n= 7–11. (I and J) Frequency of intratumoral eff CD44+CD62L (I) and PD-1+ (J) CD8+ T cells in WT or miR-155 TKO mice challenged with MC38-OVA cells; n = 5–6. (K–M) Tumor area measurements (K) and polyp count (L) of WT or miR-155 TKO mice challenged with AOM/DSS (M). Data were pooled from two replicate experiments; n = 17–20. (P–U) Frequency and number of CD8+ T cells/g of tumor (N and O) and frequency of intratumoral Tscm CD44CD62L+ (P and R), CM CD44+CD62L+ (P and S), eff CD44+CD62L (P and T), and PD-1+ (Q and U) CD8+ T cells; n = 5–6. t test with Welsh’s correction; *p > 0.05, **p > 0.01. Bars represent mean; error bars represent SEM. See also Figure S2.
Figure 3.
Figure 3.. miR-155 is necessary for an effective CD8+ T cell-mediated anti-PD-1 response to CRC.
(A and B) Tumor growth kinetics (A) and mass (B) of WT or miR-155 TKO mice challenged with MC38 cells and administered ICI or PBS 4, 7, and 10 d.p.i. (red arrows). Data were pooled from two replicate experiments; n = 11–22; robust regression and outlier removal (ROUT) outlier test (Q = 1%). (C–P) Representative frequency and number of CD8+ T cells/g of tumor (C and D) and intratumoral frequency of Gzmb+ (E and G), IFNγ+ (F and H), PD-1+ (I and K), Tim-3+ (J and L), Tscm CD44CD62L+ (M and N), CM CD44+CD62L+ (M and O), and eff CD44+CD62L (M and P) CD8+ T cells; n= 7–10. One-way ANOVA with multiple comparisons of means of each group; *p > 0.05, **p > 0.01, ***p > 0.001, ****p > 0.0001. Bars represent mean; error bars represent SEM. See also Figure S3.
Figure 4.
Figure 4.. scRNA-seq of tumor-associated immune cells reveals CD8+ T cell miR-155 regulation of the Tcf-1/Cxcr6 axis.
(A) Uniform manifold approximation and projection analysis of tumor-associated CD45+ cells from WT or miR-155 TKO mice challenged with MC38 cells and administered anti-Pd-1 mAb (+ICI) or PBS on days 7 and 10 post challenge; teal arrow denotes CD8+ T cell cluster. (B) Log2fold change (log2FC) of gene expression in WT vs. miR-155 TKO CD8+ T cell clusters with or without ICI; Wilcoxon rank-sum test with Bonferroni correction. (C–I and M–Q) miR-155+/+ (WT) or miR-155−/− (155-KO) mice challenged with MC38 cells, frequency and number of tumor-associated CD8+ T cells (C–E), and frequencies of intratumoral Tscm CD44CD62L+ (F and G), CM CD44+CD62L+ (F and H), eff CD44+CD62L (F and I), Ccr7+Cx3Cr1 (M and N), Cx3cr1+ (M and O), Tcf1Cxcr6+ (M and P), and Tcf-1+Cxcr6 (M and Q) CD8+ T cells. (J–L, R–U) Frequency of tdLN CD44CD62L+ (naive) (J), CM CD44+CD62L+ (K), eff CD44+CD62L (L), Ccr7+Cx3Cr1 (R), Cx3cr1+ (S), Tcf1Cxcr6+ (T), and Tcf+Cxcr6 (U) CD8+ T cells. t test with Welsh’s correction; *p > 0.05, **p > 0.01, ***p > 0.001, ****p > 0.0001. Bars represent mean; error bars represent SEM; n = 10 per group. See also Figure S4.
Figure 5.
Figure 5.. miR-155 represses Ship-1, indirectly inhibiting Tcf-1 and enhancing anti-tumor immunity.
(A–D, F, and G) From WT or 155-KO mice challenged with MC38 cells, frequency of intratumoral Tcf1+Ship-1+CD8+ T cells (A and B) and CM CD44+CD62L (C), eff CD44+CD62L (D), Ccr7+Cx3cr1 (F), and Cx3cr1+ (G) subsets. (E and H) Histogram and MFI of Ship-1 in Cxcr6+Tcf1Ship-1+ CD8+ T cells; n = 10 per group; t test with Welsh’s correction. (I–M) p-Akt+ cells (I), frequency of p-Akt+Ship-1+, and MFI of p-Akt and Ship-1 in vitro anti-CD3/CD28 activated CD8+ T cells (J) and in Ccr7+Cx3cr1 (K), Cx3cr1+ (L), and Cxcr6+ (M) CD8+ T cell subsets; n = 3 per group; t test with Welsh’s correction. (N and O) Ki-67+ CD8+ T cell frequency from tumor (N) or tdLN (O); n= 8–9 per group from WT or miR-155 TKO challenged with MC38 cells; t test with Welsh’s correction. (P and Q) Tumor growth (P) and mass (Q) in TCRβKO mice challenged with MC38-OVA cells and given 2E5 OT-1-Cas9 (blue), OT1-Cas9-miR-155KO (orange), or OT1-Cas9-miR-155/Ship-1KO (green) CD8+ T cells. One-way ANOVA with multiple comparisons of means of each group; n= 6–7; Grubbs’ outlier test Alpha = 0.01. Frequency of intratumoral CD8+ T cells (R); n= 5–7; Brown-Forsythe and Welch ANOVA test with multiple comparisons of means of each group. Grubbs’ outlier test Alpha = 0.05; *p > 0.05, **p > 0.01, ***p > 0.001, ****p > 0.0001. Bars represent mean; error bars represent SEM. See also Figure S5.
Figure 6.
Figure 6.. SHIP-1 predicts poor patient outcomes in CRC.
(A) Kaplan-Meier’s survival probability of COAD patients from TCGA with top and bottom 30% INPP5D+ patients; n = 150 per group. (B) INPP5D expression within MSI-H, MSI-L, and MSS TCGA COAD patients. t test with pairwise comparisons; *p > 0.05, **p > 0.01. Bars represent mean; error bars represent SE. (C) GSEA of hallmark pathways in top vs. bottom 50% of INPP5D+ patients; the top 10 and bottom 10 pathways are shown. (D and E) Relative expression of INPP5D (SHIP-1)/L32 (D) and hsa-miR-155–5p/L32 (E). t test with Welsh’s correction; *p > 0.05; Bars represent mean; error bars represent SEM; n= 7–11 per group; ROUT outlier test (Q = 2%). (F) Computed Pearson correlation coefficients between relative expression of hsa-miR-155–5p/L32 and INPP5D (Ship-1)/L32 stratified N/M status.
Figure 7.
Figure 7.. miR-155 expression in CD8+ T cells is predictive of Immunoscore and IFNγ responses in COAD and ICI responses in human cancer.
(A) Log2fc miRNA expression in CD8A-high vs. -low COAD patients from TCGA; Wilcoxon rank-sum test with Bonferroni correction. (B) Computed Pearson correlation between CD8A and hsa-miR-155–5p and MLH1. (C) hsa-miR-155–5p expression within MSI-H, MSI-L, and MSS TCGA COAD patients. (D) C1–C6 immune landscapes. t test with pairwise comparisons; ****p > 0.0001. Bars represent mean; error bars represent SE. (E) GSEA of hallmark pathways in top vs. bottom 50% of hsa-miR-155–5p+ patients. The top 10 and bottom 10 pathways are shown. (F) scRNA-seq scaled mean expression and frequency of MIR155HG, IFNG, GZMB, PRF1, and CD8A within tumor-associated cell types. (G) Overlapping significantly upregulated genes between WT vs. miR-155 TKO and WT + ICI vs. miR-155 TKO + ICI in the CD8+ T cell cluster from Figure 4G. (H) Median AUROC curve value of individual gene signatures across 25 patient datasets and 12 cancers; the top and bottom 10 signatures of 48 are shown. See also Figure S6 and S7 and Table S2.

References

    1. Ahnen DJ, Wade SW, Jones WF, Sifri R, Mendoza Silveiras J, Greenamyer J, Guiffre S, Axilbund J, Spiegel A, and You YN (2014). The increasing incidence of young-onset colorectal cancer: a call to action. Mayo Clin. Proc. 89, 216–224. 10.1016/j.mayocp.2013.09.006. - DOI - PubMed
    1. Arnold M, Sierra MS, Laversanne M, Soerjomataram I, Jemal A, and Bray F (2017). Global patterns and trends in colorectal cancer incidence and mortality. Gut 66, 683–691. 10.1136/gutjnl-2015-310912. - DOI - PubMed
    1. Siegel RL, Wagle NS, Cercek A, Smith RA, and Jemal A (2023). Colorectal cancer statistics, 2023. CA A Cancer J. Clin 73, 233–254. 10.3322/caac.21772. - DOI - PubMed
    1. Heinemann V, von Weikersthal LF, Decker T, Kiani A, Vehling-Kaiser U, Al-Batran SE, Heintges T, Lerchenmüller C, Kahl C, Seipelt G, et al. (2014). FOLFIRI plus cetuximab versus FOLFIRI plus bevacizumab as first-line treatment for patients with metastatic colorectal cancer (FIRE-3): a randomised, open-label, phase 3 trial. Lancet Oncol. 15, 1065–1075. 10.1016/S1470-2045(14)70330-4. - DOI - PubMed
    1. Cogdill AP, Andrews MC, and Wargo JA (2017). Hallmarks of response to immune checkpoint blockade. Br. J. Cancer 117, 1–7. 10.1038/bjc.2017.136. - DOI - PMC - PubMed

MeSH terms

Substances