. 2025 Feb 14;11(7):eadu4034.
doi: 10.1126/sciadv.adu4034. Epub 2025 Feb 14.

Fluoxetine promotes IL-10-dependent metabolic defenses to protect from sepsis-induced lethality

Affiliations

Fluoxetine promotes IL-10-dependent metabolic defenses to protect from sepsis-induced lethality

Robert M Gallant et al. Sci Adv. .

Abstract

Selective serotonin reuptake inhibitors (SSRIs) are some of the most prescribed drugs in the world. While they are used for their ability to increase serotonergic signaling in the brain, SSRIs are also known to have a broad range of effects beyond the brain, including immune and metabolic effects. Recent studies have demonstrated that SSRIs are protective in animal models and humans against several infections, including sepsis and COVID-19; however, the mechanisms underlying this protection are largely unknown. Here, we mechanistically link two previously described effects of the SSRI fluoxetine in mediating protection against sepsis. We show that fluoxetine-mediated protection is independent of peripheral serotonin and instead increases levels of circulating interleukin-10 (IL-10). IL-10 is necessary for protection from sepsis-induced hypertriglyceridemia, preventing cardiac effects including impairment of glucose oxidation, ectopic lipid accumulation, ventricular stretch and possibly cardiac failure. Our work reveals a beneficial "off-target" effect of fluoxetine, and reveals a protective immunometabolic defense mechanism with therapeutic potential.


Figures

Fig. 1.
Fig. 1.. Fluoxetine pretreatment protects from sepsis-induced disease and mortality.
(A) Schematic of experimental approach. C57BL/6J mice were treated for 1 week with daily intraperitoneal vehicle or fluoxetine injections then intraperitoneally infected with a 1:1 mixture of E. coli and S. aureus. (B to D) (B) Survival, (C) morbidity, and (D) temperature of vehicle- and fluoxetine-pretreated mice infected with polymicrobial sepsis. n = 10 per condition, one representative experiment shown. For survival, log-rank analysis. For morbidity and temperature, two-way analysis of variance (ANOVA) with Dunnett’s multiple comparisons test. (E to K) Levels of organ damage markers in serum of vehicle- and fluoxetine-pretreated mice infected with polymicrobial sepsis. Infected samples collected 8 to 10 hours post infection. n = 5 to 15 per condition, two to three independent experiments combined. (E) Troponin I. (F) Creatine kinase. (G) Brain natriuretic peptide (BNP). (H) Blood urea nitrogen (BUN). (I) Aspartate transaminase (AST). (J) Alanine transaminase (ALT). (K) Alkaline phosphatase (ALP). Two-way ANOVA with Tukey’s multiple comparisons test. (L to M) Liver pathology of vehicle- and fluoxetine-treated mice infected with polymicrobial sepsis. Infected samples collected 10 hours post infection. (L) Liver pathology score is combined necrosis, hemorrhage, and congestion scores from fig. S1 (B to D). (M) Representative images. Arrow shows a microgranuloma/microabscess, which were seen occasionally in mice from all groups and represent an incidental background lesion. Inset of the worst infected vehicle animal shows acute hemorrhage (h) and bacteria (b) in the region surrounding the gall bladder, compared to the worst fluoxetine-infected animal showing no hemorrhage or bacteria. n = 5 per condition, one independent experiment shown. There is mild microvesicular cytoplasmic vacuolation in the fluoxetine-treated mice. Two-way ANOVA with Tukey’s multiple comparisons test. In all panels, data represent means ± SEM. *P < 0.05, **P < 0.01, ***P < 0.001, and ****P < 0.0001.
Fig. 2.
Fig. 2.. Fluoxetine pretreatment promotes both pathogen resistance and host-pathogen cooperation.
(A) Total pathogen burden analysis from vehicle- or fluoxetine-pretreated mice at 8 to 10 hours post infection. n = 15 per condition, three independent experiments combined. Data represent geometric means ± geometric SD. Unpaired t tests. (B) Hypothetical reaction norms showing no difference in host-pathogen cooperation (left) and differences in cooperation (right) curves. (C to G) Reaction norm analyses plotting body temperature at the time of dissection against total CFUs for mice in (A). (C) Liver. (D) Spleen. (E) Kidney. (F) Heart. (G) Lung. Semilog linear regression, y-intercept constrained to average of uninfected temperature, Extra sum-of-squares F test to compare slopes. Three independent experiments combined. (H) Survival of vehicle- or fluoxetine-pretreated mice that were challenged with a heat-killed 1:1 mixture of S. aureus and E. coli. n = 15 per condition, two independent experiments combined. Log-rank analysis. *P < 0.05 and **P < 0.01. ns, not significant.
Fig. 3.
Fig. 3.. Fluoxetine mediated protection from sepsis is independent of peripheral serotonin.
(A to F) Serotonin (5-HT) levels of wild-type (WT) and Tph1−/− mice at 8 to 10 hours post-infection in vehicle- or fluoxetine-treated mice infected with polymicrobial sepsis. (A) Liver. (B) Spleen. (C) Heart. (D) Lung. (E) Kidney. (F) Serum. n = 6 to 7 per condition, two independent experiments combined. Two-way ANOVA with Dunnett’s multiple comparisons test against WT vehicle. (G to I) (G) Survival, (H) most severe morbidity score exhibited over course of infection by each mouse, and (I) minimum temperature exhibited over course of infection by each mouse of Tph1+/+ or Tph1−/− littermates infected with polymicrobial sepsis. n = 14 to 16 per condition, four independent experiments combined. For survival, log-rank analysis. For morbidity score and temperature, two-way ANOVA with Tukey’s multiple comparisons. (J to L) (J) Survival, (K) most severe morbidity score exhibited over course of infection by each mouse, and (L) minimum temperature exhibited over course of infection by each mouse of Tph1−/− mice treated with vehicle or fluoxetine infected with polymicrobial sepsis. n = 8 to 9 per condition, three independent experiments combined. For survival, log-rank analysis. For morbidity score and temperature, two-way ANOVA with Tukey’s multiple comparisons. In all panels, data represent means ± SEM. *P < 0.05, **P < 0.01, ***P < 0.001, and ****P < 0.0001.
Fig. 4.
Fig. 4.. IL-10 is necessary for fluoxetine-mediated protection from sepsis.
(A to D) Circulating levels of (A) TNFα, (B) IL-6, (C) IL-1β, and (D) IL-10 in vehicle- or fluoxetine-pretreated mice infected with polymicrobial sepsis. n = 5 to 15 per condition, three independent experiments combined. Data represent means ± SEM. Unpaired t tests with Holm-Sidak multiple comparisons correction. (E) Flow cytometry analysis of peritoneal lavage cells 2 hours post-infection from vehicle- or fluoxetine-pretreated mice infected with polymicrobial sepsis. n = 10 per condition, two independent experiments combined. Data represent means ± SEM. Unpaired t tests. (F to H) Circulating levels of (F) TNFα, (G) IL-6, and (H) IL-1β at 10 hours post-infection in WT or Il10−/− mice pretreated with fluoxetine infected with polymicrobial sepsis. n = 5 to 11 per condition, two independent experiments combined. Data represent means ± SEM. Two-way ANOVA with Tukey’s multiple comparisons test. (I to K) (I) Survival, (J) most severe morbidity score exhibited over course of infection by each mouse, and (K) minimum temperature exhibited over course of infection by each mouse of WT or Il10−/− mice treated with vehicle or fluoxetine infected with polymicrobial sepsis. n = 5 to 8 per condition, two independent experiments combined. Data represent means ± SEM. For survival, log-rank analysis. For morbidity and temperature, two-way ANOVA with Tukey’s multiple comparison test. (L) Survival of infected vehicle- and fluoxetine-pretreated mice treated with an α-IL-10R antibody or isotype control. n = 10 mice per condition, two experiments combined. Log-rank analysis. (M) Total pathogen burden analysis at 10 hours post-infection from WT or Il10−/− mice treated with fluoxetine infected with polymicrobial sepsis 10 hours post-infection. n = 8 to 14 per condition, two to three independent experiments combined. Data represent geometric means ± geometric SD. Unpaired t tests. *P < 0.05, **P < 0.01, ***P < 0.001, and ****P < 0.0001.
Fig. 5.
Fig. 5.. Fluoxetine protects from sepsis-induced dyslipidemia.
(A) Serum levels of triglycerides + glycerol at 8 to 10 hours post-infection in vehicle- or fluoxetine-infected mice. n = 5 to 10 per condition, two independent experiments combined. (B) Hepatic triglyceride export in vehicle or fluoxetine infected mice. n = 10 per condition, one independent experiment shown. (C) Hepatic transcript levels of lipid metabolism-related genes at 8 to 10 hours post-infection. n = 5 to 10 per condition, two independent experiments combined. (D and E) Lipid tolerance test (LTT) at 7 hours post-infection n = 8 to 9 per condition, two independent experiments combined. (D) Serum triglyceride levels and (E) area under the curve analysis of (D). One replicate was done in parallel with the LTT performed in Fig. 6 (E and F), and the fluoxetine WT condition was shared between experiments. Therefore, three of the fluoxetine WT mice are also plotted in Fig. 6 (E and F). (F) Hepatic triglyceride levels at 8 hours post-infection. n = 9 to 15 per condition, three independent experiments combined. (G to I) (G) Survival, (H) most severe morbidity score exhibited over course of infection by each mouse, and (I) minimum temperature exhibited over course of infection by each mouse ± Pluronic F-127 injection at the time of infection. n = 10 per condition, two independent experiments combined. (J) Total pathogen burden analysis at 8 to 10 hours post-infection ± Pluronic F-127 injection at the time of infection. n = 10 per condition, two independent experiments combined. Data represent ±SEM or geometric means ± geometric SD for CFU analysis. Unpaired t test, two-way ANOVA with Tukey’s multiple comparisons, or unpaired t tests with Holm-Sidak multiple comparisons correction. *P < 0.05, **P < 0.01, ***P < 0.001, and ****P < 0.0001.
Fig. 6.
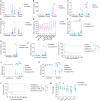
Fig. 6.. IL-10 is necessary for fluoxetine mediated protection from hypertriglyceridemia during sepsis.
(A to C) (A) Peritoneal lavage flow cytometry, (B) circulating IL-10, and (C) hepatic Il10 transcription at 2 hours post-infection in fluoxetine-pretreated mice injected with Pluronic F-127 at the time of infection with polymicrobial sepsis. For (A), n = 15 per condition, two independent experiments combined, unpaired t tests. For (B) and (C), n = 5 to 10 mice per condition, one representative experiment shown, two-way ANOVA with Tukey’s multiple comparisons. (D) Circulating levels of triglycerides at 8 to 10 hours post-infection in fluoxetine-pretreated WT or Il10−/− mice infected with polymicrobial sepsis. n = 10 to 15 per condition, three independent experiments combined. Two-way ANOVA with Tukey’s multiple comparisons. (E and F) LTT at 7 hours post-infection in fluoxetine-treated WT or Il10−/− mice infected with polymicrobial sepsis. n = 8 to 10 mice per condition, two independent experiments combined. One replicate was done in parallel with the LTT performed in Fig. 5 (D and E), and the fluoxetine WT condition was shared between experiments. Therefore, three of the fluoxetine WT mice are also plotted in Fig. 5 (D and E). For LTT, two-way ANOVA with Sidak multiple comparisons between vehicle and fluoxetine at each time point. For area under the curve (AUC), unpaired Student’s t test. In all panels, data represent means ± SEM. *P < 0.05, **P < 0.01. A.U., arbitrary unit.
Fig. 7.
Fig. 7.. IL-10 and protection from hypertriglyceridemia are necessary for fluoxetine to sustain cardiac glucose oxidation during sepsis.
(A and B) U-13C glucose tracing (A) experimental protocol and (B) labeling strategy. (C and D) U-13C glucose labeling of at 7 hours post-infection. (C) Citrate labeling fraction. (D) Pyruvate labeling fraction. n = 7 per condition, one experiment shown. (E) Western blot of pyruvate dehydrogenase (PDH) complex, phospho-PDH, and cyclophilin A of hearts at 8 to 10 hours post-infection. n = 2 to 3 per condition, representative of three independent experiments. (F) Cardiac Pdk4 transcript levels at 10 hours post-infection. n = 5 to 10 per condition, two replicates combined. (G to H) U-13C glucose labeling at 7 hours post-infection of hearts from mice injected with isotype control or anti-IL10R. (G) Citrate labeling fraction. (H) Pyruvate labeling fraction. n = 7 per condition, one experiment shown. (I) Western blot of PDH, phospho-PDH, and cyclophilin A of hearts at 8 to 10 hours post-infection. n = 2 to 3 per condition, representative of two independent experiments. Lower right corner of gel ripped after running. The lower right corner and rest of gel were pieced together for transferring. (J and K) U-13C glucose labeling at 7 hours post-infection in hearts from mice injected with pluronic or water. (J) Citrate labeling fraction. (K) Pyruvate labeling fraction. n = 6 per condition, one experiment shown. (L) Western blot of PDH, phospho-PDH, and cyclophilin A of hearts at 8 to 10 hours post-infection mice injected with water or Pluronic F-127 at the time of infection. n = 2 to 3 per condition, representative of two independent experiments. (M) Circulating BNP levels at 8 to 10 hours post-infection. n = 5 to 15 per condition, three independent experiments combined. (N) Circulating BNP levels at 8 to 10 hours post-infection in mice injected with water or Pluronic. n = 5 to 15 per condition, three independent experiments combined. (O) Model schematic. Two-way ANOVA with Tukey’s multiple comparisons. Uncropped blots are shown in figs. S6 and S7. In all panels, data represent means ± SEM. *P < 0.05, **P < 0.01, ***P < 0.001, and ****P < 0.0001.

References

    1. Schneider D. S., Ayres J. S., Two ways to survive infection: What resistance and tolerance can teach us about treating infectious diseases. Nat. Rev. Immunol. 8, 889–895 (2008). - PMC - PubMed
    1. Ayres J. S., The biology of physiological health. Cell 181, 250–269 (2020). - PMC - PubMed
    1. Cavaillon J., Singer M., Skirecki T., Sepsis therapies: Learning from 30 years of failure of translational research to propose new leads. EMBO Mol. Med. 12, e10128 (2020). - PMC - PubMed
    1. Singer M., Deutschman C. S., Seymour C. W., Shankar-Hari M., Annane D., Bauer M., Bellomo R., Bernard G. R., Chiche J., Coopersmith C. M., Hotchkiss R. S., Levy M. M., Marshall J. C., Martin G. S., Opal S. M., Rubenfeld G. D., van der Poll T., Vincent J., Angus D. C., The Third International Consensus Definitions for Sepsis and Septic Shock (Sepsis-3). JAMA 315, 801–810 (2016). - PMC - PubMed
    1. Fisher C. J., Recombinant human interleukin 1 receptor antagonist in the treatment of patients with sepsis syndrome: Results from a randomized, double-blind, placebo-controlled trial. JAMA 271, 1836–1843 (1994). - PubMed

LinkOut - more resources