. 2025 May 13;9(9):2192-2206.
doi: 10.1182/bloodadvances.2024014905.

In vitro studies of human erythropoiesis using a 3D silk-based bone marrow model that generates erythroblastic islands

Affiliations

In vitro studies of human erythropoiesis using a 3D silk-based bone marrow model that generates erythroblastic islands

Christian A Di Buduo et al. Blood Adv. .

Abstract

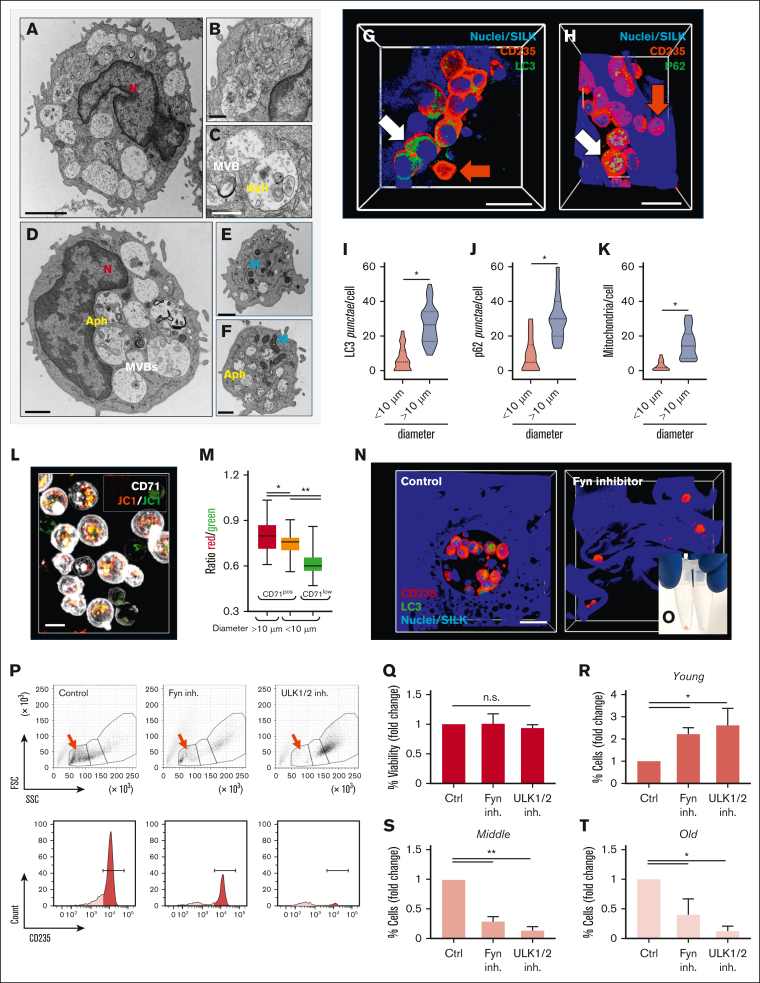
The pursuit of ex vivo erythrocyte generation has led to the development of various culture systems that simulate the bone marrow microenvironment. However, these models often fail to fully replicate the hematopoietic niche's complex dynamics. In our research, we use a comprehensive strategy that emphasizes physiological red blood cell (RBC) differentiation using a minimal cytokine regimen. A key innovation in our approach is the integration of a 3-dimensional (3D) silk-based scaffold engineered to mimic both the physical and chemical properties of human bone marrow. This scaffold facilitates critical macrophage-RBC interactions and incorporates fibronectin functionalization to support the formation of erythroblastic island (EBI)-like niches. We observed diverse stages of erythroblast maturation within these niches, driven by the activation of autophagy, which promotes organelle clearance and membrane remodeling. This process leads to reduced surface integrin expression and significantly enhances RBC enucleation. Using a specialized bioreactor chamber, millions of RBCs can be detached from the EBIs and collected in transfusion bags via dynamic perfusion. Inhibition of autophagy through pharmacological agents or α4 integrin blockade disrupted EBI formation, preventing cells from completing their final morphological transformations, having them trapped in the erythroblast stage. Our findings underscore the importance of the bone marrow niche in maintaining the structural integrity of EBIs and highlight the critical role of autophagy in facilitating organelle clearance during RBC maturation. RNA sequencing analysis further confirmed that these processes are uniquely supported by the 3D silk scaffold, which is essential for enhancing RBC production ex vivo.


Conflict of interest statement

Conflict-of-interest disclosure: The authors declare no competing financial interests.

Figures

None
Graphical abstract
Figure 1.
Figure 1.
Manufacturing of the silk bone marrow model. (A) Schematic representation of erythropoiesis inside the bone marrow, where EBIs originate and give rise to Rtics that finally mature inside the blood vessels. (Bi-ii) E-cadherin and fibronectin immunostaining of a human bone marrow biopsy paraffin section (scale bar, 250 μm) (i-ii); the analysis of sequential sections shows E-cadherin–positive erythroid nest next to CD68+ macrophages, all immersed in a matrix of fibronectin fibrils (scale bar, 25 μm) (iii-iv). (C) Confocal microscopy analysis of mouse bone marrow biopsy (i-ii); cross-section analysis (iii) shows that fibronectin is interspersed within and around the EBI (red, Ter119; green, fibronectin; blue, nuclei; scale bar, 10 μm). (D) Schematic illustration of silk bone marrow model production starting from B. mori cocoons. The scaffold is prepared by dispensing an aqueous silk solution, mixed with salt particles and fibronectin. After leaching out the salt, the resulting porous scaffold can be sterilized and stored at 4°C until use. (E) Silk fibroin constructs mimicking the spongy structure of the bone marrow (scale bar, 5 mm). (F-G) SEM of silk scaffold (scale bar, 300 μm). The pores are highlighted in green. (H) Distribution of pore diameter frequencies. (I) Confocal microscopy analysis of silk-fibronectin scaffold (yellow, fibronectin; gray, silk; scale bar, 100 μm). (J) RBCs from human peripheral blood were perfused inside the scaffold to test the system's efficiency. The spongy model supported the distribution of RBCs throughout the niches of the scaffold (scale bar, 10 μm). (K) Calculation of the Darcy coefficient demonstrated effective hydraulic conductance. (L) Computer-aided design modeling of the perfusion flow chamber. The device includes 3 main inlet ports that provide the diffusion of the medium inside the central core, which is the lodgment for the silk bone marrow scaffold and one outlet port connected to a collection bag. (M) Flow chamber realized with a biocompatible resin (scale bar, 5 mm), housing the silk scaffold. The system can be perfused by a peristaltic pump. A, cross-sectional area; FNC, fibronectin; L, length; p, pressure.
Figure 2.
Figure 2.
Development of EBI-like niches inside the silk bone marrow model. (A) Schematic representation of cell culture workflow. (B) Confocal microscopy analysis of the silk bone marrow model during the culture. The image shows RBCs spontaneously aggregating in cellular nests reminiscent of EBIs (red, CD235a; green, CD71; blue, nuclei; scale bar, 20 μm). (C) Statistical analysis of the percentage of CD71+ and CD235a+ cells into the islets at different days of culture (n = 3; ∗P < .05). (D) Confocal microscopy images showing enucleated RBCs localized at the periphery of the erythropoietic island next to cocultured macrophages (red, CD235a; green, CD68; blue, nuclei/silk; red arrow, enucleated RBC; green arrow, macrophage; scale bar, 10 μm). (Ei-ii) May-Grunwald Giemsa staining of EBI-like niches obtained in the co-culture (scale bar, 5 μm). (E) Hematoxylin and eosin staining (i-ii) of human bone marrow specimen showing the presence of the erythron (scale bar, 25 μm; the white arrows indicate the infiltrating macrophage); SEM (v) of macrophage-RBC coculture inside the scaffold (red arrow, enucleated RBC; green arrow, macrophage; scale bar, 10 μm). (F) Statistical analysis of the volume of the EBIs at different days of culture, as assessed by automated image segmentation analysis (n = 100; P < .01). (G) Gating strategy for flow cytometry analyses based on FSC and SSC settings. The “young” population corresponds to FSChighSSChigh events, the “middle” population corresponds to FSCmidSSCmid events, and the “old” population corresponds to FSClowSCClow events. (H) Percentage of cells analyzed in the different gates. The “old” population is enriched at the end of the culture (n = 15; ∗∗P < .01; ∗P < .05). (I) Analysis of the MFI for CD36, CD71, and CD235a in the “old,” “middle,” and “young” populations (n = 15; ∗P < .05). MFI, mean fluorescence intensity.
Figure 3.
Figure 3.
Transmission electron microscopy reveals changes in cell ultrastructure. (A-B) Transmission electron microscopy images showing proerythroblasts (ProEs) with a high nuclear-to-cytoplasmic ratio and abundant endoplasmic reticulum and mitochondria (scale bar, 2 μm [panel A]; scale bar, 500 nm [panel B]). (C-E) ProEs progressively condense chromatin and loses cytoplasm, thus transforming into basophilic erythroblasts (BasoEs) and polychromatic erythroblasts (PolyEs), with a significant decrease in mitochondria content (scale bar, 2 μm). (F-H) OrthoE appears with pyknotic nuclei, electron-dense chromatin, a reduced nucleus-to-cytoplasm ratio, and few mitochondria. The typical presence of dark granules, identified as glycogen deposits, is visible (scale bar, 1 μm). (I) OrthoE progressively loses all mitochondria and switches to one of the final stages of RBC maturation represented by Rtics, marked by glycogen granules (scale bar, 1 μm). ER, endoplasmic reticulum; Gly, glycogen; M, mitochondria; N, nucleus.
Figure 4.
Figure 4.
Tailored perfusion approach for the collection of ex vivo–produced RBCs. (A) SEM showing the presence of biconcave enucleated RBCs (i-iv), at the periphery of EBIs (white arrows indicate biconcave RBCs; scale bar, 100 μm [panel Ai]; scale bar, 10 μm [panel Avi], scale bar, 20 μm [panel Av]); the bioreactor (v-vi) was connected to gas-permeable tubes to allow the medium to flow inside the silk scaffold. (B) Flow cytometry analysis shows no major differences between ex vivo–cultured RBCs and those obtained from human peripheral blood. (C) Analysis of mean corpuscular hemoglobin (MCH) performed with the Drabkin reagent using RBC from peripheral blood or from the ex vivo 3D culture (p = not significant). (D) Flow cytometry analysis of nuclear staining performed with BioTracker 488. The red histogram corresponds to CD36CD71CD235a+ cells; the pink histogram corresponds to the representative gating of nucleated CD71+CD35+ cells at an early stage of differentiation, which have been used as reference controls. (E) Parallel samples (i) have been imaged by epifluorescence microscopy (red, CD235; green, nuclei; scale bar, 5 μm); peripheral blood RBCs have been used as reference control (ii); SEM analysis (iii-iv) of collected RBCs; cells show morphological features of native RBCs, including the biconcave discoidal shape (scale bar, 2 μm [panel Eiii]; scale bar, 3 μm [panel Eiv]); transmission electron microscopy (v-vii) of collected RBCs. Enucleated cells show few small mitochondria and some residual glycogen deposits (scale bar, 1 μm [panel Ev]; scale bar, 500 nm [panel Evi]; scale bar, 1 μm [panel Evii]). Gly, glycogen; M, mitochondria.
Figure 5.
Figure 5.
Comparative analysis of differential gene expression and pathway enrichment between 2D and 3D cultures at early and late stages of erythrocyte development. (A) Volcano plots illustrating the differential gene expression analysis across different comparisons: early 3D vs early 2D, late 3D vs late 2D, late 2D vs early 2D, and late 3D vs early 3D (total n = 8). Each dot represents a gene, with the red dots indicating significantly upregulated genes (adjusted P value < .05 and |log2FoldChange| >.5) and blue dots indicating significantly downregulated genes based on the same thresholds. Nonsignificant genes are shown in gray. (B) Heat map of hierarchical clustering showing the expression profiles of DEGs across various conditions. Red and blue blocks on the left represent groups of genes that are significantly upregulated or downregulated, respectively, with the color intensity reflecting the expression levels (scaled as z scores). (C) Gene ontology (GO) enrichment analysis for upregulated and downregulated pathways. The dot size represents the ratio of differentially expressed genes to the total genes in each GO term, whereas the color intensity indicates the statistical significance of the enrichment (−log10 P value adjusted). (D) Heat map depicting the average expression levels of selected genes across different conditions. Color intensity represents the scaled expression (z scores) of each gene, with the color bar indicating the scale range. DN, downregulated; L2FC, Xlog2 fold change; UP, upregulated.
Figure 6.
Figure 6.
Autophagic activation during RBC maturation supports the maturation of EBI-like niches. (A-C) Transmission electron microscopy analyses of MVBs and Aphs in basophilic erythroblasts (BasoEs) and polychromatic erythroblasts (PolyEs) (3A scale bar, 2 μm [Figure 3A]; scale bar, 500 nm [Figure 3B]; scale bar, 500 nm [Figure 3C]). (D-F) OrthoE and Rtics also show content of double-membrane vesicles (scale bar, 1 μm [panel D]; scale bar, 1 μm [panel E]; scale bar, 500 nm [panel F]). (G-H) Confocal microscopy images showing CD235a cells positive to LC3B and p62 (red, CD235a; green, LC3B/p62; blue, nuclei per silk; white arrow, double positive cells; red arrow, CD235+ cells; scale bar, 10 μm [Figure 3G]; scale bar, 20 μm [Figure 3H]). Statistical analyses of LC3B+ (I) and p62+ punctae (J) and mitochondria content (K) (n = 100; ∗P < .05). (L) Confocal microscopy analysis showing JC1 staining in CD71low and CD71+ cells (red, JC1 aggregate form; green, JC1 monomeric form; white, CD71; scale bar, 10 μm). (M) Red-to-green ratio analysis shows that depolarization mainly occurs in small CD71low cells (n = 180; ∗P < .05; ∗∗P < .01). (N) Confocal microscopy analyses of the silk bone marrow model during the culture in the presence or not of 10 μM 1-naphthyl PP1 (Fyn inhibitor). Images show cellular nests enriched in CD235a+LC3B+ cells in control conditions, while under treatment with 1-naphthyl PP1 CD235a+LC3B cells are mainly distributed as single cells inside the silk scaffolds (red, CD235a; green, LC3B; blue, silk/nuclei; scale bar, 25 μm). (O) The loss of the typical red appearance of cells from samples treated with Fyn inhibitor demonstrates ineffective iron uptake with respect to controls. (P) As demonstrated by flow cytometry gating, inhibition of autophagy leads to a depletion of cells in the “old” population gate (red arrow) with respect to the control. Analyses show an evident downregulation of CD235a expression of the “old” population treated with Fyn and ULK1/2 inhibitors. (Q) Analysis of cell viability under different treatments (n = 3; p = not significant). Flow cytometry analyses show that (R) the “young” population evidence an increase of the total amount of cells in the presence of inhibitors with respect to the control (n = 3; ∗P < .05). By contrast the (S) “middle” and the (T) “old” populations evidence a reduced cell number in the presence of inhibitors with respect to the control (n = 3; ∗P < .05; ∗∗P < .01). Aph, autophagosome; Ctrl, control; inh., inhibitor; M, mitochondria; N, nucleus; n.s., not significant.
Figure 7.
Figure 7.
Schematic representation of mechanisms of RBC production into the silk bone marrow model. The 3D bone marrow model consists of a silk-based spongy scaffold with interconnected pores, resembling the microcirculation of the native tissue. This design facilitates perfusion into customized flow chambers. The scaffold is functionalized with fibronectin, promoting cell adhesion during maturation. Hematopoietic stem and progenitor cells from human adults, along with macrophages, are cocultured in the presence of erythropoietin and transferrin to establish erythropoietic niches that support RBC differentiation. During maturation, erythroblasts activate autophagy, facilitating cell membrane remodeling and organelle loss. Reduced expression of surface integrins toward the end of maturation enables easy recovery of enucleated RBCs into the medium flow, simulating bloodstream circulation. Samples can be efficiently collected in transfusion bags for downstream analysis. Figure generated with BioRender.com.

References

    1. Di Buduo CA, Aguilar A, Soprano PM, et al. Latest culture techniques: cracking the secrets of bone marrow to mass-produce erythrocytes and platelets ex vivo. Haematologica. 2021;106(4):947–957. - PMC - PubMed
    1. Pellegrin S, Severn CE, Toye AM. Towards manufactured red blood cells for the treatment of inherited anemia. Haematologica. 2021;106(9):2304–2311. - PMC - PubMed
    1. Hu J, Liu J, Xue F, et al. Isolation and functional characterization of human erythroblasts at distinct stages: implications for understanding of normal and disordered erythropoiesis in vivo. Blood. 2013;121(16):3246–3253. - PMC - PubMed
    1. Kweon S, Kim S, Baek EJ. Current status of red blood cell manufacturing in 3D culture and bioreactors. Blood Res. 2023;58(S1):S46–S51. - PMC - PubMed
    1. Bayley R, Ahmed F, Glen K, McCall M, Stacey A, Thomas R. The productivity limit of manufacturing blood cell therapy in scalable stirred bioreactors. J Tissue Eng Regen Med. 2018;12(1):e368–e378. - PMC - PubMed