. 2025 Feb 14;16(1):1641.
doi: 10.1038/s41467-025-56771-4.

Barcoded HIV-1 reveals viral persistence driven by clonal proliferation and distinct epigenetic patterns

Affiliations

Barcoded HIV-1 reveals viral persistence driven by clonal proliferation and distinct epigenetic patterns

Tian-Hao Zhang et al. Nat Commun. .

Abstract

The HIV reservoir consists of infected cells in which the HIV-1 genome persists as provirus despite effective antiretroviral therapy (ART). Studies exploring HIV cure therapies often measure intact proviral DNA levels, time to rebound after ART interruption, or ex vivo stimulation assays of latently infected cells. This study utilizes barcoded HIV to analyze the reservoir in humanized mice. Using bulk PCR and deep sequencing methodologies, we retrieve 890 viral RNA barcodes and 504 proviral barcodes linked to 15,305 integration sites at the single RNA or DNA molecule in vivo. We track viral genetic diversity throughout early infection, ART, and rebound. The proviral reservoir retains genetic diversity despite cellular clonal proliferation and viral seeding by rebounding virus. Non-proliferated cell clones are likely the result of elimination of proviruses associated with transcriptional activation and viremia. Elimination of proviruses associated with viremia is less prominent among proliferated cell clones. Proliferated, but not massively expanded, cell clones contribute to proviral expansion and viremia, suggesting they fuel viral persistence. This approach enables comprehensive assessment of viral levels, lineages, integration sites, clonal proliferation and proviral epigenetic patterns in vivo. These findings highlight complex reservoir dynamics and the role of proliferated cell clones in viral persistence.


Conflict of interest statement

Competing interests: J.A.Z. is on the scientific advisory board for BryoLogx and is a co-founder of CDR3 Therapeutics. The other authors declare no competing interests.

Figures
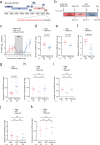
Fig. 1
Fig. 1. Barcoded full-length R5 tropic HIV-1 forms a reservoir and reveals stable genetic diversity of proviral lineages.
a Schematic showing cloning approach of the insertion of a 21 nt genetic barcode tag (red) constrained by a cytosine every third nt inserted downstream of env in a full length R5-tropic HIV-1 isolate NFNSX. b Schematic representation of experiment; early infection of TKO-BLT mice with NFNSX-BC for 6 weeks, ART for 6 weeks, then ART interruption, followed by 6 weeks of monitoring for rebound infection. The red arrows denote when animals were sacrificed during early infection, ART suppression, and rebound infection. c Longitudinal plasma HIV RNA loads of groups of animals that were sacrificed after early infection, ART suppression, or rebound infection. Gray shading indicates an ART treatment period. The black dashed line indicates the detection limit of 2.3 log RNA copies per ml. Median ± interquartile range. d, e Number of viral RNA (vRNA) barcodes (BC) by timepoint. n represents the number of organs (d) or mice (e). f, g Shannon’s diversity (f) and Simpson’s dominance index (g) of vRNA BC by timepoint. n represents the number of organs. h, Number of proviral BC by timepoint. Horizontal bars represent medians. n represents the number of organs (h) or mice (i). j, k Shannon’s diversity (j) and Simpson’s dominance index (k) of proviral BC by timepoint. n represents the number of organs. Horizontal bars represent mean values (dg, j, k). n.s., p > 0.05. P values were calculated using the two-tailed Mann-Whitney test (dk). Source Data ck.
Fig. 2
Fig. 2. Viremia is associated with high viral seeding of the proviral reservoir.
a Schematic depicting viral barcode (BC) seeding is measured by the integration site per barcode (IS per BC). b IS per BC by timepoint. n represents the number of proviral BC. c IS per BC for each provirus associated with (+viremia) or without (-viremia) viremia. n represents the number of proviral BC. d Among the +viremia proviruses, linear regression of log transformed UMI per BC and the number of IS per BC. Coefficient of determination, R2, and associated p value. n = 79. e Among +viremia proviruses, IS per BC during early or rebound infection. n represents the number of proviral BC associated with viremia. b, c, e, Horizontal bars represent mean values. n.s., p > 0.05. P values were calculated using the two-tailed Mann-Whitney test. Source Data be.
Fig. 3
Fig. 3. Cellular clonal proliferation contributes to proviral expansion.
a Schematic depicting proliferation of infected cell lineages measured by UMI per IS. b Contribution of proliferated and non-proliferated cells among all infected cells harboring provirus. c Contribution of proliferated cell clones harboring provirus by timepoint. d Contribution of proliferated and non-proliferated cells among all infected cells harboring provirus. e Cell clone size (UMI per IS) for each proliferated cell clone by timepoint. Horizontal bars represent mean values. n.s., p > 0.05. P value was calculated using the two-tailed Mann-Whitney test. n represents the number of IS. fh Correlation of natural log transformed proviral barcode frequency and UMI per IS per sample for each timepoint among the proviral barcodes in proliferated cell clones during early infection (f), ART suppression (g), or rebound infection (h). Black trendline line calculated by simple linear regression. Spearman’s rank correlation coefficient (r) and associated p values. Early, n = 88; ART, n = 272; Rebound, n = 144. Source Data bh.
Fig. 4
Fig. 4. Viremia is strongly associated with proliferated cell clones of smaller size.
ac Mosaic plots of the number of +viremia and -viremia proviruses associated with proliferated and non-proliferated cell clones during early and rebound infections (a), early infection only (b), or rebound infection only (c). Odds ratio (OR) of detecting proviruses associated with cellular clonal proliferation among proviruses associated with or without viremia. P value was calculated by two-sided Fisher’s exact test. d Among proliferated cell clones, the UMI per IS of cell clones harboring +viremia or -viremia proviruses. n represents the number of IS among proliferated cell clones. P value was calculated using the two-tailed Mann-Whitney test. e Correlation of natural log transformed mean cell clone size (UMI per IS) and viral seeding (IS per BC) among +viremia proviruses in proliferated cell clones during early (left) and rebound (right) infections. Black trendline line calculated by simple linear regression. Spearman’s rank correlation coefficient (r) and associated p values. Early, n = 23; Rebound, n = 27. Source Data Fig. ae.
Fig. 5
Fig. 5. Minor proportion of proviruses associated with cell clonal proliferation were in genes associated with tumorigenesis.
a, b Frequency of IS location in genes related to cancer based on COSMIC data base between all proviruses and the normal distribution of these genes in the human genome (a) or proviruses in proliferated versus non-proliferated cell clones (b). P value was calculated using the two-tailed Mann-Whitney test. c Dot plot representing the integration events that were enriched in genes among proliferated versus non-proliferated cell clones. Odds ratio and p values were calculated by two-sided Fisher’s exact test. Y-axis indicates the p value (-log10). X-axis indicates the chromosome number and position. Red dashed line indicates the threshold for statistical significance after Bonferroni correction of p value of 0.05. d Contribution of integration sites in the listed genes among proliferated cell clones. e Among proliferated cell clones, the cell clone size (UMI per IS) for each integration site. Horizontal bars represent the mean. TNFRSF10D vs all other, p = 0.0044; FOXP4 vs all other, p = 0.0178. WWC1, NBPF12, or TNFRSF10B vs all other, p > 0.05. The adjusted p values were calculated by comparing the UMI per IS for each of the listed gene to the UMI per IS for all other genes by Kruskal-Wallis test. Source Data ae.
Fig. 6
Fig. 6. Proviruses in proliferated cell clones are associated with activating chromatin features.
a Heat map demonstrating the odds ratio of proviruses with the listed epigenetic features. Three different comparisons were made: all proviruses versus randomly generated control (left) and proviruses from proliferated versus non-proliferated cell clones (right). The odds ratios and the p values were calculated using the two-sided Fisher’s exact test. n.s., P > 0.05. b Log10 transformed chromosomal distance (bp) to the nearest histone modification among proviruses from proliferated versus non-proliferated cell clones. n represents the number of proviruses. ce Log10 transformed chromosomal distance (bp) to the nearest transcription start site (TSS) (c), same-direction TSS (d), and ATAC-peak among proviruses (e) among proviruses from proliferated versus non-proliferated cell clones. n represents the total number of proviruses (c, e) or number of same-orientation proviruses (d). Horizontal bars represent mean ± SD. n.s., p > 0.05. P values were calculated using the two-tailed Mann-Whitney test (be). Source Data Fig. ae.
Fig. 7
Fig. 7. Proviruses associated with viremia in proliferated cell clones have activating chromatin features.
a Heat map demonstrating the odds ratio of proviruses with the listed genetic and epigenetic features. Two different comparisons were made: proviruses associated with (+viremia) or without (-viremia) viremia (left), proviruses among proliferated cell clones associated with (+viremia) or without (-viremia) viremia (right). The odds ratios and the p values were calculated using the two-sided Fisher’s exact test. n.s., P > 0.05. b Log10 transformed chromosomal distance (bp) to the nearest histone modification among +viremia or -viremia provirses. n represents the number of proviruses. c Log10 transformed chromosomal distance (bp) to the nearest transcription start site (TSS) (left), same-direction TSS (middle) and ATAC-peak (right) among +viremia versus -viremia proviruses. n represents the total number of proviruses (left, right) or number of same-orientation proviruses (middle). d Log10 transformed chromosomal distance (bp) to the nearest histone modification of +viremia versus -viremia proviruses among proliferated cell clones. n represents the number of proviruses among proliferated cell clones. e Log10 transformed chromosomal distance (bp) to the nearest transcription start site (TSS) (left), same-direction TSS (middle) and ATAC-peak (right) among +viremia versus -viremia proviruses in proliferated cell clones. n represents the number of proviruses among proliferated cell clones. Horizontal bars represent mean ± SD. n.s., p > 0.05. P values were calculated using the two-tailed Mann-Whitney test (be). Source Data ae.

References

    1. Chun, T. W. et al. Presence of an inducible HIV-1 latent reservoir during highly active antiretroviral therapy. Proc Natl Acad Sci USA94, 13193–13197 (1997). - PMC - PubMed
    1. Finzi, D. et al. Identification of a reservoir for HIV-1 in patients on highly active antiretroviral therapy. Science278, 1295–1300 (1997). - PubMed
    1. Bardhi, A. et al. Potent In Vivo NK Cell-Mediated Elimination of HIV-1-Infected Cells Mobilized by a gp120-Bispecific and Hexavalent Broadly Neutralizing Fusion Protein. J. Virol.91, 10.1128/JVI.00937-17 (2017). - PMC - PubMed
    1. Whitney, J. B. et al. Rapid seeding of the viral reservoir prior to SIV viraemia in rhesus monkeys. Nature512, 74–77 (2014). - PMC - PubMed
    1. Gantner, P. et al. HIV rapidly targets a diverse pool of CD4(+) T cells to establish productive and latent infections. Immunity56, 653–668.e655 (2023). - PMC - PubMed