. 2025 Feb 14;16(1):99.
doi: 10.1038/s41419-025-07381-x.

Creatine transporter (SLC6A8) knockout mice exhibit reduced muscle performance, disrupted mitochondrial Ca2+ homeostasis, and severe muscle atrophy

Affiliations

Creatine transporter (SLC6A8) knockout mice exhibit reduced muscle performance, disrupted mitochondrial Ca2+ homeostasis, and severe muscle atrophy

Irene Pertici et al. Cell Death Dis. .

Abstract

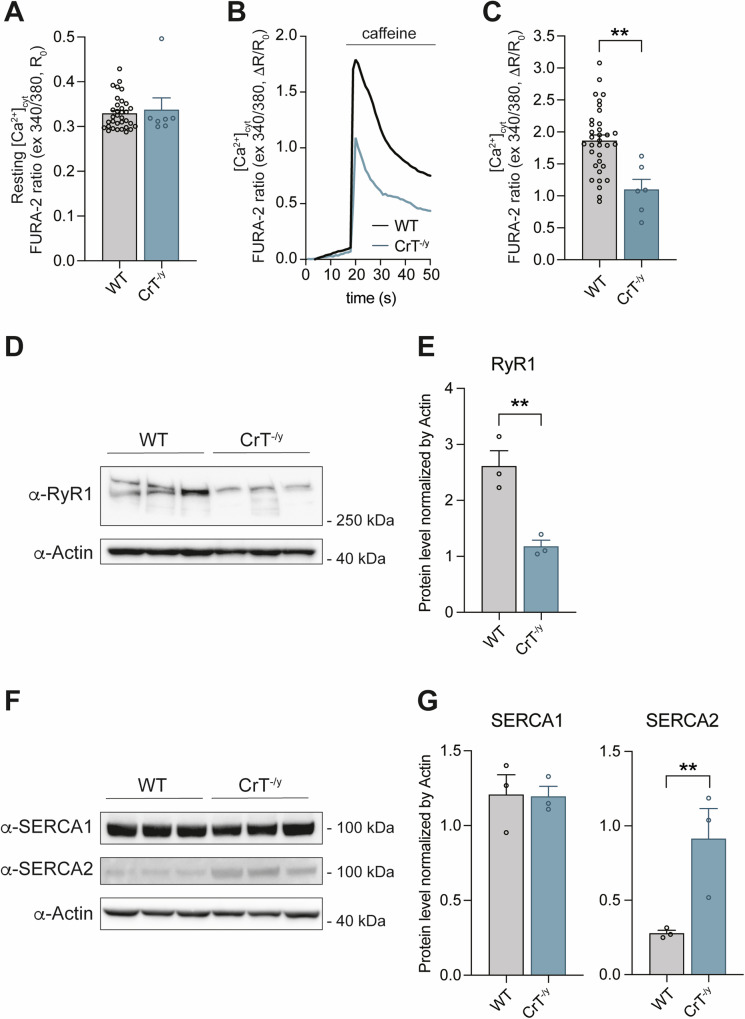
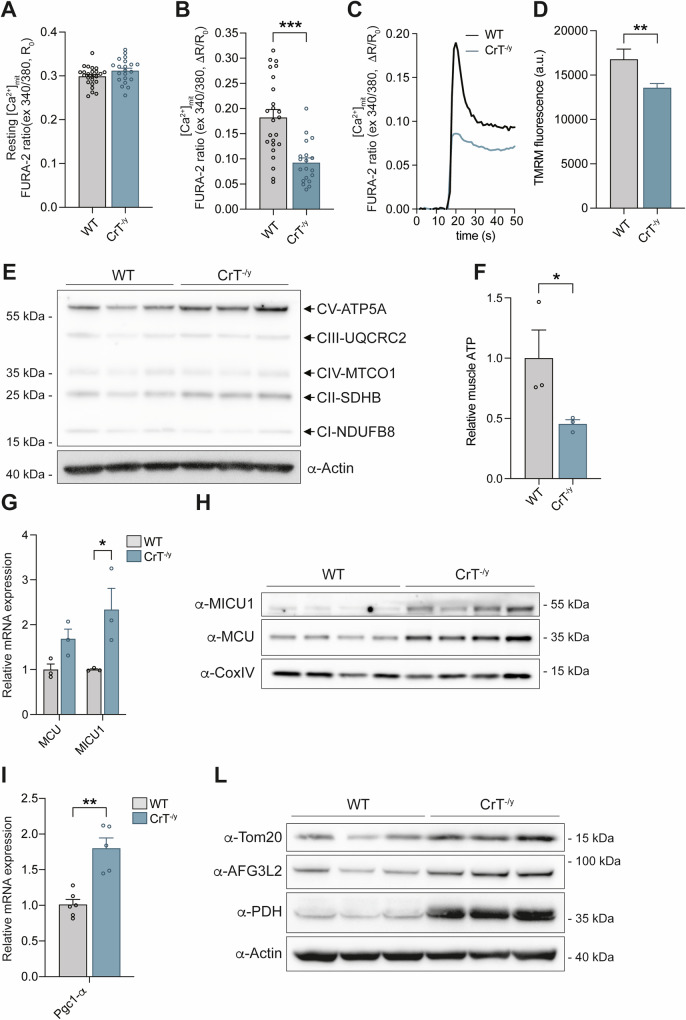
Creatine (Cr) is essential for cellular energy homeostasis, particularly in muscle and brain tissues. Creatine Transporter Deficiency (CTD), an X-linked disorder caused by mutations in the SLC6A8 gene, disrupts Cr transport, leading to intellectual disability, speech delay, autism, epilepsy, and various non-neurological symptoms. In addition to neurological alterations, Creatine Transporter knockout (CrT-/y) mice exhibit severe muscle atrophy and functional impairments. This study provides the first characterization of the skeletal muscle phenotype in CrT-/y mice, revealing profound ultrastructural abnormalities accompanied by reduced fiber cross-sectional area and muscle performance. Notably, mitochondria are involved, as evidenced by disrupted cristae, increased mitochondrial size, impaired Ca2+ uptake, reduced membrane potential and ATP production. Mechanistically, the expression of atrophy-specific E3 ubiquitin ligases and suppression of the IGF1-Akt/PKB pathway, regulated by mitochondrial Ca2+ levels, further support the atrophic phenotype. These findings highlight the profound impact of Cr deficiency on skeletal muscle, emphasizing the need for targeted therapeutic strategies to address both the neurological and peripheral manifestations of CTD. Understanding the underlying mechanisms, particularly mitochondrial dysfunction, could lead to novel interventions for this disorder.


Conflict of interest statement

Competing interests: The authors declare no competing interests. Ethics approval and consent to participate: All animal procedures were performed at the University of Padova and the University of Florence in accordance with the Italian law D. L.vo n.26/2014 and with the Directive 2010/63/EU of the European Parliament on the protection of animals used for scientific purposes. All methods were performed in accordance with the relevant guidelines and regulations.

Figures

Fig. 1
Fig. 1. Quantification of the amount of contractile material in EDL muscle from WT and CrT−/y mice.
A Distribution of the cross-sectional area of the fibers in the EDL muscle of WT and CrT−/y mice. Samples size: 3 EDLs for each group. B Cross-sectional area occupied by the fibers within the muscle in WT and CrT−/y mice. C Representative electron micrographs of cross sections of EDL fibers from WT (left panel) and CrT−/y (right panel) muscles. The intermyofibrillar space and the myofibrillar volume over the fiber volume are reported (D). Scale bar in (C): 1 μm. In (B) and (D), data are presented as mean ± SEM. n = 15. For data analysis, parametric Student t-test (two tailed, unpaired) was used. *p < 0.05.
Fig. 2
Fig. 2. Grip strength test, force-velocity relation, power output, and myosin heavy chain expression in EDL muscles of WT and CrT−/y mice.
A Grip strength test was performed on postnatal day (PND) 40 and PND90. For data analysis, two-way ANOVA, post hoc Holm-Sidak. Data from n = 12. B Relation between force (T, mN) and shortening velocity (V, L0/s) in WT (black symbol) and CrT−/y (blue symbol) mice. Lines are Hill’s hyperbolic equations fit to the data (same color codes for data). Inset, same relations with force expressed in kPa after correction of the muscle CSA for the myofibrillar density in the muscle (factor α, see Text). C Power-force relations calculated from data (symbols) and their fits (lines) in B. Inset, same relations with force expressed in kPa after correction of CSA for the factor α. D Mechanical parameters during isometric contraction and during isotonic shortening of muscles from WT and CrT−/y mice. T0, maximal isometric force; a/T0*, is a measure of the curvature of the force–velocity relation; Vmax, unloaded shortening velocity; Pmax, maximum power output. T0* is the intercept of the Hill equation on the force-axis. In panel D, data are presented as mean ± SEM. n = 4. E and F MHC isoform identification of the EDL muscle fibers by SDS-PAGE in the area of migration of the myosin heavy chains (~220 kDa). In (E) are shown the projections of the mass density along the vertical axis of the bands in (F) after horizontal integration. G Fractional expression of the MHC 2X and 2B isoforms for the WT and CrT−/y muscles. For data analysis, parametric Student t-test (two-tailed, unpaired) was used. *p < 0.05; **p < 0.01; ***p < 0.001. Temperature 23 °C.
Fig. 3
Fig. 3. Characterization of cytosolic Ca2+ homeostasis in FDB fibers of WT and CrT−/y mice.
WT and CrT−/y myofibers were loaded with cytosolic Fura-2/AM. A Resting cytosolic Ca2+ concentrations; B representative traces of cytosolic Ca2+ concentrations upon caffeine stimulation; C cytosolic Ca2+ concentrations upon caffeine stimulation. Data are presented as mean ± SEM. n > 20. For data analysis, parametric Student t-test (two-tailed, unpaired) was used. ** p < 0.01. D Representative Western blot of WT and CrT−/y TA muscles stained with α-RyR1 antibody. α-Actin was used as loading controls. n = 3. E Quantification of the immunoblots showed in D. The levels of the protein were normalized by actin levels. Data are presented as mean ± SEM. n = 3. For data analysis, parametric Student t-test (two-tailed, unpaired) was used. ** p < 0.01. F Representative Western blot of WT and CrT−/y TA muscles stained with α-SERCA1 and α-SERCA2 antibodies. α-Actin was used as loading controls. n = 3. G Quantification of the immunoblots showed in D. The levels of the protein were normalized by actin levels. Data are presented as mean ± SEM. n = 3. For data analysis, parametric Student t-test (two-tailed, unpaired) was used. **p < 0.01.
Fig. 4
Fig. 4. CrT−/y mitochondria present morphological abnormality.
Representative electron microscopy pictures of EDL muscle fibers in control (A) and CrT−/y mice (B) and (C). Scale bars: 1 μm (insets: 0.1 μm). D Quantitative EM analysis. Data are presented as mean ± SEM. Sample size: 15 fibers from 1 WT mice, 30 fibers from 2 CK-KO mice; 5 micrographs/fiber. For data analysis, parametric Student t-test (two-tailed, unpaired) was used. *p < 0.05.
Fig. 5
Fig. 5. Mitochondrial Ca2+ uptake and membrane potential are decreased in CrT−/y muscles compared to WT and the mRNA and protein expression of crucial components of the MCU complex is elevated.
WT and CrT−/y myofibers were loaded with mitochondrially targeted Fura-2/AM (mitoFura-2/AM). A Resting mitochondrial Ca2+ concentrations are unaltered in CrT−/y myofibers compared to WT. B Ratiometric measurements of mitochondrial Ca2+ uptake upon caffeine treatment in CrT−/y FDB myofibers compared to WT fibers. C Representative traces of the experiment. Data are presented as means ± SEM. n > 20. For data analysis, parametric Student t-test (two-tailed, unpaired) was used. ***p < 0.001. D TMRM fluorescence in FDB fibers of WT and CrT−/y mice. Data are presented as mean ± SEM. n = 20. For data analysis, parametric Student t-test (two-tailed, unpaired) was used. **p < 0.01. E Representative Western blot of the OXPHOS complexes in WT and CrT−/y muscles. n = 3. F Relative skeletal muscle ATP levels in EDL muscles of WT and CrT-/y muscles. n = 3. For data analysis, parametric Student t-test (two-tailed, unpaired) was used. *p < 0.05. G Real-time RT-PCR analyses of WT and CrT−/y muscles with the indicated oligonucleotide primers. Data are presented as mean ± SEM. n = 3. For data analysis, parametric Student t-test (two-tailed, unpaired) was used. *p < 0.05. H Representative Western blot of WT and CrT−/y EDL muscles. α-CoxIV was used as loading control. n = 4. I Real-time RT-PCR analyses of WT and CrT−/y muscles with the indicated oligonucleotide primers. Data are presented as mean ± SEM. n = 5. For data analysis, parametric Student t-test (two-tailed, unpaired) was used. **p < 0.01. L Representative Western blot of WT and CrT−/y TA muscles stained with α-Tom20, α-AFG3L2 and α-PHD antibodies. α-Actin was used as loading controls. n = 3.
Fig. 6
Fig. 6. The lack of CrT induces mitochondriogenesis and specific atrophy programs.
A Representative Western blot of WT and CrT−/y EDL muscles stained with the indicated antibodies. α-CoxIV was used as loading control. n = 3. BD Quantification of the experiment performed as in (A). Data are presented as mean ± SEM. n = 4. For data analysis, parametric Student t-test (two-tailed, unpaired) was used. *p < 0.05. E Real-time RT-PCR analyses of WT and CrT−/y muscles with the indicated oligonucleotide primers. Data are presented as mean ± SEM. n = 5. For data analysis, parametric Student t-test (two-tailed, unpaired) was used. ***p < 0.001.

References

    1. Wallimann T, Wyss M, Brdiczka D, Nicolay K, Eppenberger HM. Intracellular compartmentation, structure and function of creatine kinase isoenzymes in tissues with high and fluctuating energy demands: the ‘phosphocreatine circuit’ for cellular energy homeostasis. Biochem J. 1992;281:21–40. - PMC - PubMed
    1. Ellington WR. Evolution and physiological roles of phosphagen systems. Annu Rev Physiol. 2001;63:289–325. - PubMed
    1. Guimaraes-Ferreira L. Role of the phosphocreatine system on energetic homeostasis in skeletal and cardiac muscles. Einstein. 2014;12:126–31. - PMC - PubMed
    1. Brosnan ME, Edison EE, da Silva R, Brosnan JT. New insights into creatine function and synthesis. Adv Enzyme Regul. 2007;47:252–60. - PubMed
    1. Nash SR, Giros B, Kingsmore SF, Rochelle JM, Suter ST, Gregor P, et al. Cloning, pharmacological characterization, and genomic localization of the human creatine transporter. Recept Channels. 1994;2:165–74. - PubMed

MeSH terms

Supplementary concepts

LinkOut - more resources