. 2025 Feb 14;16(1):1639.
doi: 10.1038/s41467-025-56847-1.

Single-cell analysis identifies Ifi27l2a as a gene regulator of microglial inflammation in the context of aging and stroke in mice

Affiliations

Single-cell analysis identifies Ifi27l2a as a gene regulator of microglial inflammation in the context of aging and stroke in mice

Gab Seok Kim et al. Nat Commun. .

Abstract

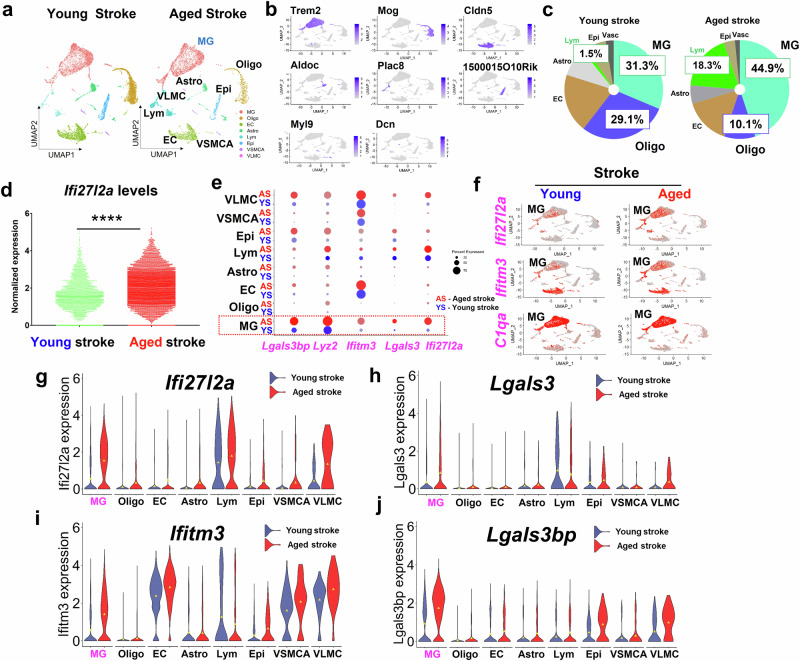
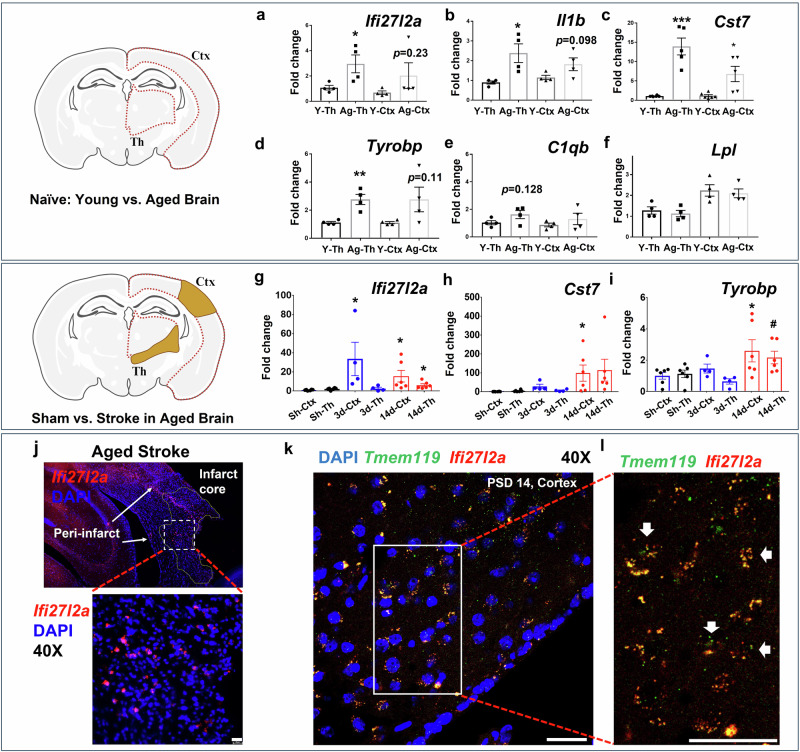
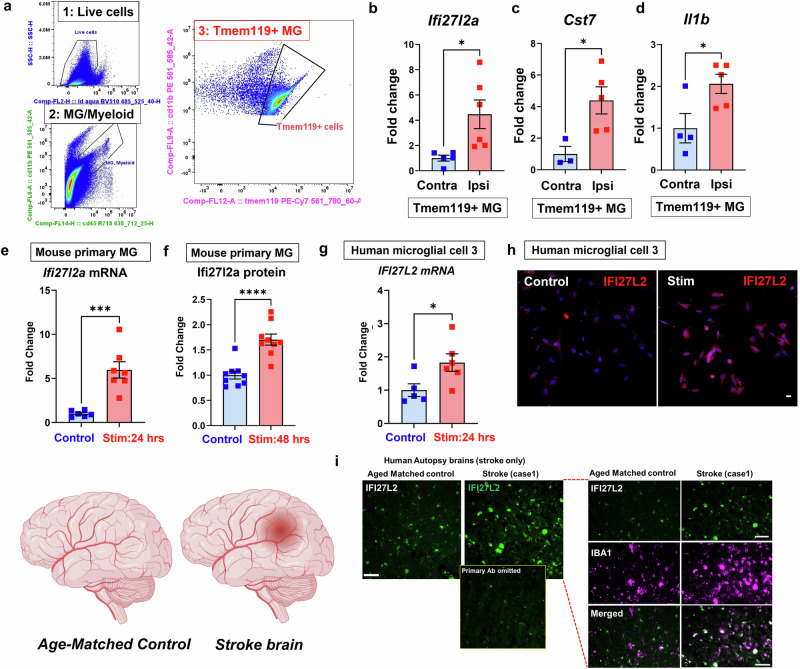
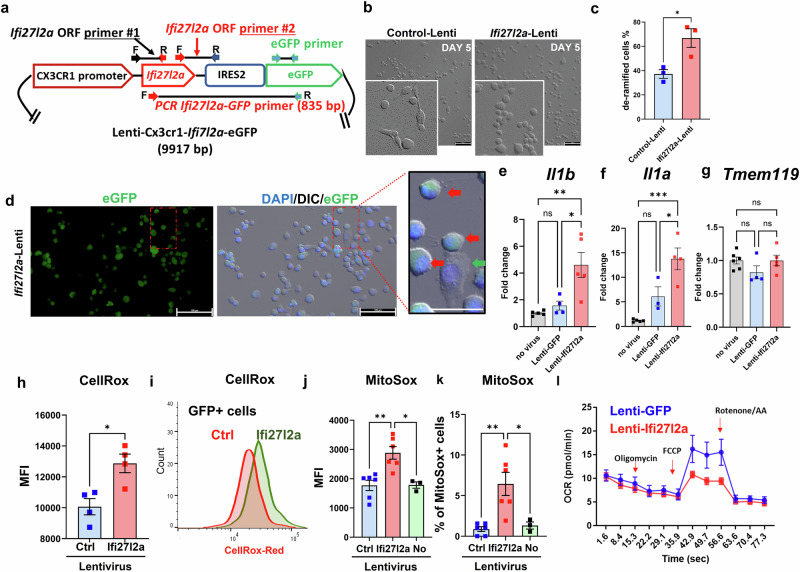
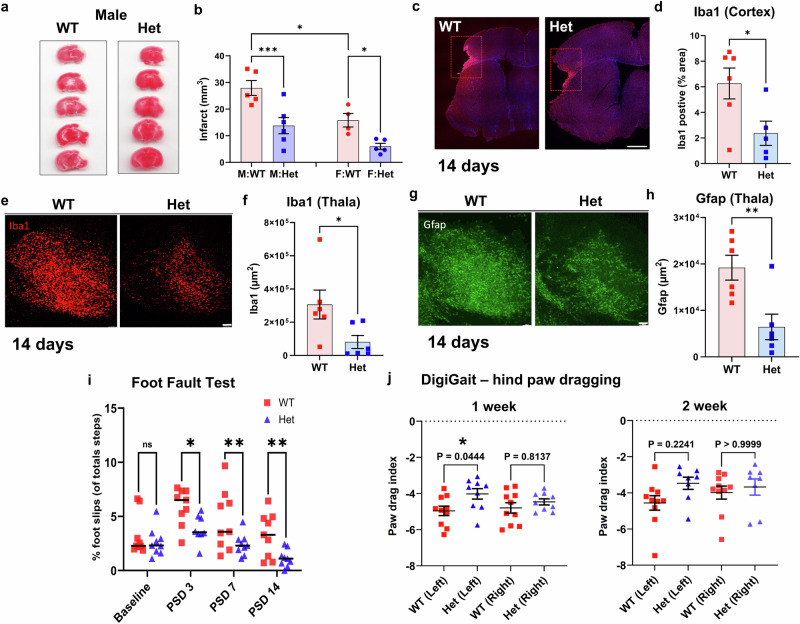
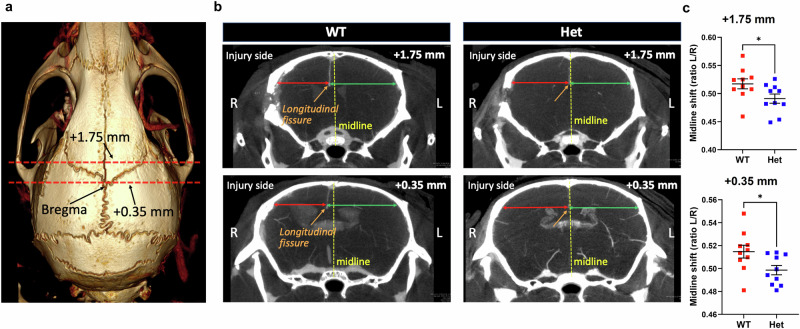
Inflammation is a significant driver of ischemic stroke pathology in the brain. To identify potential regulators of inflammation, we performed single-cell RNA sequencing (scRNA-seq) of young and aged mouse brains following stroke and found that interferon alpha-inducible protein 27 like 2 A (Ifi27l2a) was significantly up-regulated, particularly in microglia of aged brain. Ifi27l2a is induced by interferons for viral host defense and has been linked with pro-inflammatory cellular mechanisms. However, its potential role in neurodegeneration is unknown. Using a combination of cell culture, experimental stroke models in mice, and human autopsy brain samples, we demonstrated that induction of Ifi27l2a occurs in microglia in response to aging, ischemic stroke, and pro-inflammatory molecules. We further showed that induction of Ifi27l2a in microglia was sufficient to stimulate mitochondrial ROS production and promote a pro-inflammatory phenotype. Lastly, using an ischemic stroke model, we demonstrated that hemizygous deletion of Ifi27l2a (Ifi27l2a+/- mice) reduced gliosis (microgliosis and astrogliosis), acute and chronic brain injury, and motor function deficits. Together, these findings identify Ifi27l2a as a critical neuroinflammatory mediator in ischemic stroke and provide support for the therapeutic strategy of disrupting Ifi27l2a to attenuate inflammation in the post-stroke brain.


Conflict of interest statement

Competing interests: The authors declare no competing interests.

Figures

Fig. 1
Fig. 1. scRNA-seq identification of cell clusters and upregulation of Ifi27l2a in young and aged brains after stroke with distinct transcriptional signatures.
a UMAP plot shows the clusters in young and aged stroke (Seurat FindClusters resolution at 0.019). MG; microglia, Oligo; oligodendrocytes, EC; endothelial cells, Astro; astrocytes, Lym; lymphocytes, Epi; epithelial cells, VSMCA: vascular smooth muscle cells, arterial, VLMC: vascular leptomeningeal cells) b Feature plot verifying clustering assignments by representative cell-specific marker gene expression (Trem2; MG, Plp1; Oligo, Cldn5; EC, Aldoc; Astro, Plac8; Lym, 1500015l10Rik; Epi, Myl9; VSMCA, Dcn; VLMC). c Pie plot showing the percentage of the total for each cluster in young stroke and aged stroke. d Normalized Ifi27l2a expression from total cell population in young stroke (12,723 cells) and aged stroke (7791 cells). The overall expression of Ifi27l2a was greater in aged stroke. ****p < 0.0001, two-tailed unpaired t-test. e Lgals3bp, Lyz2, Ifitm3, Lgals3, and Ifi27l2a were identified as highly expressed genes in aged stroke (red dot, AS: aged stroke), compared to young stroke (blue dot, YS: young stroke). Dot size indicates the percent of cells that express the respective gene in the cluster. f Feature plots showing the distribution of Ifi27l2a, Ifitm3, and C1qa in MG of young and aged stroke brains. Violin plots showed the increased expression of g Ifi27l2a, h Lgals3, i Ifitm3, and j Lgals3bp on cell type-specific in young and aged stroke (showing increased Ifi27l2a expression in MG, Lym, and VLMC clusters in aged stroke samples).
Fig. 2
Fig. 2. Regional increases of Ifi27l2a expression in brain with normal aging and in post-stoke brains.
RNA was isolated from thalamus and cortex of young and aged brains for qRT-PCR analysis of a Ifi27l2a (n = 4 mice per group, *p = 0.041) and other genes associated with MG phenotype: pro-inflammatory genes b Il1b (n = 4 mice per group, *p < 0.020), c Cst7 (n = 5-6 mice per group, ***p = 0.0001, *p = 0.013) and phagocytosis related genes d Tyrobp (n = 4 mice per group, **p = 0.004), e C1qb (n = 4 mice per group), and f Lpl (n = 4 mice per group). Ctx: cortex, Th: thalamus, Y: young, Ag: Aged, Data presented as mean ± SEM. Two-tailed unpaired Student’s t-test. RNA was isolated from the cortex and thalamus of sham control or aged stroked mice at 3 days (3D) and 14 days (2 W) after stroke for qRT-PCR analysis. Summary of fold change in expression for g Ifi27l2a (n = 4-6 mice per group, 3D-ctx vs Sh-ctx; *p = 0.046, 14D-ctx vs Sh-ctx; *p = 0.038, 14D-Th vs Sh-Th; *p = 0.032), h Cst7 (n = 4-6 mice per group, 14D-ctx vs Sh-ctx; *p = 0.046), i Tyrobp (n = 4-6 mice per group, 14D-ctx vs Sh-ctx; *p = 0.056, 14D-Th vs Sh-Th; # p = 0.019). Sh; Sham. Data presented as mean ± SEM, two-tailed unpaired Student’s t-test. RNAscope assay shows regional and MG-specific expression of Ifi27l2a in aged brain after stroke. j A representative stitched image showing Ifi27l2a transcripts (red dots) in the peri-infarct area of aged brain at 2 weeks after stroke. Magnified image shows Ifi27l2a transcript (Red). scale bar: 20 µm. Double RNAscope experiment was performed with both Tmem119 probe (Green) and Ifi27l2a probe (Red) on sections from brains at two weeks post-stroke. k Tmem119 + (Green) microglia exhibit Ifi27l2a signals (Red) in the peri-infarcted area. l Magnified image shows Ifi27l2a transcript (Red) in microglia, identified as Tmem119+ cells (Green). White arrows indicate microglia expressing Ifi27l2a. scale bar: 25 µm, n = 4 mice. Source data are provided as a Source Data file. Created in BioRender.
Fig. 3
Fig. 3. MG represent the primary source of Ifi27l2a upregulation following stroke.
a Tmem119+ microglia express Ifi27l2a in the aged brain following stroke (PSD 14). A gating strategy was employed to sort Tmem119+ microglia (MG), utilizing Tmem119 FMO to exclude the Tmem119- population. b Levels of Ifi27l2a (n = 5-6 biological replicates, *p = 0.027, Data presented as mean ± SEM, two-tailed unpaired t test with Welch’s correction, c Cst7 (n = 3-5 biological replicates, *p = 0.014, Data presented as mean ± SEM, two-tailed unpaired t test with Welch’s correction), and d Il1b (n = 4-5 biological replicates, *p = 0.048, Data presented as mean ± SEM, two-tailed unpaired t test with Welch’s correction) were measured by qRT-PCR. Upregulation of Ifi27l2a/IFI27L2 in stimulated primary MG, human MG and diseased human brain. Mouse primary MG were treated with TNFα (20 ng/ml) and IFNγ for 24 hours and 48 hours. e Ifi27l2a mRNA were increased in stimulated MG for 24 hrs (n = 6-7 from three independent experiments, ***p = 0.0005, two-tailed unpaired Student’s t-test. f Intracellular Ifi27l2a protein was induced by proinflammatory cytokine treatment for 48 hrs (n = 8-10 wells, ****p < 0.0001, two-tailed unpaired Student’s t-test). g HMC3 were treated with TNFα (20 ng/ml) and IFNγ (20 ng/ml) plus OGD (Stim). Induction of IFI27L2 mRNA in stimulated HMC3 cells were assessed by qRT-PCR (n = 5-6 from three independent experiments, *p = 0.036, two-tailed unpaired Student’s t-test.). Source data are provided as a Source Data file. h Representative images show expression of IFI27L2 in stressed human HMC. scale bar: 20 µm. i Human IFI27L2 protein expression in age-matched control and stroke human brain tissue collected from patients with no or mild neuropathology. IFI27L2 positive cells were increased in the stroke brain samples (n = 3) compared to age-matched controls (n = 2). scale bar: 75 µm. Red arrows indicate IFI27L2-postive cells. The left panel shows increased IFI27L2-positive cells in stroke human brain samples. The right panel shows IFI27L2 expression in IBA1-positive cells. Created in BioRender.
Fig. 4
Fig. 4. Ifi27l2a is sufficient for microglial activation and ROS generation.
a Lenti-Cx3cr1-Ifi27l2a-eGFP vector map and primer binding regions. b Overexpression of Ifi27l2a by lentivirus changed the morphology at 5 days after infection. scale bar: 100 µm c The % of cells that changed their shapes was significantly increased in Ifi27l2a-lentivirus infected cells, compared to control-lentivirus infected cells (n = 3 biologically independent samples, Data presented as mean ± SEM. *p = 0.025, two-tailed unpaired Student’s t-test). d Representative images show that the cells that express Ifi27l2a (eGFP as an expression surrogate) changed their morphology to round and amoeboid shapes. Red arrows indicate cells that express Ifi27l2a and show a round morphology; Green arrow indicates a cell which does not express Ifi27l2a and remains in the intact morphology. scale bar: 100 µm, 50 µm (zoom-in). Cx3cr1-driven Lenti-eGFP and Lenti-Ifi27l2a were infected into Sim-A9 cells for 2 days. The degree of inflammation was evaluated by qRT-PCR with primers for e Il1b (n = 4-5 biologically independent samples, *p = 0.014, **p = 0.003, ns=non-significant, Data presented as mean ± SEM), f Il1a (n = 3-5 biologically independent samples, *p = 0.022, ***p = 0.0004, Data presented as mean ± SEM), and g Tmem119 (n = 4-6 biologically independent samples, ns=non-significant, Data presented as mean ± SEM, ns=non-significant),1-way ANOVA with Bonferroni’s multiple comparison. h Ifi27l2a overexpression increased the intensity of CellRox dye in all cells (n = 4 biologically independent samples, *p = 0.012, Data presented as mean ± SEM, two-tailed unpaired Student’s t-test). i Ifi27l2a overexpression increased CellRox intensity within GFP expressing cells (n = 4 biologically independent samples). Mitochondrial ROS levels j. MFI, n = 3-6 biologically independent samples, *p = 0.013, **p = 0.003, Data presented as mean ± SEM, k. % of MitoSox+ cells, n = 3-6 biologically independent samples, *p = 0.026, **p = 0.004, Data presented as mean ± SEM) detected by Mitosox was increased in Ifi27l2a lentivirus infected cells, compared to control (*p < 0.05, **p < 0.01, one-way ANOVA with Bonferroni’s multiple comparison test). l Oxygen consumption rate after treatment with oligomycin, FCCP, and rotenone/AA was measured in Sim-9A cells infected with Lenti-eGFP and Lenti-Ifi27l2a (n = 6 biologically independent samples, Data presented as mean ± SD). Source data are provided as a Source Data file.
Fig. 5
Fig. 5. Hemizygous deletion of Ifi27l2a is neuroprotective for ischemic stroke and promotes improved neurobehavioral performance.
a, b Brain infarction at PSD 3 was significantly reduced in Ifi27l2a+/- (Het) compared to WT (M:Male n = 5-6 mice per group, F:Female n = 4-5 mice per group,***p = 0.006, F:WT vs F:Het *p = 0.019, M:WT vs F:WT *p = 0.020, Data presented as mean ± SEM, two-way ANOVA with Tukey’s multiple comparisons test). c, d Ifi27l2a deletion (Het) significantly reduced microgliosis in the peri-infarct cortex at 14 days following stroke (n = 5-6 mice per group, *p = 0.036, scale bar: 1 mm). Deletion of Ifi27l2a (Het) significantly reduced microgliosis e, f n = 6 mice per group, *p = 0.040, two-tailed unpaired Student’s t-test, scale bar: 100 µm) and astrogliosis g, h n = 6 mice per group, **p = 0.007, two-tailed unpaired Student’s t-test, scale bar: 100 µm) in the thalamus at 14 days post-stroke. i Foot fault tests were performed at 0, 3, 7, and 14 days after pdMCAO with WT and Ifi27l2a Het mice (Ifi27l2a+/-), and deficits were examined by counting total foot slips on grids. The data was expressed as a percentage of total foot slips per total number of steps, n = 9 mice per group, PSD 3; *p = 0.012, PSD 7; **p = 0.007, PSD 14; **p = 0.009, ns=non-significant, two-way RM ANOVA with Fisher’s LSD. j DigiGait tests were performed at 7 and 14 days after stroke to examine the sensory-motor deficits following stroke. Left hind paw (affected paw) dragging was sustained at 1 week after stroke in WT mice, but not in Het mice. Right hind paw (unaffected paw) dragging did not change in WT vs Het mice. n = 8-10 mice per group, * p = 0.044, ns=non-significant, Data presented as mean ± SEM, Two-way ANOVA with Tukey’s multiple comparisons test. Source data are provided as a Source Data file.
Fig. 6
Fig. 6. Hemizygous Ifi27l2a deletion (Het mice) reduces brain atrophy at 30 days following stroke.
a MicroCT image of mouse head indicating the location of coronal planes used to measure mid-line shift in stroke brains at 30 days post-stroke. b Coronal microCT images from +1.75 and +0.35 mm from Bregma following ex vivo contrast enhancement by Omnipaque perfusion. c Mid-line shift is calculated as the ratio of the distance from the inside of the skull to the longitudinal fissure (orange arrows) measured from the contralateral (L) and ipsilateral (R) hemispheres. Summary data from both brain locations is plotted as mean ± SEM for the WT and Ifi27l2a+/- (Het) mice. Het mice show reduced mid-line shift, consistent with reduced brain atrophy (n = 10 mice per group, +1.75 mm *p = 0.048, +0.35 mm *p = 0.033, two-tailed unpaired t-test with Welch’s correction). Source data are provided as a Source Data file.

Update of

References

    1. Hammond, T. R. et al. Single-Cell RNA sequencing of microglia throughout the mouse lifespan and in the injured brain reveals complex cell-state changes. Immunity50, 253–271 e256 (2019). - PMC - PubMed
    1. Ochocka, N. et al. Single-cell RNA sequencing reveals functional heterogeneity of glioma-associated brain macrophages. Nat. Commun.12, 1151 (2021). - PMC - PubMed
    1. Linnerbauer, M., Wheeler, M. A. & Quintana, F. J. Astrocyte Crosstalk in CNS Inflammation. Neuron108, 608–622 (2020). - PMC - PubMed
    1. Weinstein, J. R., Koerner, I. P. & Moller, T. Microglia in ischemic brain injury. Future Neurol.5, 227–246 (2010). - PMC - PubMed
    1. Niraula, A., Sheridan, J. F. & Godbout, J. P. Microglia Priming with Aging and Stress. Neuropsychopharmacology42, 318–333 (2017). - PMC - PubMed

MeSH terms

Substances

LinkOut - more resources