. 2025 Feb 14;8(1):237.
doi: 10.1038/s42003-025-07661-4.

DNA methylation differences between cord and adult white blood cells reflect postnatal immune cell maturation

Affiliations

DNA methylation differences between cord and adult white blood cells reflect postnatal immune cell maturation

Meaghan J Jones et al. Commun Biol. .

Abstract

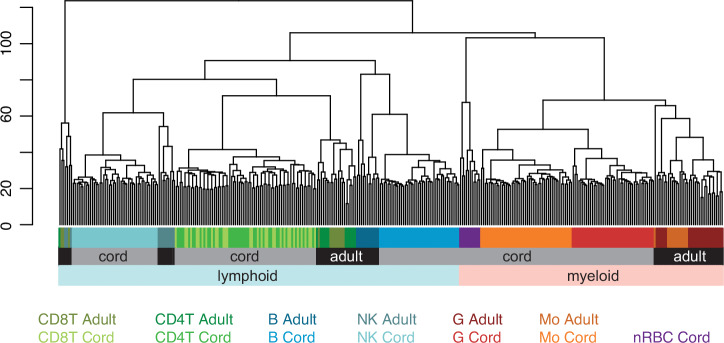
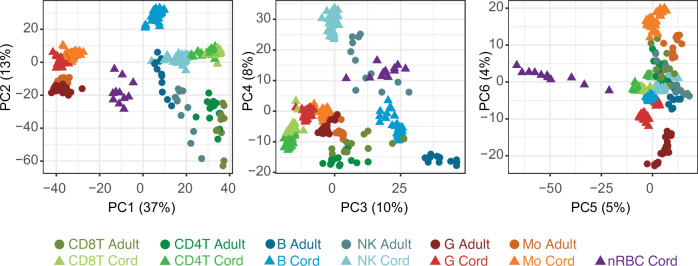
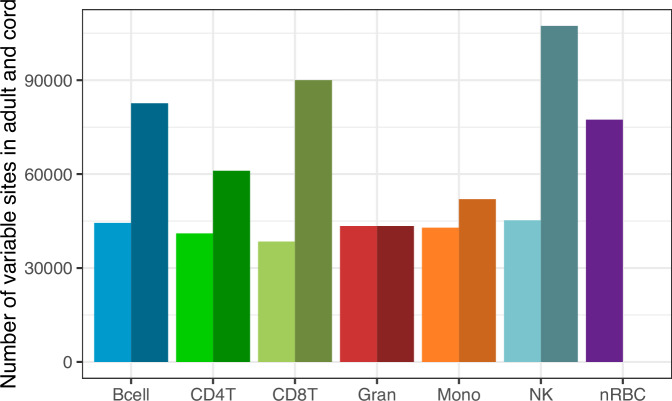
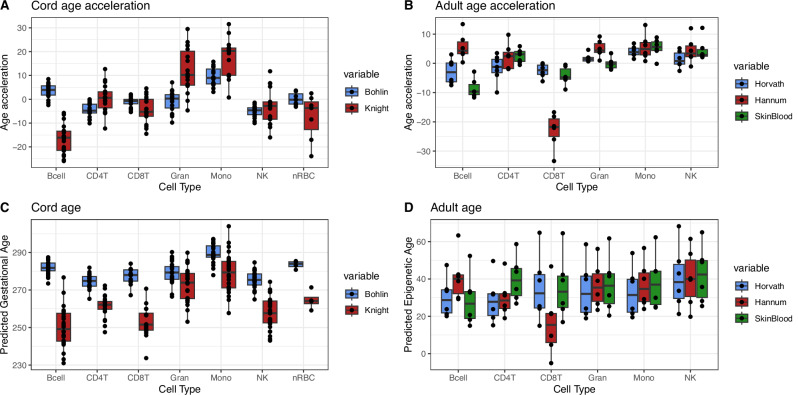
Epigenetic modifications such as DNA methylation are both cell type and developmental age specific. Here, we show that the immunological maturation of blood cell types influences DNA methylation changes from naive cord blood to fully functional adult blood. Lymphoid cells in adult blood showed more variability than in cord blood suggesting an antigen-dependent maturation of DNA methylation in lymphoid cells throughout the lifespan. Fewer DNA methylation changes between cord and adult blood were observed in myeloid cells, particularly in monocytes, which demonstrated the least number of DNA methylation changes between cord and adult blood. We also noted differences in epigenetic ages by immune cell types within the same individuals, specifically in cord blood where monocytes were epigenetically oldest compared to the other cell types. In addition, we provide a publicly available resource to the community as an R Shiny web application to interactively explore epigenetic patterns between naive cord white blood cells and fully functional adult white blood cells for six immune cell types.


Conflict of interest statement

Competing interests: The authors declare no competing interests.

Figures

Fig. 1
Fig. 1. DNA methylation patterns of cord blood cell types were highly distinct from the corresponding cell types in adult blood.
Unsupervised clustering via dendrogram of beta values on 389,901 CpGs from n = 348 samples. Samples clustered first by lineage (pink = myeloid, pale blue = lymphoid), then by age (black = adult, gray = cord), and then by specific cell type (color scale below).
Fig. 2
Fig. 2. Principal components analysis delineated samples based on lineage first, followed by age, and demonstrates differences in variability within cell types.
The first six principal components of the combined cord and adult blood cell type data (n = 348), where circles are adult samples and triangles are cord blood samples, colors as specified on the legend, and percent of variance indicated on the relevant axis.
Fig. 3
Fig. 3. Variable sites within cell types differ between cord blood and adult blood.
Number of sites in each cell type with an SD > 0.05 in the cord (light bars) and adult (darker bars) blood cell types (n = 348). Full lists of variable sites for all cell types are available in Supplementary Data 1–3.
Fig. 4
Fig. 4. DNA methylation differences between cord and adult blood cells by cell type and lineages.
We performed an EWAS comparing cord to adult samples for each cell type, retaining sites with a p value < 9 × 10−8 and a mean DNA methylation difference >10% (visualized in Supplementary Fig. 3). UpSet plot indicating overlaps between significantly differentially methylated CpGs between cord and adult blood in the six cell types, with the number of those which are mQTLs in cord, adult, or both cord and adult indicated using greyscale bars.
Fig. 5
Fig. 5. Cord blood cell types demonstrate differences in epigenetic age which are reduced in adult blood.
Two cord data sets (de Goede and Gervin, A) and one adult data set (Salas, B) had known gestational or chronological ages, respectively, and thus we calculated epigenetic age acceleration in days (cord) or years (adult) for each sample (n = 348). Two cord (Bakulski and Lin, C) and one adult (Reinius, D), did not have chronological ages, but did have matched samples from each participant, and so we compared epigenetic gestational age (cord) or age (adult) across cell types. In boxplots, the center thick line represents the median, the outer box ranges are the 25th and 75th percentiles, and the whiskers represent the farthest value no further than 1.5 times the IQR. Outliers are not displayed as part of boxplot since points are shown.

References

    1. Smith, Z. D. & Meissner, A. DNA methylation: roles in mammalian development. Nat. Rev. Genet.14, 204–220 (2013). - PubMed
    1. Jones, M. J., Goodman, S. J. & Kobor, M. S. DNA methylation and healthy human aging. Aging Cell14, 924–932 (2015). - PMC - PubMed
    1. Reinius, L. E. et al. Differential DNA methylation in purified human blood cells: implications for cell lineage and studies on disease susceptibility. PLoS One7, e41361 (2012). - PMC - PubMed
    1. Ziller, M. J. et al. Charting a dynamic DNA methylation landscape of the human genome. Nature500, 477–481 (2013). - PMC - PubMed
    1. Joubert, B. R. et al. DNA methylation in newborns and maternal smoking in pregnancy: genome-wide consortium meta-analysis. Am. J. Hum. Genet.98, 680–696 (2016). - PMC - PubMed

LinkOut - more resources