. 2025 Jul;9(7):1129-1143.
doi: 10.1038/s41551-025-01350-7. Epub 2025 Feb 14.

Nitroglycerin-responsive gene switch for the on-demand production of therapeutic proteins

Affiliations

Nitroglycerin-responsive gene switch for the on-demand production of therapeutic proteins

Mohamed Mahameed et al. Nat Biomed Eng. 2025 Jul.

Abstract

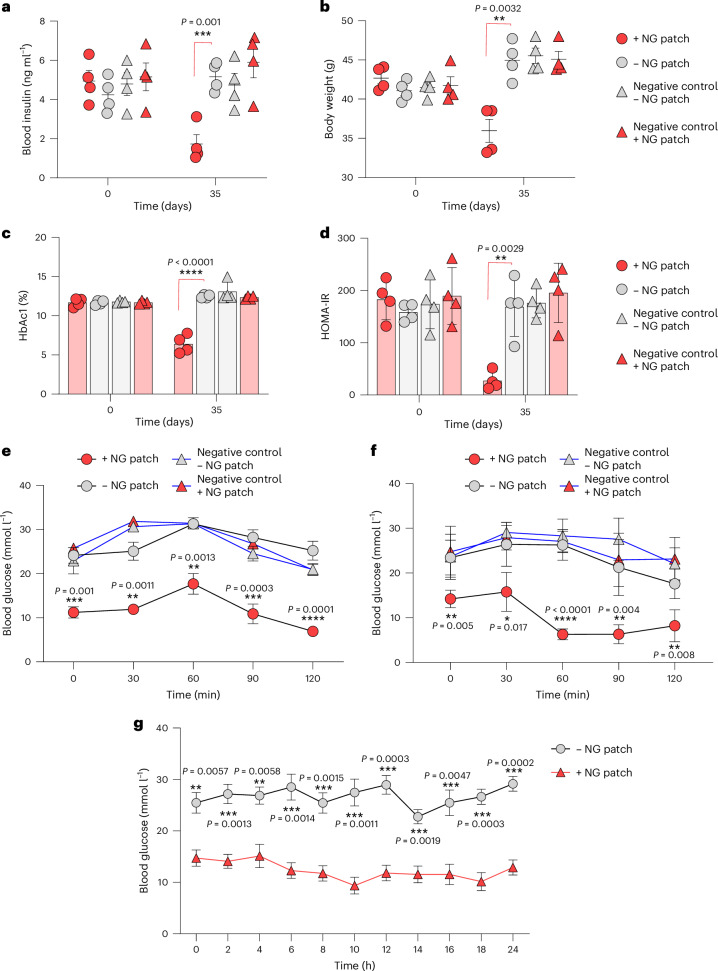
Gene therapies and cell therapies require precise, reversible and patient-friendly control over the production of therapeutic proteins. Here we present a fully human nitric-oxide-responsive gene-regulation system for the on-demand and localized release of therapeutic proteins through clinically licensed nitroglycerin patches. Designed for simplicity and robust human compatibility, the system incorporates human mitochondrial aldehyde dehydrogenase for converting nitroglycerin into nitric oxide, which then activates soluble guanylate cyclase to produce cyclic guanosine monophosphate, followed by protein kinase G to amplify the signal and to trigger target gene expression. In a proof-of-concept study, human cells expressing the nitroglycerin-responsive system were encapsulated and implanted subcutaneously in obese mice with type 2 diabetes. Transdermal nitroglycerin patches applied over the implant enabled the controlled and reversible production of glucagon-like peptide-1 throughout the 35-day experimental period, effectively restoring blood glucose levels in these mice without affecting heart rate or blood pressure. The approach may facilitate the development of safe, convenient and responsive implantable devices for the sustained delivery of biopharmaceuticals for the management of chronic diseases.


Conflict of interest statement

Competing interests: The authors declare no competing interests.

Figures

Fig. 1
Fig. 1. Schematic illustration showing the molecular components and mechanism of action of hNORM in mammalian cells.
Administered NG is enzymatically metabolized inside the cells by ALDH2, leading to the generation of NO. Produced NO molecules activate the sGC αβ heterodimer by binding to the ferrous ion (Fe2+) of the prosthetic haem group. Enzymatically active sGC catalyses the production of the secondary messenger cGMP from the precursor GTP. High levels of cGMP bind to and activate cGMP-dependent PKG1, which subsequently phosphorylates the endogenous transcription factor CREB. PKG1 utilizes adenosine triphosphate (ATP) as a phosphate and energy source, generating adenosine diphosphate (ADP) as a by-product. Following its phosphorylation, CREB binds to a synthetic promoter (PCRE) that contains CRE and initiates the expression of the gene of interest. Source data
Fig. 2
Fig. 2. Engineering of hNORM in mammalian cells.
a, SEAP levels in culture supernatants of HEK-293 cells transfected with pMMH178 (PhPGK-sGCα-pAbGH) and pMMH179 (PhPGK-sGCβ-pAbGH) along with the reporter plasmid pCK53 (PCRE-SEAP-pAbGH). At 24 h following the transfection, the medium was changed to 100 µl of fresh medium containing either DMSO, riociguat (20 µM), DETA NONOate (100 µM) or SNAP (100 µM) for 24 h. Data are presented as mean ± s.d. (n = 3), and P values were calculated using a two-tailed, unpaired Student’s t-test. b, SEAP levels in culture supernatants of HEK-293 cells transfected with the plasmids described in the previous experiment in addition to the co-transfection of PKG1 WT (PhCMV-PKG1β-pAbGH) and/or PKG2 (PhCMV-PKG2-pAbGH). Data are presented as mean ± s.d. (n = 3), and P values were calculated using a two-tailed, unpaired Student’s t-test. c, The performance of hNORM in various mammalian cells. HEK-293, HepG2, HeLa, HDFn, CHO-K1, A549, BHK-21 and HT-1080 cells were co-transfected with pMMH178, pMMH179, PKG1β WT and pCK53. Following the transfection, DETA NONOate (100 µM) was used as an inducer for 24 h as described for the previous experiments. Data are presented as mean ± s.d. (n = 4), and P values were calculated using a two-tailed, unpaired Student’s t-test. All data shown are biological replicates. Source data are provided as a Source Data file. Source data
Fig. 3
Fig. 3. hNORM shows high efficacy and tunability, and can be blocked by methylene blue.
a, Dose dependence of the HEKhNORM1 monoclonal cell line. HEKhNORM1 cells (5 × 104 cells per well) were treated with different concentrations of DETA NONOate, and the NLuc levels (shown as relative luminescence unit (RLU)) in the supernatants were quantified 24 h thereafter. Data are presented as mean ± s.d. (n = 4), and P values were calculated using a two-tailed, unpaired Student’s t-test. b, Intracellular cGMP in HEKhNORM1 described in the previous experiment was quantified by a competitive ELISA. Data are presented as mean ± s.d. (n = 4), and P values were calculated using a two-tailed, unpaired Student’s t-test. c, Induction kinetics in mammalian cells. HEKhNORM1 cells (5 × 104 cells per well) were cultured in medium supplemented with vehicle (sterile water) or DETA NONOate (100 µM). Samples from the supernatants were collected for NLuc quantification every 4 h for 28 h. Data are presented as mean ± s.d. (n = 4), and P values were calculated using a two-tailed, multiple unpaired Student’s t-test. d, Evaluation of reversibility in vitro. HEKhNORM1 cells were cultured at day 0 and DETA NONOate was added at days 1, 3 and 5, while drug wash-out was conducted at days 2, 4 and 6. Samples were taken every day at the same time, just before drug addition and removal. Data are presented as mean ± s.d. (n = 4). e,f, Viability (e) and cytotoxicity (f) assessment of HEKhNORM1 cells treated with DETA NONOate (100 µM) as described in d. Data are presented as mean ± s.d. (n = 4). g, Inhibitory effect of methylene blue on transgene expression. HEKhNORM1 cells were seeded at a density of 5 × 104 cells per well. After 12 h, cells were treated with various concentrations of methylene blue in the presence and absence of DETA NONOate (100 µM). NLuc levels in the supernatants were analysed 24 h thereafter. Data are presented as mean ± s.d. (n = 4), and P values were calculated using a two-tailed, unpaired Student’s t-test. All data shown are biological replicates. Source data are provided as a Source Data file. Source data
Fig. 4
Fig. 4. Mitochondrial ALDH2 increases NO-triggered NLuc release upon induction by topical NG patches.
a, Schematic illustration of the in vivo experiment conducted to examine the performance of engineered cells in mice. b, Alginate–PLL–alginate encapsulated HEKhNORM1 cells (5 × 106 cells in total) were first implanted subcutaneously into C57BL/6 mice (Methods). At 24 h after device implantation, different dosages of NG patches were topically applied above the cell implant. NLuc levels in the blood were measured 24 h following the drug administration. Data are presented as mean ± s.e.m. (n = 5), and P values were calculated using a two-tailed, unpaired Student’s t-test. c, Immunoblotting for ALDH2 of parental HEK-293 WT, HEKhNORM1 and HEKhNORM2. α-Actinin was used as a loading control. d, NLuc levels in blood of mice as described in b using HEKhNORM2 designer cells instead of HEKhNORM1, and an NG-patch dose of 130 µg per 24 h. Data are presented as mean ± s.e.m. (n = 5), and P values were calculated using a two-tailed, unpaired Student’s t-test. e, NO levels in skin tissue of mice following the administration of an NG patch. Encapsulated HEK-293 WT, HEKhNORM1 or HEKhNORM2 cells were subcutaneousinfluencing deep tissues.ly delivered into C57BL/6 mice, and an NG patch (130 µg per 24 h) was applied on top of the implantation site as described in b. NO levels in skin tissue beneath the NG patches were assessed at 8 h intervals. Data are presented as mean ± s.e.m. (n = 4). Statistical significance was analysed by two-way ANOVA and P values were calculated using Tukey’s multi-comparison tests. f, HEKhNORM2-containing microcapsules were implanted either subcutaneously or intraperitoneally into four groups of C57BL/6 mice (5 × 106 cells per mouse). At 2 h following the implantation, NG patches (130 µg per 24 h) were applied to the back and NLuc in the blood was quantified after 24 h. WT mice implanted with parental HEK-293 cells were used as a negative control. Data are presented as mean ± s.e.m. (n = 5), and P values were calculated using a two-tailed, unpaired Student’s t-test. IP, intraperitoneal; SQ, subcutaneous; NS, not significant. g, In vivo evaluation of reversibility using NG patches. HEKhNORM2-containing microcapsules were subcutaneously implanted into mice at day 0 using 5 × 106 cells per mouse. NG patches (130 µg per 24 h) were applied above the implants on days 1, 3 and 5 (for 24 h each time), while on days 2, 4, 6, 7, 8 and 9, mice were kept without an NG patch. Blood samples were taken every day at the same time just before patch application and removal. Data are presented as mean ± s.e.m. (n = 4). All data shown are biological replicates. Source data are provided as a Source Data file. Source data
Fig. 5
Fig. 5. hNORM-regulated GLP-1 secretion effectively reduces glucose levels in type 2 diabetic mice without affecting blood pressure or heart rate.
a, ELISA quantification of active GLP-1 levels in the supernatants of HEKhNORM3 cells following DETA NONOate (100 µM) treatment for 24 h. Data are presented as mean ± s.d. (n = 6), and P values were calculated using a two-tailed, unpaired Student’s t-test. b,c, Long-term performance and anti-glycaemic effect of hNORM in db/db diabetic mice. HEKhNORM3 cell-containing microcapsules (5 × 106 cells per mouse) were subcutaneously implanted into db/db mice at days 0 and 14, and NG patches were topically applied in the vicinity of the implant. NG patches (130 µg per 24 h) were applied once every 2 days starting from day 0 until the end of the experiment. Plasma GLP-1 (b) and fasting glucose (c) levels were analysed every 3 days for 35 days. Data are presented as mean ± s.e.m. (n = 4), and P values were calculated using a two-tailed, unpaired Student’s t-test. d,e, MAP (d) and heart rate (e) of mice described in the previous experiment measured at 7 day intervals. f,g, MAP (f) and heart rate (g) of WT mice harbouring subcutaneous cell implants that contain either HEK-293 WT or HEKhNORM3 cells. NG patches (130 µg per 24 h) were applied at 24 h after the implantation, and cardiovascular parameters were measured at times 0 h and 24 h following the patch application. Data are presented as mean ± s.e.m. (n = 4). Statistical significance was analysed by two-way ANOVA, and P values were calculated using Tukey’s multi-comparison tests. All data shown are biological replicates. Source data are provided as a Source Data file. Source data
Fig. 6
Fig. 6. Long-term hNORM-regulated GLP-1 delivery substantially ameliorates type 2 diabetes mellitus-associated metabolic changes in db/db diabetic mice.
ad, Blood levels of insulin (a), HbAc1 (b), HOMA-IR (c) and body weight (d) of db/db mice treated with hNORM. db/db mice were subcutaneously injected with alginate–PLL–alginate encapsulated parental WT (negative control) or HEKhNORM3 cells (5 × 106 cells per mouse) both at day 0 and day 14 as described in Fig. 4b. The treated groups received NG patches (130 µg per 24 h) once every 2 days for 35 days. Data are presented as mean ± s.e.m. (n = 4), and P values were calculated using multiple, unpaired Student’s t-tests. e,f, Glucose tolerance test (e) and insulin tolerance test (f) of db/db mice (the same mice described previously) after 35 days of hNORM treatment. Data are presented as mean ± s.e.m. (n = 4), and P values were calculated using multiple, unpaired Student’s t-tests. g, Glucose levels of db/db mice after 35 days of hNORM treatment as described above were monitored continuously for 24 h. Data are presented as mean ± s.e.m. (n = 3), and P values were calculated using multiple, unpaired Student’s t-tests. All data shown are biological replicates. Source data are provided as a Source Data file. Source data
Extended Data Fig. 1
Extended Data Fig. 1. Evaluation of SEAP and NLuc reporter sensitivity under hNORM regulation.
HEK-293 cells were co-transfected with pMMH178 (PhPGK-sGCα-pAbGH), pMMH179 (PhPGK-sGCβ-pAbGH), PKG1β WT (PhCMV-PKG1β-pAbGH), along with different amounts of (a) PCRE-driven SEAP reporter pCK53 (PCRE-SEAP-pAbGH) or (b) PCRE-driven NLuc reporter pMMH186 (SBITR-PCRE-NLuc-pAbGH:PhCMV-YPet-P2A-Puro-pAp9-SBITR). At 24 h following the transfection, the medium was changed to 100 µl of fresh medium containing either DMSO or DETA NONOate (100 µM). SEAP and NLuc levels in the supernatants were analyzed at 24 h after drug addition. Data are presented as means ± s.d., n = 4, and p values were calculated using a two-tailed, unpaired Student’s t-test. Source data are provided as a Source Data file. Source data
Extended Data Fig. 2
Extended Data Fig. 2. Expression kinetics of NLuc mRNA as a function of DETA NONOate presence.
HEKhNORM1 cells were treated with DETA NONOate (100 µM) at the beginning of the experiment, and cells were harvested every 4 h. At 24 h, DETA NONOate was removed, and the medium was replaced with fresh medium. Cell samples were taken at the same time intervals until the end of the experiment (40 h). Total RNA was isolated and NLuc levels were quantified by qPCR. Values are shown as NLuc mRNA levels relative to corresponding untreated cells. Data are presented as means ± s.d., n = 3. Source data are provided as a Source Data file. Source data
Extended Data Fig. 3
Extended Data Fig. 3. mRNA quantification of transgenes in HEKhNORM2 and HEKhNORM3 by qPCR.
(a) mRNA levels of sGCα, sGCβ, PKG1, and ALDH2 relative to those in WT non-engineered HEK-293 cells. (b) mRNA levels of sGCα, sGCβ, PKG1, ALDH2, NLuc, and GLP-1 following DETA NONOate (100 µM) treatment for 24 h. Values are shown relative to corresponding untreated cells. Data are presented as means ± s.d., n = 3. Source data are provided as a Source Data file. Source data
Extended Data Fig. 4
Extended Data Fig. 4. GLP-1 secreted via hNORM is pharmacologically active.
The indicated supernatants of parental HEK-293 or HEKhNORM3 cells were harvested after 24 h treatment with DETA NONOate (100 µM) or vehicle (left). The culture supernatants (annotated 1-4) were transferred to active GLP-1 bio-detecting HEK-293 cells (HEKGLP1R), which express GLP-1 receptor (PhCMV-GLP1R-pAbGH3) rewired to PCRE-driven SEAP expression (pCK53, PCRE-SEAP-pAbGH) (middle). Commercial GLP-1 (7-36) was used as a positive control. SEAP measurement was performed 24 h after supernatant transfer or commercial GLP-1 (7-36) treatment (right). Data are presented as means ± s.d. of n = 4 biologically independent samples, and p values were calculated using a two-tailed, unpaired Student’s t-test. Source data are provided as a Source Data file. Source data
Extended Data Fig. 5
Extended Data Fig. 5. Serum levels of hNORM-regulated GLP-1 in response to different dosages of NG transdermal patches.
Alginate-PLL-alginate encapsulated HEKhNORM3 cells (5x10⁶ cells per mouse) were implanted subcutaneously into db/db mice (see methods). At 24 h after device implantation, different dosages of NG patches were topically applied above the cell implant. Active GLP-1 levels in the blood were measured 24 h following the drug administration. Data are presented as means ± SEM, n = 5, and p values were calculated using a two-tailed, unpaired Student’s t-test. Source data are provided as a Source Data file. Source data
Extended Data Fig. 6
Extended Data Fig. 6. Plasma levels of GLP-1 and fasting glucose concentrations in control animals are not affected by NG transdermal patches.
Non-engineered WT HEK-293 cells were subcutaneously implanted in db/db mice as described in Fig. 4b, c. NG patches (130 µg/24 h) were topically applied just above the implant every two days for 35 days. Plasma GLP-1 (a) and fasting glucose (b) levels were analyzed every three days during the 35 days. Data are presented as means ± SEM of n = 4. Source data are provided as a Source Data file. Source data
Extended Data Fig. 7
Extended Data Fig. 7. Continuous monitoring of blood pressure and heart rate of db/db mice following 35 days of hNORM-regulated GLP-1 treatment.
db/db mice were subcutaneously injected with alginate-PLL-alginate encapsulated HEKhNORM3 cells (5x10⁶ cells/mouse) as described in Fig. 5b. The treated groups received NG patches (130 µg/24 h) once every two days for 35 days. Following 35 days of treatment, continuous analysis of blood pressure (a), and heart rate (b) was performed for 24 h. Data are presented as mean ± SEM, n = 3. Statistical significance was analyzed by two-way ANOVA and p values were calculated using Tukey’s multi-comparison tests. Source data are provided as a Source Data file. Source data

References

    1. Wust, R. C. I., Houtkooper, R. H. & Auwerx, J. Confounding factors from inducible systems for spatiotemporal gene expression regulation. J. Cell Biol.219, e202003031 (2020). - PMC - PubMed
    1. Mahameed, M., Xue, S., Stefanov, B. A., Hamri, G. C. & Fussenegger, M. Engineering a rapid insulin release system controlled by oral drug administration. Adv. Sci.9, e2105619 (2022). - PMC - PubMed
    1. Gitzinger, M. et al. The food additive vanillic acid controls transgene expression in mammalian cells and mice. Nucleic Acids Res.40, e37 (2012). - PMC - PubMed
    1. Wang, H., Ye, H., Xie, M., Daoud El-Baba, M. & Fussenegger, M. Cosmetics-triggered percutaneous remote control of transgene expression in mice. Nucleic Acids Res.43, e91 (2015). - PMC - PubMed
    1. Muller, M. et al. Designed cell consortia as fragrance-programmable analog-to-digital converters. Nat. Chem. Biol.13, 309–316 (2017). - PubMed

LinkOut - more resources