. 2025 Feb 14;23(1):185.
doi: 10.1186/s12967-025-06202-1.

ZNRF2 is essential for gliomagenesis through orchestrating glycolysis and acts as a promising therapeutic target in glioma

Affiliations

ZNRF2 is essential for gliomagenesis through orchestrating glycolysis and acts as a promising therapeutic target in glioma

Yunlan Xi et al. J Transl Med. .

Abstract

Background: Improving glioma treatment effectiveness requires a thorough understanding of gliomagenesis. Emerging evidences have proved that zinc and ring finger 2 (ZNRF2) contributes to development of various human malignancies. Nevertheless, a comprehensive study of ZNRF2's role in glioma is absent currently.

Methods: Utilizing open resources from Chinese Glioma Genome Atlas (CGGA), Gene Expression Omnibus (GEO), The Cancer Genome Atlas (TCGA), Connectivity Map (cMap) and other bioinformatic tools, we systematically examined the expression, clinical significance, prognostic value, regulated biological processes, immune infiltration, and potential inhibitors of ZNRF2 in gliomas. Functional experiments were also performed to validate its oncogenic roles in glioblastoma (GBM) cells.

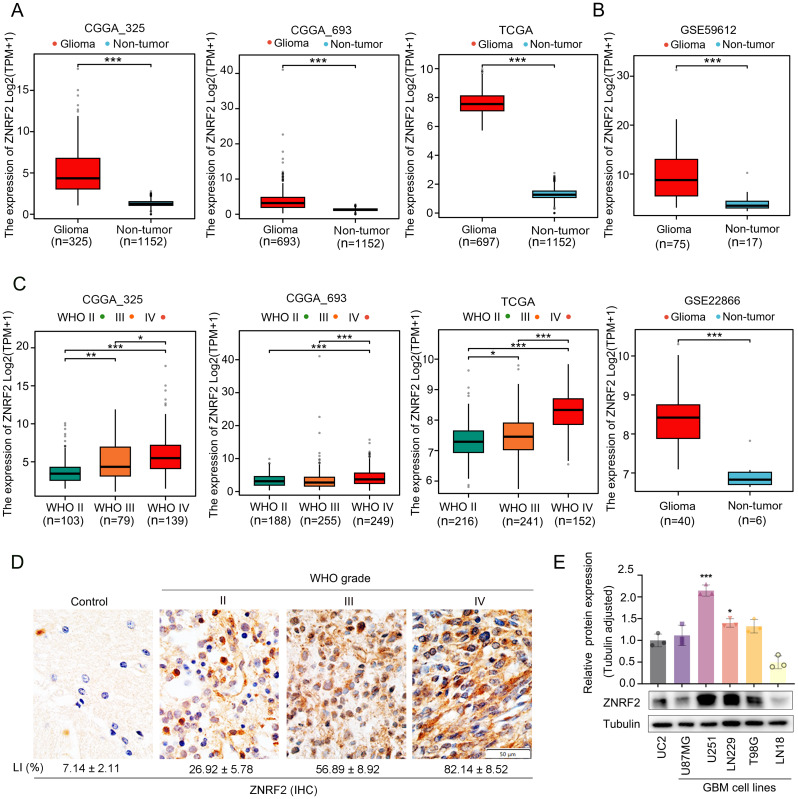
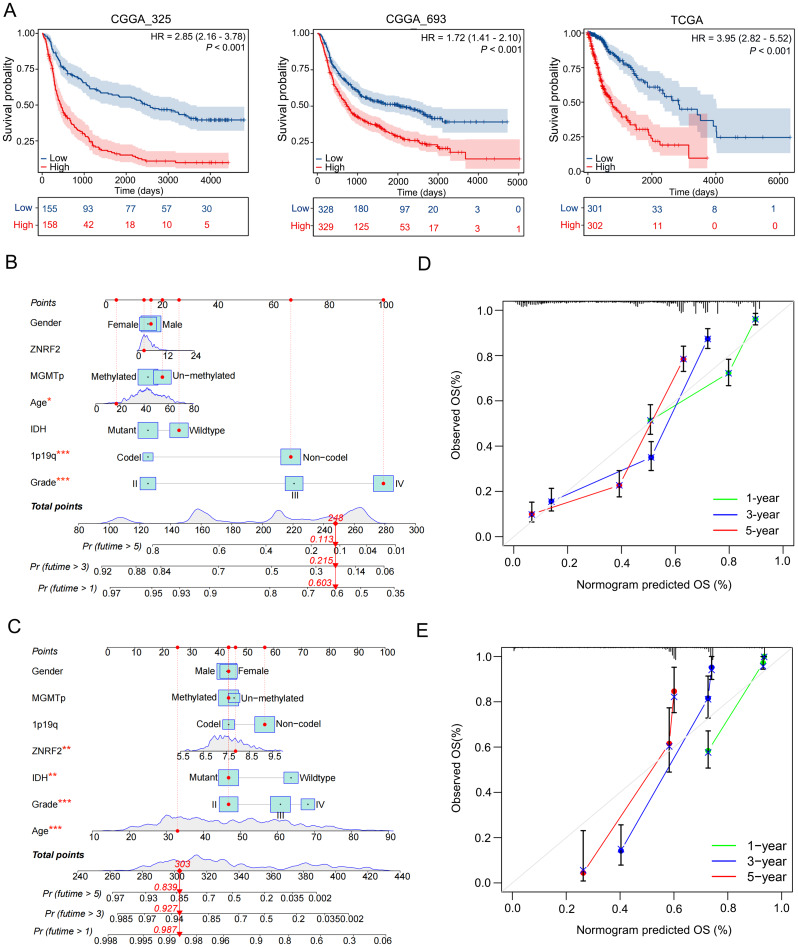
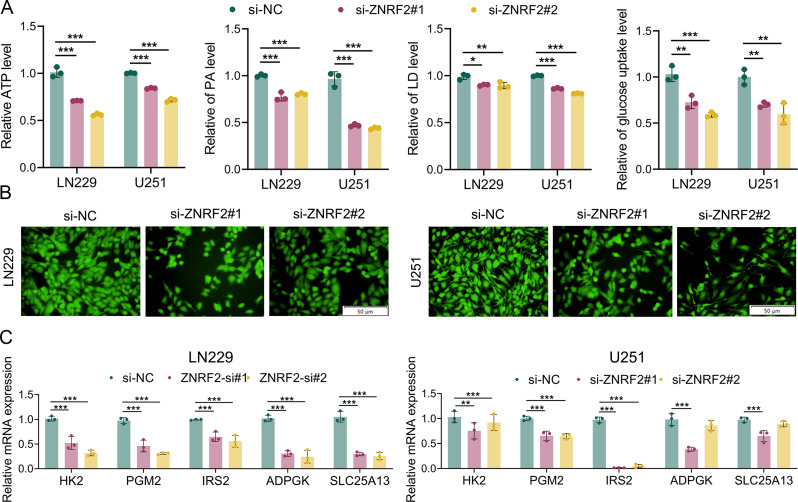
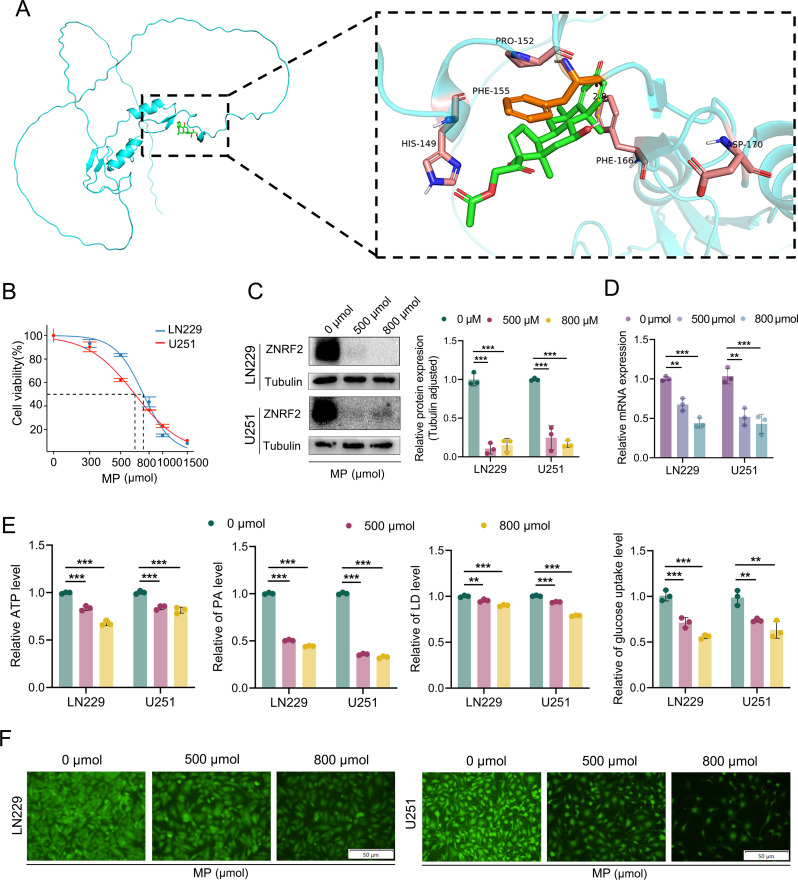
Results: Our findings revealed that ZNRF2 expression was elevated in gliomas compared to normal brains, and its higher levels were correlated with increased grades and worse patient prognosis. The immune analysis suggested that immunotherapies targeting immune checkpoint genes could be beneficial for glioma patients with elevated ZNRF2 expression. Endogenous ZNRF2 knockdown impaired GBM cell proliferation, G2/M cell cycle progression and glycolysis, which was revealed by reduced ATP, pyruvic acid, lactic acid levels and less glucose uptake. Finally, we identified methylprednisolone (MP) as a potential ZNRF2 inhibitor and validated its anti-glioma effects in vitro. MP also enhanced the sensitization of GBM cells to temozolomide (TMZ), the primary chemotherapeutic agent for GBM in clinic.

Conclusions: Taken together, our study demonstrated ZNRF2 as an essential tumor-promoting factor by favoring GBM cell proliferation and glycolysis. Our findings suggested that ZNRF2 might serve as a novel independent prognostic biomarker and promising therapeutic target for glioma patients.

Keywords: Glioma; Glycolysis; Prognosis; Therapeutic target; ZNRF2.


Conflict of interest statement

Declarations. Institutional review board approval: N/A. Informed consent: N/A. Registry and registration number: N/A. Animal studies: N/A. Conflict of interest: The authors declare no competing financial interests.

Figures

Fig. 1
Fig. 1
Expression variation of ZNRF2 between gliomas and normal brain tissues. (A) Comparison of ZNRF2 mRNA expression in gliomas versus non-tumoral brain tissues using data from CGGA_325, CGGA_693, TCGA, and GTEx databases. (B) Comparison of ZNRF2 mRNA expression in gliomas versus non-tumoral brain tissues using data from GSE59612 and GSE22866 datasets. (C) The correlation between ZNRF2 expression and glioma grades (II, III, and IV) was analyzed. Data in (A-C) are presented as box plots. Boxes represent the 25th and 75th percentiles, lines represent the median, whiskers show the minimum and maximum, and points indicate outliers. (D) Representative IHC staining images of ZNRF2 in glioma and normal brain tissues (Scale bar: 50 μm). LI (mean ± SD) of each group was given below. (E) Western blot of ZNRF2 protein expression in GBM cell lines compared to the normal immortal astrocyte cell line UC2 (an immortal astrocyte cell line). Quantification graph (mean ± SD) was plotted. ***P < 0.001 by 2-tailed Student’s t test in (A, B); *P < 0.05, **P < 0.01, ***P < 0.001 by 1-way ANOVA in (C, E)
Fig. 2
Fig. 2
Elevated ZNRF2 expression correlates with poorer glioma prognosis. (A) Kaplan-Meier analyses of OS in glioma patients from the CGGA_325, CGGA_693 and TCGA databases. Glioma patients were divided into high- and low-ZNRF2 expression groups using the medians of ZNRF2 levels of the corresponding cohorts as cutoffs. The P values of the log-rank (Mantel-Cox) tests are presented. (B, C) A nomogram was utilized to predict the OS of glioma patients from the CGGA (B) and TCGA (C) datasets, incorporating ZNRF2 expression, gender, age, IDH status, 1p/19q codeletion, and MGMT promoter methylation levels as parameters. (D, E) Calibration curve of the ZNRF2-based nomogram in the CGGA (D) and TCGA (E) datasets
Fig. 3
Fig. 3
The GO and KEGG pathway enrichment analyses of ZNRF2-related genes. The GO-BP (A-C) and KEGG (D-F) enrichment analyses in gliomas using ZNRF2 co-expressed genes (FDR < 0.05 and|Log2FC|>1) from the CGGA_325 (A, D), CGGA_693 (B, E) and TCGA (C, F) datasets
Fig. 4
Fig. 4
ZNRF2 regulates tumor infiltration of immune cells in TCGA . (A) StromalScores, ImmuneSocres and Estimatescores comparison between high- and low-ZNRF2 expression groups. (B) Percentage abundance of 22 types of TIICs in high- and low-ZNRF2 expression groups. (C) Lollipop graph showing the correlation between TIICs and ZNRF2 expression. (D) Correlation between ZNRF2 and ICP genes. Blue indicated negative correlation while red indicated positive correlation. *P < 0.05, **P < 0.01, ***P < 0.001 by 2-tailed Student’s t test
Fig. 5
Fig. 5
Knockdown of ZNRF2 inhibited GBM cell growth and impaired G2/M cell cycle progression. (A) Knockdown efficiency confirmation by Western blot after transfection of ZNRF2-targeting siRNAs LN229 or U251 cells. Loading control: Tubulin. Cell viability and proliferation potential of LN229 or U251 cells were measured by CCK-8 (B), EdU (C, Scale bar: 50 μm) and colony formation (D) assays. (E) Bioluminescence images of the intracranial glioma xenografts formed by the indicated LN229 cells. Images of representative mice are shown. (F) Representative H&E staining images of tumor volume in nude mice. (G) Western blot of G2/M cell cycle related proteins (Cyclin B1, CDK1) in LN229 or U251 cells after transfection of ZNRF2-targeting siRNAs. Data in (A-D and G) are presented as mean ± SD. *P < 0.05, **P < 0.01, ***P < 0.001 by 1-way ANOVA
Fig. 6
Fig. 6
Correlation between ZNRF2 expression and glycolysis in gliomas. (A) GSEA of the CGGA_693 dataset revealed enrichment of the Glucose Metabolic Process based on ZNRF2 expression. (B) The Venn diagram illustrated the overlap between core enriched genes in the glucose metabolic and glycolysis pathways. (C, D) LASSO Cox regression analysis of 28 overlapping genes identified 9 genes associated with glioma prognosis. (E) Differential expression analysis of 9 glycolytic genes between high- and low-ZNRF2 expression groups. *P < 0.05, ***P < 0.001 by 2-tailed Student’s t test. (F) Correlation between ZNRF2 and the 6 glycolytic genes, include HK2, PGM2, PPARA, ADPGK, IRS2 and SLC25A13. Pearson correlation test, R and P values are shown. (G) Kaplan-Meier analyses of HK2, PGM2, PPARA, ADPGK, IRS2 and SLC25A13 among glioma samples from the CGGA_693 dataset. The P values of the log-rank (Mantel-Cox) tests are presented
Fig. 7
Fig. 7
ZNRF2 promotes the Warburg effect in GBM cells. (A) Determination of ATP, pyruvate (PA), lactic acid (LA) production and glucose uptake in LN229 and U251 cells after transfection of ZNRF2-targeting siRNAs. (B) Fluorescence detection of glucose uptake capacity. Scale bar: 50 μm. (C) qPCR detection of HK2, PGM2, IRS2, ADPGK and SLC25A13 after transfection of ZNRF2-targeting siRNAs. Data in (A, C) are presented as mean ± SD. *P < 0.05, **P < 0.01, ***P < 0.001 by 1-way ANOVA
Fig. 8
Fig. 8
MP inhibits the expression of ZNRF2 and affects glucose metabolic process. (A) MP forms a hydrogen bond with the amino acid residue PHE155, and forms a hydrophobic interaction with the amino acid residues PRO152 and PHE166 on the ZNRF2 protein. (B) Cell viability rates of LN229 and U251 cells treated with increasing concentration gradients of MP. (C) Western blot of ZNRF2 in LN229 and U251 cells under MP treatment at 500 or 800 µM. (D) qPCR detection of ZNRF2 in LN229 and U251 cells as treated in (C). (E) Determination of ATP, pyruvate (PA), lactic acid (LA) production and glucose uptake in LN229 and U251 cells as treated in (C). (F) Fluorescence detection of glucose uptake capacity. Scale bar: 50 μm. Data in (C-E) are presented as mean ± SD. **P < 0.01, ***P < 0.001 by 1-way ANOVA
Fig. 9
Fig. 9
MP sensitized GBM cells to TMZ. (A) Combination matrices of cell inhibition and synergy scores by MP and TMZ. Data represent the mean of 3 independent experiments. (B) Heatmaps of drug combination responses. TMZ and MP at the indicated concentrations were used to treat cells for 48 h, and cell viability was assessed by CCK-8 assay. ZIP Synergy scores were calculated using Synergyfinder software. Scores > 10 were considered strong synergistic. Cell viability (C) and colony formation (D) assays with different therapeutic regimens were performed. (E) ATP, pyruvate (PA), lactic acid (LA) production and glucose uptake were measured in LN229 and U251 cells treated with different concentration drug regiments. (F) Fluorescence detection of glucose uptake capacity. Scale bar: 50 μm. MPS: 800 µmol, TMZ: 200 µmol, MPS + TMZ: MPS (800 µmol) + TMZ (200 µmol). Data in (C-E) are presented as mean ± SD. **P < 0.01, ***P < 0.001 by 1-way ANOVA

References

    1. Zamler DB, Hu J. Primitive oligodendrocyte precursor cells are highly susceptible to Gliomagenic Transformation. Cancer Res. 2023;83(6):807–8. - PubMed
    1. Delgado-Martín B, Medina M. Advances in the knowledge of the Molecular Biology of Glioblastoma and its impact in patient diagnosis, stratification, and treatment. Adv Sci (Weinh). 2020;7(9):1902971. - PMC - PubMed
    1. Kaina B, Beltzig L, Piee-Staffa A, Haas B. Cytotoxic and Senolytic Effects of Methadone in Combination with Temozolomide in Glioblastoma Cells. Int J Mol Sci. 2020; 21(19). - PMC - PubMed
    1. Wang J, Zuo J, Wahafu A, Wang MD, Li RC, Xie WF. Combined elevation of TRIB2 and MAP3K1 indicates poor prognosis and chemoresistance to temozolomide in glioblastoma. CNS Neurosci Ther. 2020;26(3):297–308. - PMC - PubMed
    1. Sang Y, Hou Y, Cheng R, Zheng L, Alvarez AA, Hu B, Cheng SY, Zhang W, Li Y, Feng H. Targeting PDGFRα-activated glioblastoma through specific inhibition of SHP-2-mediated signaling. Neuro Oncol. 2019;21(11):1423–35. - PMC - PubMed

MeSH terms