. 2025 May;100(5):770-784.
doi: 10.1002/ajh.27634. Epub 2025 Feb 15.

Impairment of Innate Immunity and Depletion of Vaccine-Induced Memory B and T Cells in the Absence of the Spleen

Affiliations

Impairment of Innate Immunity and Depletion of Vaccine-Induced Memory B and T Cells in the Absence of the Spleen

Veronica Bordoni et al. Am J Hematol. 2025 May.

Abstract

Splenectomy or congenital asplenia is associated with severe reduction of memory B cells and increased risk of fulminant sepsis by encapsulated bacteria. Current guidelines recommend vaccinations against these pathogens before or after splenectomy, but the longevity of immunity acquired after splenectomy has not been determined. The impact of splenectomy on innate immune cells is unknown. We analyzed frequency, differentiation stage, and function of innate and adaptive immunity in the peripheral blood of adult (n = 41) and pediatric (n = 14) patients splenectomized or born asplenic and in spleens of solid organ donors. The absence of the spleen impacts the B-cell compartment, causing a significant increase of circulating immature transitional and depletion of memory B cells. Using SARS-CoV-2 vaccination as a model, we show that 1 year after the last immunization, despite normal levels of neutralizing antibodies, memory B and T cells were significantly reduced. Analysis of post-pandemic spleens shows that spike-specific memory B and T cells homed to the spleen. We also show a previously unrecognized role of the spleen in the homeostasis of innate NK and Vδ2 T cells. These populations showed altered phenotype and impaired function in the adults, but not in children, suggesting that other tissues may support innate cell development during early life. The reduced function of innate lymphocytes must be considered as an additional immune impairment and risk factor. These findings emphasize the spleen's irreplaceable role in maintaining immune memory across all ages and suggest that its absence contributes to dysfunctions of innate and adaptive immunity in adults.

Keywords: Asplenia; Immune Memory; Innate immunity.


Conflict of interest statement

The authors declare no conflicts of interest.

Figures
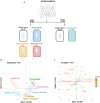
FIGURE 1
FIGURE 1
Principal component analysis of immune markers in asplenic patients. (A) Schematic representation of the enrolled subjects (adult and pediatric cohorts). (B) Principal component analysis (PCA) of key immune markers, measured by flow cytometry, in three groups of asplenic adults (surgery/trauma, congenital, and thalassemia) and in one group of splenectomized children. In addition, adult and pediatric control groups are included (HD). Different groups are distinguished by color, and confidence ellipses are drawn to highlight group distinctions (n = 6). (C) Variable plot showing the direction and magnitude of each vector, representing the contribution of T, B, and innate cell subsets to PC1 and PC2. [Color figure can be viewed at wileyonlinelibrary.com]
FIGURE 2
FIGURE 2
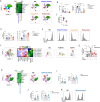
Phenotypic and functional signature of innate immune cells in adult and pediatric asplenic patients. (A) Dimensionality reduction using Uniform Manifold Approximation and Projection (UMAP) to visualize different innate immune cluster sets. Heat map depicts the cluster sets abundances in HD and in the three groups of asplenic adults. UMAP plots for each group are shown. (B) Frequency and function of Vδ2 T cells after phosphoantigen stimulation (defined as % of IFNγ+TNFα+ − producing Vδ2 T cells). Dots represent individual subjects; bars show the median + IQR. (C) Expression of T‐bet in Vδ2 T cells. Results are expressed as median fluorescence intensity (MFI). (D) Graphs show the frequency of total NK cells and CD16dim/neg NK cell subset. Dots represent individual subjects; bars show the median + IQR. (E) Fluorescence of the CD16 in NK cells for HD and in the three groups of asplenic adults. (F) Deep immune profiling of NK cells. UMAP shows the 2D spatial distribution of NK cells derived from the peripheral blood of HD (n = 5) and asplenic patients with thalassemia (n = 5) and derived from the spleen (n = 5). The heat map shows the median marker intensities of the lineage markers across the 6 clusters. Each column identifies the expression of a single marker. UMAP plots for each group are shown. (G) Antibody‐dependent cytotoxicity (ADCC) in HD (n = 7) and in asplenic patients with thalassemia (n = 5). Graphs show the percentage of CD107a + NK cells. Dots represent individual subjects, while bars show the median + IQR. (H) Dimensionality reduction by UMAP visualizes the different innate immune cluster sets originated from pediatric HD and splenectomized children. Heat map depicts the cluster sets abundancy in the two groups. UMAP plots for the two groups are shown. (I) Representative flow cytometry dot plots of the cluster 7 (Vδ2 T cells) in pediatric HD (n = 10) and in splenectomized children (n = 14). Graphs show the frequency and function of Vδ2 T cells after phosphoantigen stimulation (defined as % of IFNγ+TNFα+ − producing Vδ2 T cells). Dots represent individual subjects while bars show the median + IQR. (J) Representative flow cytometry dot plots of cluster 2 (NK CD16dimneg) of pediatric HD and splenectomized children. Graphs show the frequency of NK cell subsets. Dots represent individual subjects while bars show the median + IQR. (K) Histogram showing the intensity of fluorescence of the CD16 among NK cells. Columns represent the median with the interquartile range. Non‐parametric Mann–Whitney t‐test was used to evaluate statistical significance. Two‐tailed p value significances are shown as *p < 0.05, **p < 0.01, ****p < 0.0001. [Color figure can be viewed at wileyonlinelibrary.com]
FIGURE 3
FIGURE 3
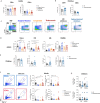
B‐cell phenotype in adult asplenic patients. (A) UMAP visualization of different B‐cell cluster sets. Heat map depicts the cluster sets abundances in HD and in the three groups of asplenic adult patients. UMAP plots for each group are shown. (B, C) Representative dot plots of cluster 2 (transitional B cells CD21low), cluster 4 (IgM), and cluster 8 (switched MBCs) in HD (n = 17) and in the three groups of asplenic adult patients (surgery/trauma, n = 12; congenital, n = 9; thalassemia, n = 21). (D) Manual gating strategy used to identify transitional B cells (CD24highCD38high) and T1 (CD21low) and T2 (CD21pos) among transitional B cells. Graphs show the frequency of the transitional B cells among total B cells and the frequency of T1 and T2 as % of transitional B cells. Dots represent individual subjects, while bars show the median + IQR. (E) Gating strategy used to identify CD71pos activated MBCs and their expression of CD24 and CD27 in the not plasmablasts gate. Activated MBCs are CD24dullCD27pos, while resting MBCs are CD24brightCD27pos. (F) The representative dot plot shows the gating strategy for resting MBCs (in light blue) and activated MBCs (in red). FACS plot also shows the gating strategy to gate IgM (CD27posIgMpos) and switched (CD27posIgMneg) MBCs among CD19+ cells (excluding PBs). (G) Graph shows the frequency of total, resting, activated, IgM, and switched MBCs in the adult cohort. Dots represent individual subjects while bars show the median + IQR. (H) Activated/total MBCs ratio indicating the frequency of activated among total MBCs. Columns represent the median with the interquartile range. Non‐parametric Mann–Whitney t‐test was used to evaluate statistical significance. Two‐tailed p value significances are shown as *p < 0.05, **p < 0.01, ***p < 0.001, ****p < 0.0001. [Color figure can be viewed at wileyonlinelibrary.com]
FIGURE 4
FIGURE 4
SARS‐CoV‐2–specific B‐cell response in asplenic adult and pediatric patients. (A, B) Graphs show anti‐RBD IgG binding (BAU/ml) and neutralizing (MNA90) antibody titers against wild‐type (WT) and BA.5 in the three groups of asplenic patients (surgery/trauma, n = 12; congenital, n = 7; thalassemia, n = 21) compared with HD (n = 12) (A) and in asplenic children (n = 16) compared with HD (n = 13) (B). Dots represent individual subjects while bars show the median + IQR. (C, D) Representative dot plots showing the gating strategy to identify spike‐specific resting (in blue) and activated (in red) MBCs with low (1) and high (2) affinity for WT strain or specific for WT and Omicron strains (3) or only for the Omicron strain (4). Graphs show the frequency of spike‐specific resting and activated MBCs with low and high affinity for WT (C) and specific for WT and Omicron or Omicron only (D) in adult (left panel) and in pediatric (right panel) cohorts. Dots represent individual subjects while bars show the median + IQR. Vaccinated patients and HD are marked with a filled circle for adults and a filled square for children. Non‐parametric Mann–Whitney t‐test was used to evaluate statistical significance. Two‐tailed p value significances are shown as *p < 0.05, **p < 0.01, ***p < 0.001, ****p < 0.0001. [Color figure can be viewed at wileyonlinelibrary.com]
FIGURE 5
FIGURE 5
T‐cell subsets characterization and specific T‐cell immune response to SARS‐CoV‐2 in adults and pediatric asplenic patients. (A, B) CD4+ and CD8+ T‐cell frequencies in the three groups of asplenic adult (surgery/trauma, n = 12; congenital, n = 7; thalassemia, n = 17) (A) and pediatric (n = 14) (B) subjects compared with the relative HD (n = 14 and n = 10, respectively). Dots represent individual subjects while bars show the median + IQR. (C) Representative dot plots of T‐cells differentiation profile in HD and asplenic adults and children. (D, E) Graphs show the frequency of four main differentiated T‐cell subsets [naïve (CD45RA + CCR7+), central memory (CM, CD45RA‐CCR7+), effector memory (EM, CD45RA‐CCR7‐), and terminal effector memory (TEMRA, CD45RA + CCR7‐)] in asplenic adults (surgery/trauma, n = 12; congenital, n = 7; thalassemia, n = 17) (D) and children (n = 14) (E) compared with HD (n = 14 and n = 10, respectively). Dots represent individual subjects while bars show the median + IQR. (F, G) Representative dot plots showing the gating strategy to identify the frequency of IFNγ+TNFα+ producing CD4+ and CD8+ T cells in response to WT and Omicron peptides stimulation in adults (F) and pediatric (G) asplenic patients. Graphs show the frequency of IFNγ+TNFα+ producing CD4+ and CD8+ T cells in adult asplenic subjects (surgery/trauma, n = 12; congenital, n = 7; thalassemia, n = 17 and in splenectomized children, n = 14) compared with HD (n = 14 and n = 10, respectively). Dots represent individual subjects while bars show the median + IQR. Vaccinated adults are marked with filled circle and vaccinated children with filled square. Non‐parametric Mann–Whitney t‐test was used to evaluate statistical significance. Two‐tailed p value significances are shown as *p < 0.05, **p < 0.01, ***p < 0.001, ****p < 0.0001. [Color figure can be viewed at wileyonlinelibrary.com]
FIGURE 6
FIGURE 6
Immune characterization of the spleen. (A–I) B‐cells immunity. (A) Transitional B cells gated in splenic CD19+ cells. (B) Identification of T1 CD21low and T2 CD21pos among splenic transitional B cells. Graph shows the frequency of the latter in the spleen and of total transitional B cells (n = 14). (C) Splenic IgM and switched MBCs among CD19+ cells (excluding PBs). Bar plot indicates their frequency in the spleen (n = 14). (D) Representative contour plot showing the CD21highCD27pos and CD21posCD27pos MBCs and the percentage of switched and IgM MBCs among these populations. (E) Representative dot plot of the distribution of resting (pink) and activated (black) MBCs among the CD21highCD27pos marginal zone (MZ) B cells and the CD21posCD27pos MBCs. Graph shows the frequency of resting and activated MBCs in the spleen (n14). (F, G) Representative dot plots and column scatter graphs of spike‐specific splenic resting and activated MBCs with low (green) and high‐affinity (orange) for the WT strain in spleens collected before 2019 (n = 10) and after (n = 11) 2021. (H) Representative contour plots of the CD21highCD27pos MZ MBCs (black square), the CD21posCD27pos MBCs (purple square), and the naive B cells (CD21posCD27neg, blue square) and the back gating of low (green) and high (orange) affinity total MBCs from SPL1 and SPL2. (I) Column graphs of the percentage of IgG, IgM, and IgA among low and high‐affinity total MBCs in samples of spleen (n = 11) and peripheral blood (n = 19) of HD collected after 2021. Columns represent the median with the interquartile range. Statistical significance was evaluated by 2‐way ANOVA; p values are shown as *p < 0.05, **p < 0.01, ***p < 0.001, ****p < 0.0001. (J–L) Innate immunity. (J) Representative dot plots of splenic Vδ2 T cells. (K) Function of Vδ2 T cells (defined as % of IFNγ+TNFα+‐producing Vδ2 T cells) in the spleen (n = 9) after phosphoantigen stimulation. (L) Representative dot plot to identify splenic NK cells and the frequency of the two main NK cell subsets (CD16bright and CD16dim/neg). (M, N) T‐cell immunity. (M) Representative dot plots of splenic CD4+ and CD8+ T cells. Pie charts showing the proportion of the four main differentiated T‐cell subsets: Naïve, central memory (CM), effector memory (EM), terminal effector memory (TEMRA) in the spleen. (N) Representative dot plot of the spike (WT and Omicron)‐specific CD4 and CD8 T‐cell response. Graphs shows the frequency of IFNγ+TNFα+ producing CD4+ and CD8+ splenic T cells (n = 9) after spike‐specific stimulation. Columns represent the median with the interquartile range. Non‐parametric Wilcoxon matched pair signed‐rank test (continuous line) and Mann–Whitney t‐test (dotted line) were used to evaluate statistical significance. Two‐tailed p value significances are shown as *p < 0.05, ***p < 0.001. [Color figure can be viewed at wileyonlinelibrary.com]

References

    1. Di Sabatino A., Carsetti R., and Corazza G. R., “Post‐Splenectomy and Hyposplenic States,” Lancet 378, no. 9785 (2011): 86–97. - PubMed
    1. cdc , “General Best Practice Guidelines for Immunization,” accessed August 1, 2023, www.cdc.gov/vaccines/hcp/acip‐recs/general‐recs/immunocompetence.htm.
    1. Lee G. M., “Preventing Infections in Children and Adults With Asplenia,” Hematology (United States) 20, no. 1 (2020): 328–335. - PMC - PubMed
    1. Davies J. M., Lewis M. P. N., Wimperis J., Rafi I., Ladhani S., and Bolton‐Maggs P. H. B., “Review of Guidelines for the Prevention and Treatment of Infection in Patients With an Absent or Dysfunctional Spleen: Prepared on Behalf of the British Committee for Standards in Haematology by a Working Party of the Haemato‐Oncology Task Force,” British Journal of Haematology 155, no. 3 (2011): 308–317. - PubMed
    1. Lenti M. V., Luu S., and Carsetti R., “Asplenia and Spleen Hypofunction,” Nature Reviews. Disease Primers 8 (2022): 71. - PubMed

MeSH terms

Substances