. 2025 Feb 25;44(2):115310.
doi: 10.1016/j.celrep.2025.115310. Epub 2025 Feb 13.

Lipid droplet efferocytosis attenuates proinflammatory signaling in macrophages via TREM2- and MS4A7-dependent mechanisms

Affiliations

Lipid droplet efferocytosis attenuates proinflammatory signaling in macrophages via TREM2- and MS4A7-dependent mechanisms

Linkang Zhou et al. Cell Rep. .

Abstract

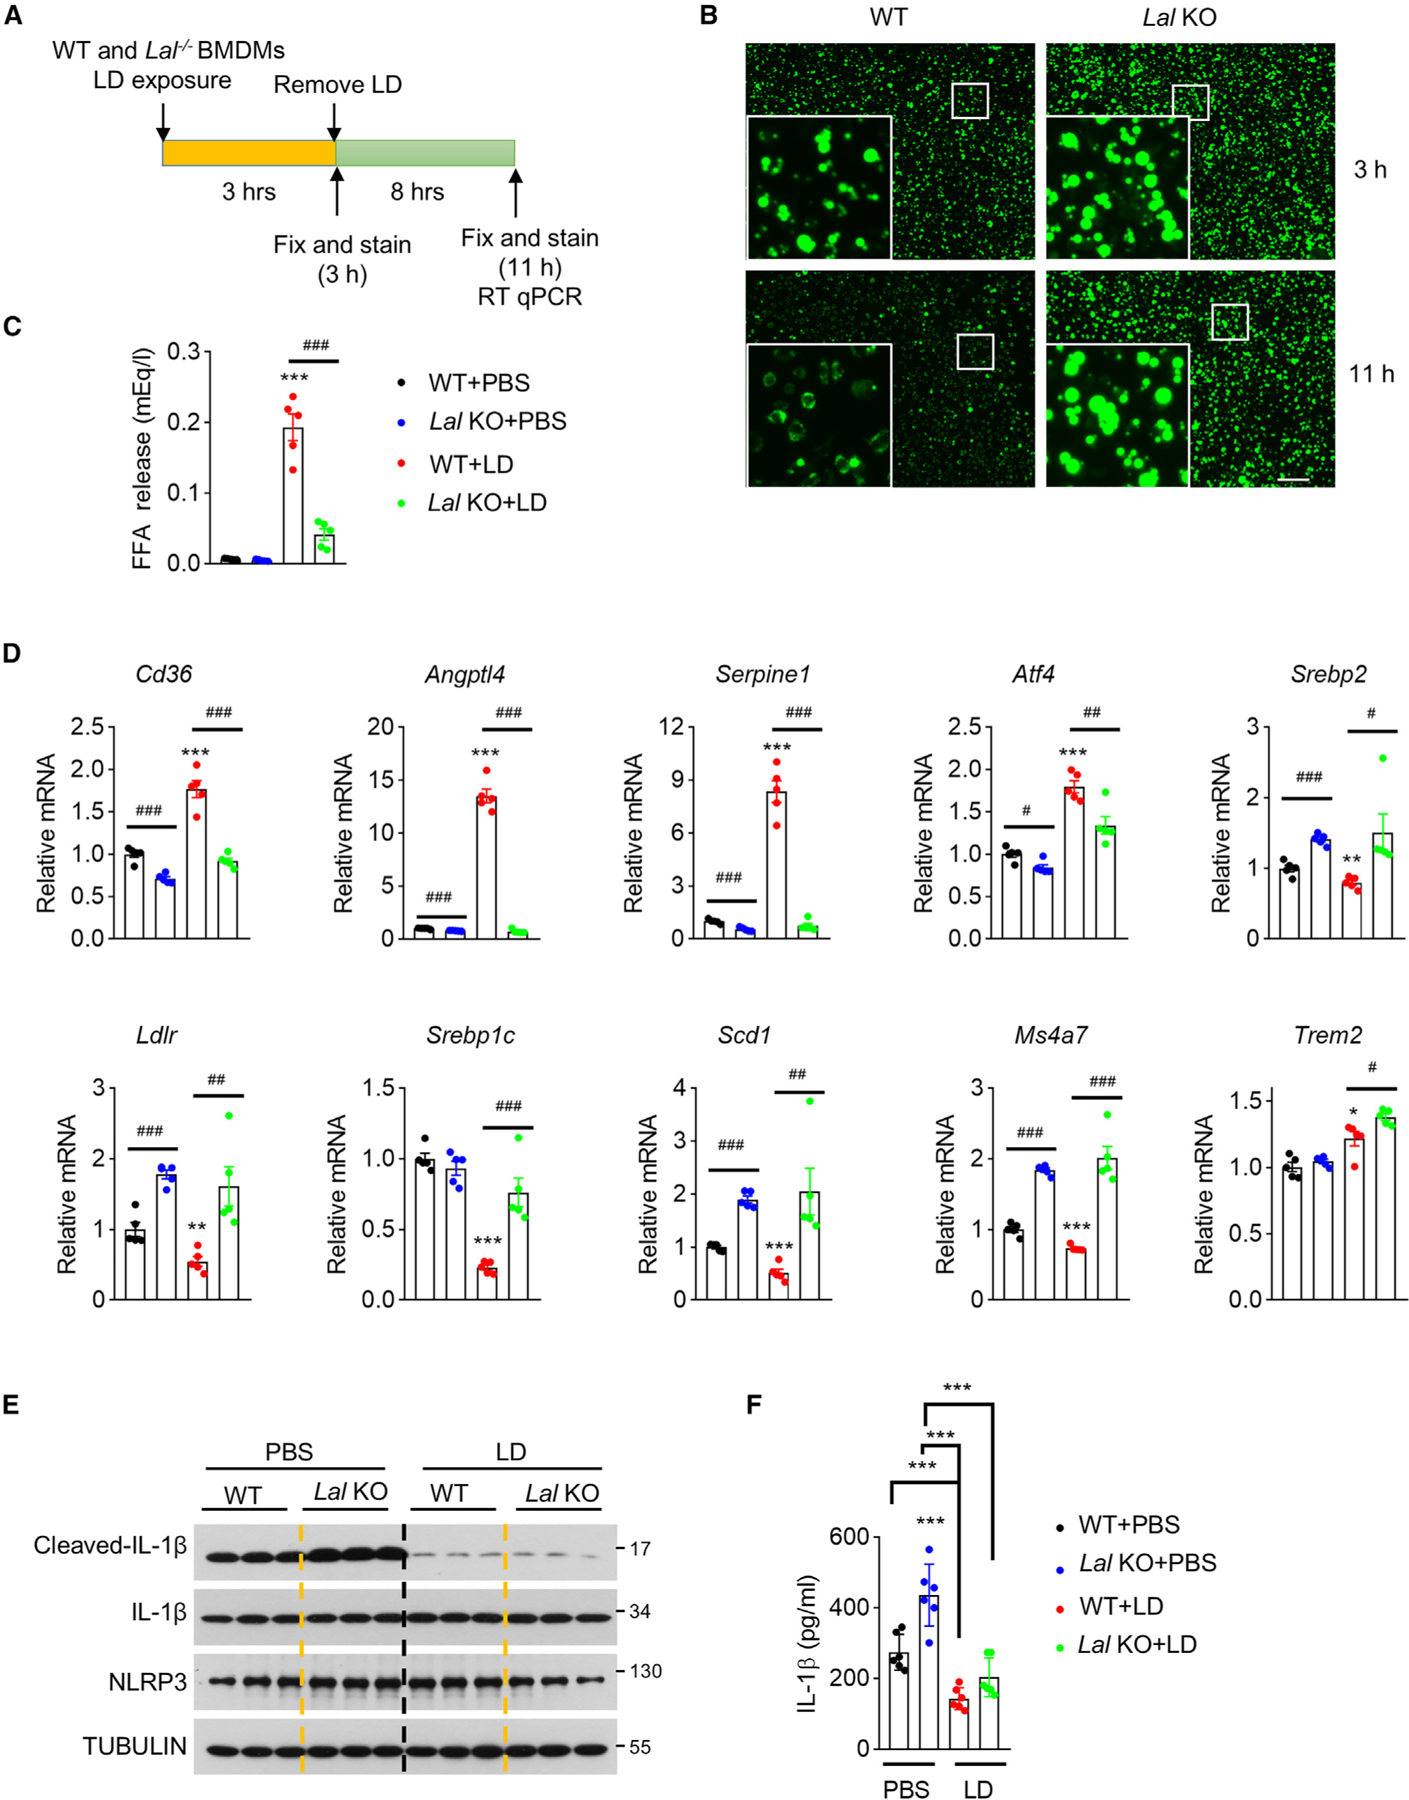
Metabolic dysfunction-associated steatohepatitis (MASH) is characterized by injury to steatotic hepatocytes that triggers the release of endogenous danger-associated molecular patterns. Recent work demonstrated that exposed lipid droplets (LDs) serve as a pathogenic signal that promotes monocyte infiltration and its maturation into triggering receptor expressed in myeloid cells 2 (TREM2+) macrophages in MASH liver. Here we explore the role of LD exposure in modulating inflammatory signaling in macrophages. We found that LD efferocytosis triggers a global transcriptional response and dampens pro-inflammatory signaling in macrophages. LD treatment attenuated NLRP3 inflammasome activation via mechanisms independent of lysosomal LD hydrolysis. While TREM2 was dispensable for LD efferocytosis by macrophages, it was required for the attenuation of proinflammatory signaling upon LD exposure. Additionally, MS4A7 downregulation contributes to LD efferocytosis-mediated dampening of inflammatory response. These results underscore the dual role of LD exposure in MASH liver by promoting monocyte infiltration and TREM2+ macrophage induction, while restraining proinflammatory response in macrophages.

Keywords: CP: Immunology; CP: Metabolism; MS4A7; NLRP3 inflammasome; TREM2; efferocytosis; inflammatory response; lipid droplets; macrophages.


Conflict of interest statement

Declaration of interests The authors declare no competing interests.

Figures

Figure 1.
Figure 1.. Trem2 ablation exacerbates diet-induced MASH
Control WT (n = 15) and Trem2−/− (n = 12) male mice were fed a MASH diet for 22 weeks, starting at 10–12 weeks of age. (A) Body weight and tissue weight. (B) Plasma ALT and AST concentrations. (C) Hematoxylin and eosin (H&E) and Sirius red staining of liver sections. Scale bar, 200 μm. (D) Liver TAG content. (E) qPCR analysis of hepatic gene expression. (F) Immunoblots of total liver lysates from WT and Trem2−/− mice with quantitation of GPNMB protein levels (right). (G) F4/80 immunofluorescence staining of liver sections. Scale bar, 100 μm. Data represent mean ± SEM. In all bar graphs, each dot represents one biological replicate. Two-tailed Student t test, *p < 0.05, **p < 0.01, ***p < 0.001.
Figure 2.
Figure 2.. LD exposure shapes global gene expression in cultured macrophages
(A) Experimental design. (B) BODIPY staining of BMDMs treated with PBS or LDs for 3 h. Scale bar, 100 μm. (C) Volcano plot of differentially expressed genes in PBS and LD-treated BMDMs. Blue and red colors denote significantly downregulated and upregulated genes, respectively. (D) Gene ontology analysis of genes downregulated (blue) and upregulated (red) in response to LD treatment. (E) Heatmap of selected genes regulated by LD treatment. (F) qPCR analysis of gene expression in treated macrophages. (G) Immunoblots of total BMDM lysates. Data represent mean ± SEM. In all bar graphs, each dot represents one biological replicate. Two-tailed Student t test, *p < 0.05, **p < 0.01, ***p < 0.001. See also Figures S1, S2, and S4, and Table S1.
Figure 3.
Figure 3.. LD exposure dampens pro-inflammatory signaling in macrophages
(A) Experimental design. Cultured BMDMs were treated with PBS or LDs for 3 h followed by incubation with LD-free media containing different stimuli for 8 h. (B) qPCR analysis of macrophage gene expression. (C) IL-12β and TNF-α concentrations in CM. (D) Immunoblots of total macrophage lysates. NF-κB, nuclear factor κB. (E) qPCR analysis of macrophage gene expression. (F) Flow cytometry analysis of CD206 expression in BMDMs treated with LDs and IL-4/IL-10. Data represent mean ± SEM. In all bar graphs, each dot represents one biological replicate. Two-tailed Student t test, *p < 0.05, **p < 0.01, ***p < 0.001. See also Figures S1 and S4.
Figure 4.
Figure 4.. LD exposure attenuates NLRP3 inflammasome activation in macrophages
(A) Experimental design. Cultured BMDMs were treated with PBS or LDs for 3 h before NLRP3 inflammasome activation using a combination of LPS priming (200 μg/mL, 4 h) and ATP stimulation (5 mM, 1 h). (B) Immunoblots of total cell lysates. (C) Concentrations of secreted IL-1β in culture media (n = 6 per group). (D and E) NLRP3 inflammasome activation in primary liver macrophages isolated from WT mice fed a MASH diet for 20 weeks. (D) Immunoblots of total cell lysates and quantitation. (E) Concentrations of secreted IL-1β in culture media. (F and G) PBS- and LD-treated BMDMs were subjected to NLRP3 inflammasome activation, and the CM were collected for treatment of cultured primary hepatocytes. Control refers to cells cultured with normal medium. (F) Flow cytometry analysis of hepatocytes using Annexin V and viability dye staining. (G) Quantitation of hepatocyte cell death in (F). Data represent mean ± SEM. In all bar graphs, each dot represents one biological replicate. Two-tailed Student t test, *p < 0.05, **p < 0.01, ***p < 0.001. See also Figure S4.
Figure 5.
Figure 5.. Role of LD hydrolysis in the regulation of macrophage gene expression
(A) Experimental design. (B) BODIPY staining. WT and Lal−/− BMDMs were incubated with LDs for 3 h and switched to LD-free media for additional 8 h. Scale bar, 100 μm. (C) Concentrations of FFAs in macrophage culture media following LD treatment. BMDMs were incubated with LDs for 3 h and switched to 3% fatty acid-free BSA dissolved in HBSS for 2 h (D) qPCR analysis of gene expression. (E and F) WT and Lal−/− BMDMs were loaded with PBS or LDs for 3 h before subjecting to NLRP3 inflammasome activation. (E) Immunoblots of total cell lysates and (F) concentrations of secreted IL-1β in culture media. Data represent mean ± SEM. In all bar graphs, each dot represents one biological replicate. Two-tailed Student t test, * and #p < 0.05, ** and ##p < 0.01, *** and ###p < 0.001. * and # denote the comparison between WT + PBS vs. WT + LD and WT vs. Lal−/−, respectively. One-way ANOVA for (F), ***p < 0.001. See also Figures S3 and S4.
Figure 6.
Figure 6.. Role of TREM2 in mediating the effects of LDs on inflammatory signaling
(A–D) WT and Trem2−/− BMDMs were subjected to NLRP3 inflammasome activation by exposure to LPS (200 μg/mL) for 4 h, followed by 5 mM ATP treatment for 1 h. (A) Immunoblots of total cell lysates, (B) Concentrations of IL-1β in culture media. (C) ASC immunofluorescence staining. Scale bar, 100 μm. (D) Quantitation of ASC specks (arrowheads) cells. (E) BODIPY staining of WT and Trem2−/− BMDMs treated with LDs for 3 h (F) WT and Trem2−/− BMDMs were treated with PBS or LD for 3 h, followed by LPS (20 ng/mL) and INF-γ (10 ng/mL) for 8 h qPCR analysis of macrophage gene expression. (G and H) WT and Trem2−/− BMDMs were treated with LDs for 3 h and then subjected to NLRP3 inflammasome activation. (G) Immunoblots of total cell lysates, and (H) concentrations of IL-1β in culture media. (I) Flow cytometry analysis of hepatocyte cell death. WT and Trem2−/− BMDMs were treated with PBS or LDs for 3 h and subjected to NLRP3 inflammasome activation. CM were collected for incubation with cultured primary hepatocytes. Data represent mean ± SEM. In all bar graphs, each dot represents one biological replicate. Two-tailed Student t test for (B and F). One-way ANOVA for (H and I). *p < 0.05, **p < 0.01, ***p < 0.001. See also Figure S5.
Figure 7.
Figure 7.. Role of MS4A7 in LD-mediated attenuation of inflammatory signaling
(A) BODIPY staining of WT and Ms4a7−/− BMDMs treated with LDs for 3 h. (B) WT and Ms4a7−/− BMDMs were treated with PBS or LDs for 3 h, followed by LPS (20 ng/mL) and INF-γ (10 ng/mL) for 8 h qPCR analysis of macrophage gene expression. (C and D) WT and Ms4a7−/− BMDMs were treated with LDs for 3 h and then subjected to NLRP3 inflammasome activation. (C) Immunoblots of total cell lysates, and (D) concentrations of IL-1β in culture media. (E) Co-immunoprecipitation of endogenous MS4A7 and NLRP3 in cultured BMDMs treated with PBS or LDs. (F) Flow cytometry analysis of hepatocyte cell death. WT and Ms4a7−/− BMDMs were treated with PBS or LDs for 3 h and subjected to NLRP3 inflammasome activation. CM were collected for incubation with cultured primary hepatocytes. (G) A model depicting the dual role of LD exposure in triggering monocyte infiltration and maturation to TREM2+ macrophages and LD efferocytosis-mediated anti-inflammatory response. Data represent mean ± SEM. In all bar graphs, each dot represents one biological replicate. Two-tailed Student t test for (B). One-way ANOVA for (D and F). *p < 0.05, **p < 0.01, ***p < 0.001. See also Figure S5.

References

    1. Loomba R, Friedman SL, and Shulman GI (2021). Mechanisms and disease consequences of nonalcoholic fatty liver disease. Cell 184, 2537–2564. 10.1016/j.cell.2021.04.015. - DOI - PubMed
    1. Schwabe RF, Tabas I, and Pajvani UB (2020). Mechanisms of Fibrosis Development in Nonalcoholic Steatohepatitis. Gastroenterology 158, 1913–1928. 10.1053/j.gastro.2019.11.311. - DOI - PMC - PubMed
    1. Sheka AC, Adeyi O, Thompson J, Hameed B, Crawford PA, and Ikramuddin S (2020). Nonalcoholic Steatohepatitis: A Review. JAMA 323, 1175–1183. 10.1001/jama.2020.2298. - DOI - PubMed
    1. Suzuki A, and Diehl AM (2017). Nonalcoholic Steatohepatitis. Annu. Rev. Med 68, 85–98. 10.1146/annurev-med-051215-031109. - DOI - PubMed
    1. Mihm S (2018). Danger-Associated Molecular Patterns (DAMPs): Molecular Triggers for Sterile Inflammation in the Liver. Int. J. Mol. Sci 19, 3104. 10.3390/ijms19103104. - DOI - PMC - PubMed

Substances

LinkOut - more resources