. 2025 Mar 11:218:115275.
doi: 10.1016/j.ejca.2025.115275. Epub 2025 Feb 8.

Exploring high-throughput drug sensitivity testing in neuroblastoma cell lines and patient-derived tumor organoids in the era of precision medicine

Affiliations

Exploring high-throughput drug sensitivity testing in neuroblastoma cell lines and patient-derived tumor organoids in the era of precision medicine

Karin P S Langenberg et al. Eur J Cancer. .

Abstract

Introduction: Despite druggable events to be present in 80 % of neuroblastomapatients within the Princess Máxima Center precision medicine program 'iTHER', clinical uptake of treatment recommendations has been low, and the clinical impact for individual patients remains hard to predict. This stresses the need for a method integrating genomics and transcriptomics with functional approaches into therapeutic decision making.

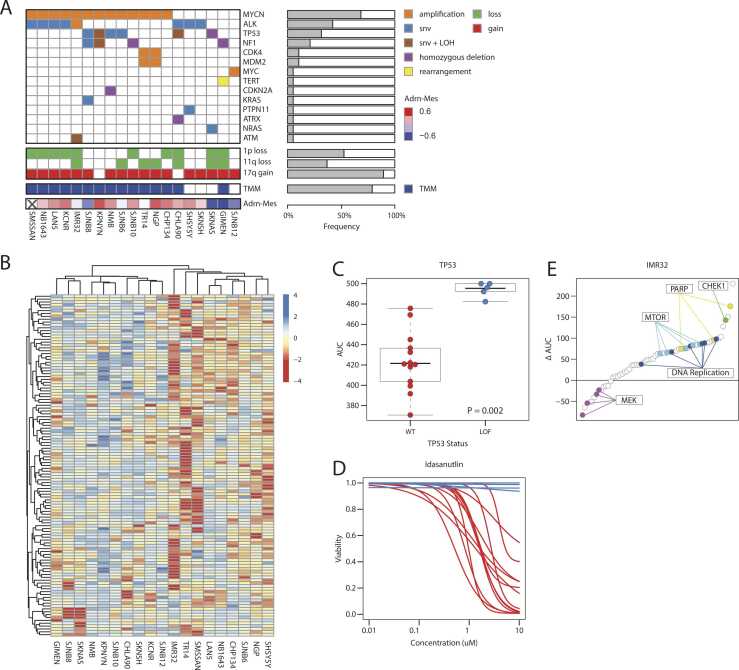
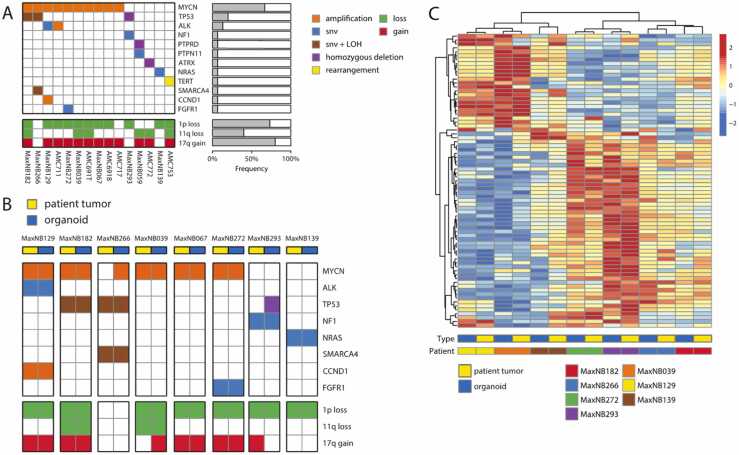
Methods: We aimed to launch an online repository integrating genomics and transcriptomics with high-throughput drug screening (HTS) of nineteen commonly used neuroblastoma cell lines and fifteen neuroblastoma patient-derived organoids (NBL-PDOs). Cell lines, NBL-PDOs and their parental tumors were characterized utilizing (lc)WGS, WES and RNAseq. Cells were exposed to ∼200 compounds. Results were transferred to the R2 visualization platform.

Results: A powerful reference set of cell lines is available, reflecting distinct known pharmacologic vulnerabilities. HTS identified additional therapeutic vulnerabilities, such as a striking correlation between a positive mesenchymal signature and sensitivity to BCL2-inhibitor venetoclax. Finally, we explored personalized drug sensitivities within iTHER, demonstrating HTS can support genomic and transcriptomic results, thereby strengthening the rationale for clinical uptake.

Conclusion: We established a dynamic publicly available dataset with detailed genomic, transcriptomic, and pharmacological annotation of classical neuroblastoma cell lines as well as novel sharable NBL-PDOs, representing the heterogeneous landscape of neuroblastoma. We anticipate that in vitro drug screening will be complementary to genomic-guided precision medicine by supporting clinical decision making, thereby improving prognosis for all neuroblastoma patients in the future.

Keywords: Adolescent; Cancer; Child; High-throughput drug screening; Molecular biology; Molecular targeted therapy; Neuroblastoma; Next-generation sequencing; Organoid; Precision medicine.


Conflict of interest statement

Declaration of Competing Interest The authors declare that they have no known competing financial interests or personal relationships that could have appeared to influence the work reported in this paper.

Figures

Fig. 1
Fig. 1
A repository of neuroblastoma cell lines with detailed genetic and pharmacological annotation. (a) Oncoplot showing the genetic aberrations, TMM and adrenergic-mesenchymal score found in the panel of 19 neuroblastoma cell lines as detected by WGS and RNA-Seq (snv = single nucleotide variant, LOH = Loss Of Heterozygosity). (b) Heatmap showing the compound response profiles (AUC values) for the panel of 19 neuroblastoma cell lines. Only compounds are shown measured for all 19 cell lines and with at least one AUC below 450. AUC values are standardized by row. (c) Boxplots showing the response of the cell lines to idasanutlin treatment separated by TP53 status (WT = Wild Type; LOF = Loss Of Function). P value was determined with the Wilcoxon rank-sum test. (d) Fitted curves for the idasanutlin response of the panel of cell lines. The red curves indicate a TP53 wild type status, the blue curves a TP53 loss-of-function. (e) Plot showing the difference between the mean AUC of the cell line panel (excluding IMR32) and IMR32 (ΔAUC). A positive ΔAUC indicates an above average sensitivity of IMR32, a negative value a higher resistance. A selection of common targets is highlighted. (For interpretation of the references to color in this figure legend, the reader is referred to the web version of this article.)
Fig. 2
Fig. 2
Patient-derived neuroblastoma organoids resemble their parental tumor. (a) Oncoplot showing the genetic aberrations found in the panel of nine novel as well as six previously established neuroblastoma organoids, as detected by lcWGS and/or WES (snv = single nucleotide variant, LOH = Loss Of Heterozygosity). (b) Oncoplot showing the genetic aberrations of eight novel neuroblastoma organoids and their parental tumors. Aberrations were based on lcWGS and/or WES. (c) Heatmap showing the clustered expression profiles of seven neuroblastoma organoids and their parental tumors (patient tumor data for MaxNB067 was not available). The 75 genes with the highest standard deviation were included. Distance measure is ‘correlation’. The colored bars below the heatmap indicate the type of sample (blue = organoid, yellow=patient tumor) and the patient identifier. Batch correction was applied to account for differences in platform and sample type (see Methods). (For interpretation of the references to color in this figure legend, the reader is referred to the web version of this article.)
Fig. 3
Fig. 3
Patient-derived neuroblastoma organoids resemble their parental tumor. (a) Heatmap showing the compound response profiles (AUC values) of the panel of 15 neuroblastoma organoids. Only compounds are shown measured for all 15 organoids, with at least one AUC below 450 and not flagged previously (see Methods). AUC values are standarised row-wise. (b) Boxplots showing the response of the organoids to idasanutlin treatment separated by TP53 status (WT = Wild Type; LOF = Loss Of Function). P value was determined with the Wilcoxon rank-sum test. (c) Fitted curves for the idasanutlin response of the panel of organoids. The red curves indicate a TP53 wild type status, the blue curves a TP53 loss-of-function. (d) Plot showing the correlation between BCL2 gene expression of the organoids and their sensitivity to the BCL2 inhibitor Venetoclax. AUC values on the x-axis decrease from left to right. (e) Plot showing the correlation of BCL2 gene expression in organoids and their matching patient tumor, where available (n = 7). (f) Top 5 results of the GSEA testing the association of RNA expression gene sets with the sensitivity to Venetoclax treatment (AUC). Values shown are the −10 log of the adjusted P values. Red indicates a positive correlation with venetoclax sensitivity, blue a negative correlation. (g) Heatmap showing the expression of genes included in the neuroblastoma mesenchymal and adrenergic signatures (van Groningen et al.). Only genes are included with a significant correlation (limma, adjusted P value < 0.05) with the venetoclax sensitivity. The organoids (columns) are ordered by venetoclax sensitivity. The bar on the left side of the heatmap indicates gene set membership (red = mesenchymal, blue = adrenergic). Gene expression values are standarised row-wise. (For interpretation of the references to color in this figure legend, the reader is referred to the web version of this article.)
Fig. 4
Fig. 4
Neuroblastoma organoids representing clinically relevant molecular targets and their respective in vitro drug sensitivities. Every neuroblastoma model is depicted microscopically, as well as its circos plot (also available on (http://r2platform.com/pmc_nb_drugs/). Subsequent target matching selected drug sensitivities are demonstrated, as well as unexpected in vitro insensitivities. The dotted line represents maximum achievable plasma concentration.

References

    1. Moreno L., Rubie H., Varo A., Le Deley M.C., Amoroso L., Chevance A., et al. Outcome of children with relapsed or refractory neuroblastoma: a meta-analysis of ITCC/SIOPEN European phase II clinical trials. Pediatr Blood Cancer. 2017;64:25–31. - PubMed
    1. London W.B., Bagatell R., Weigel B.J., Fox E., Guo D., Van Ryn C., et al. Historical time to disease progression and progression-free survival in patients with recurrent/refractory neuroblastoma treated in the modern era on Children's Oncology Group early-phase trials. Cancer. 2017;123:4914–4923. - PMC - PubMed
    1. Allemani C., Matsuda T., Di Carlo V., Harewood R., Matz M., Niksic M., et al. Global surveillance of trends in cancer survival 2000-14 (CONCORD-3): analysis of individual records for 37 513 025 patients diagnosed with one of 18 cancers from 322 population-based registries in 71 countries. Lancet. 2018;391:1023–1075. - PMC - PubMed
    1. Rodriguez-Galindo C., Friedrich P., Alcasabas P., Antillon F., Banavali S., Castillo L., et al. Toward the cure of all children with cancer through collaborative efforts: pediatric oncology as a global challenge. J Clin Oncol. 2015;33:3065–3073. - PMC - PubMed
    1. Basta N.O., Halliday G.C., Makin G., Birch J., Feltbower R., Bown N., et al. Factors associated with recurrence and survival length following relapse in patients with neuroblastoma. Br J Cancer. 2016;115:1048–1057. - PMC - PubMed

MeSH terms

Substances