. 2025 Mar;301(3):108310.
doi: 10.1016/j.jbc.2025.108310. Epub 2025 Feb 14.

Binding of small molecules at the P-stalk site of ricin A subunit trigger conformational changes that extend into the active site

Affiliations

Binding of small molecules at the P-stalk site of ricin A subunit trigger conformational changes that extend into the active site

John E McLaughlin et al. J Biol Chem. 2025 Mar.

Abstract

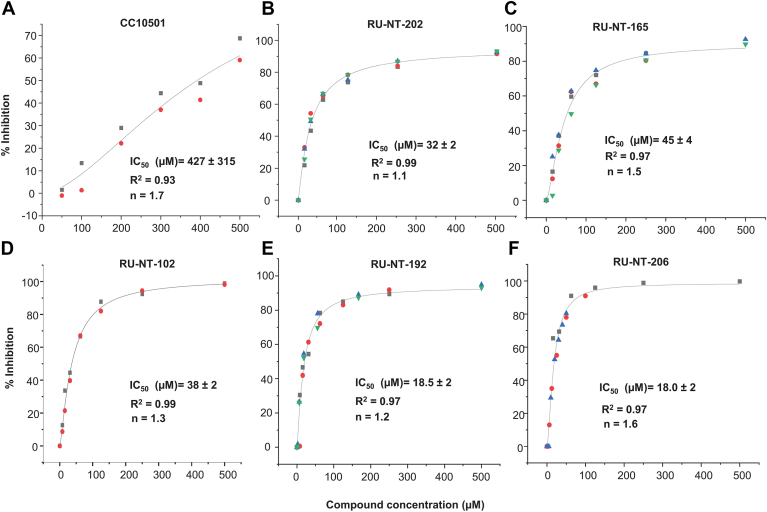
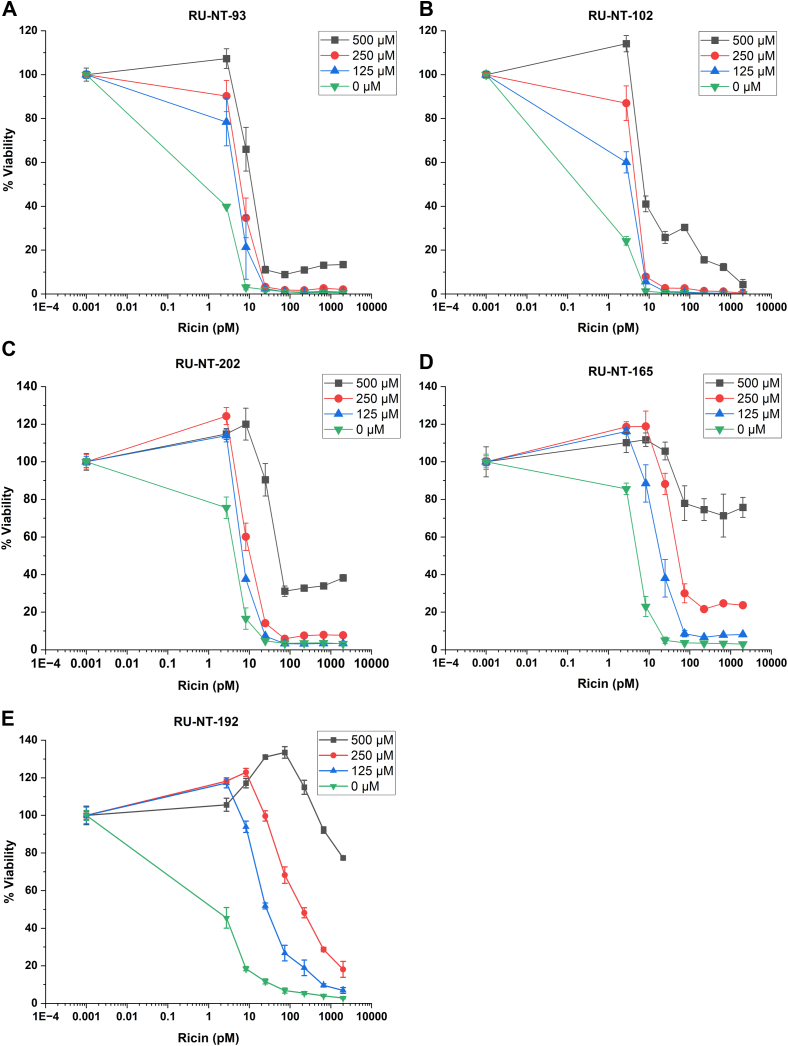
Ricin is a category B agent for bioterrorism, and Shiga toxins are the primary virulence factors of Shiga toxin (Stx) producing Escherichia coli. Ricin and Stxs bind the ribosomal P-stalk proteins to depurinate the sarcin/ricin loop on the eukaryotic ribosome and inhibit translation. Both toxins are prime targets for therapeutic intervention because no effective therapy exists for ricin intoxication or Shiga toxin producing Escherichia coli infection. Binding of ricin toxin A subunit (RTA) to the ribosomal P-stalk stimulates depurination of the sarcin/ricin loop by an unknown mechanism. We previously identified compounds that bind the P-stalk pocket of RTA and inhibit catalytic activity. Here we characterize a second-generation lead compound, which binds the P-stalk pocket of RTA with over 30-fold improved affinity relative to the original compound and inhibits the cytotoxicity of ricin holotoxin in Vero cells with no apparent cellular toxicity by itself. This compound also shows protection against Stx2A1. X-ray crystal structure of RTA-inhibitor complexes suggests that the orientation of the carboxylic acid influences the inhibitor contacts at the P-stalk site of RTA and contributes to inhibitor potency. The structural changes triggered at the P-stalk site of RTA were validated by solution NMR-based chemical shift perturbation analysis. A key finding by NMR is that binding-induced conformational changes extend beyond the P-stalk site to residues in the active site cleft of RTA. Collectively, these results provide valuable new insight into the conformational flexibility in the C-terminal domain of RTA and its potential role in mediating the remarkable catalytic activity of ricin.

Keywords: Shiga toxin inhibitors; conformational changes by NMR; ribosome binding; ricin inhibitors; structure-based design.


Conflict of interest statement

Conflict of interest The authors declare that they have no conflicts of interests with the contents of this article.

Figures

Figure 1
Figure 1
Inhibition ofRTA-mediateddepurination of rat liver ribosomes. CC10501 (A), RU-NT-202 (B), RU-NT-165 (C), RU-NT-102 (D), RU-NT-192 (E), and RU-NT-206 (F) at different concentrations were mixed with 200 pM RTA first and rat liver ribosomes were added to start the reaction. The reaction was incubated at room temperature for 5 min. RNA extraction buffer was added to stop the reaction. RNA was extracted and the level of inhibition was determined by qRT-PCR. Measurements were repeated 2 to 4 times as indicated by the different symbols. The data for the percentage of inhibition at different compound concentrations were fitted with the Hill equation using OriginPro 2023 to calculate the IC50. The “n” values represent the Hill coefficient.
Figure 2
Figure 2
Inhibition of ribosome depurination by ricin holotoxin in Vero cells. Vero cells were plated at 1.5 × 105 /ml and grown for 24 h. Cells were treated with RU-NT-202 (A), RU-NT-102 (B), RU-NT-165 (C), and RU-NT-192 (D) and 200 pM ricin as described in the Experimental procedures. The percentage of depurination was measured by qRT-PCR compared to DMSO-treated cells at 2 h. The half maximal effective concentration (EC50) for inhibition of depurination by ricin holotoxin in Vero cells was determined by fitting the data either with the Hill equation (AC) or the Michaelis–Menten equation (D) using OriginPro 2023. Data are from 3 to 16 biological replicates shown in different colors. The “n” values represent the Hill coefficient.
Figure 3
Figure 3
Protection against the cytotoxicity of ricin holotoxin. Protection by RU-NT-93 (A), RU-NT-102 (B), RU-NT-202 (C), RU-NT-165 (D), and RU-NT-192 (E) in Vero cells was determined by measuring Vero cell viability at 48 h using the CellTiter-Glo Luminescent Cell Viability Assay (Promega), which measures the ATP content released from lysed cells. The data represent three biological replicates.
Figure 4
Figure 4
Structures ofRTA-inhibitorcomplexes. Structure of RTA (green) depicted as a ribbon diagram in complex with inhibitors (A) RU-NT-202 (cyan), (B) RU-NT-165 (gray), and (C) RU-NT-192 (salmon red). RTA active site residue Tyr80 is drawn as sticks and colored red. 2Fo-Fc (blue mesh) and Fo-Fc (red mesh) electron density omit maps of (D) RU-NT-202, (E) RU-NT-165, and (F) RU-NT-192. The original 2Fo-Fc and Fo-Fc electron density omit maps were contoured at 1.0 σ and 3.0 σ levels, respectively. The omit maps were calculated before each inhibitor was built into the density maps. Each inhibitor is drawn as sticks with all carbon atoms in RU-NT-202 colored cyan, all carbon atoms in RU-NT-165 colored gray, and all carbon atoms in RU-NT-192 colored salmon red. All oxygen atoms are colored red and sulfur atoms yellow.
Figure 5
Figure 5
Key inhibitor interactions with RTA. Zoom-in of the noncovalent interactions of RTA (green) in complex with (A) RU-NT-202 (cyan), (B) RU-NT-165 (gray), and (C) RU-NT-192 (salmon red) all drawn as sticks. All nitrogen atoms were colored blue, all oxygen atoms were colored red, and all sulfur atoms were colored yellow. The fluorine atom on RU-NT-202 is colored pale cyan. The salt bridges and hydrogen bond are represented as yellow and red dashes, respectively, with the similar nonpolar contacts between RTA and each inhibitor represented as gray dashes. The π–π interactions are drawn as blue dashes.
Figure 6
Figure 6
Carboxylate configuration influences inhibitor effectiveness.A, a zoomed-in view of the relative rotation of the carboxylate group in RU-NT-202 of 91° relative to the carboxylate group in RU-NT-192 and RU-NT-165, which distanced the carboxylate group of RU-NT-202 away from Arg234 in RTA precluding noncovalent interaction with this RTA residue. B, RU-NT-192 (salmon red), RU-NT-202 (cyan), and RU-NT-165 (gray) drawn as sticks depicting the relative orientation of the carboxylate relative to the thiophene ring in each inhibitor where the larger angle of 26° in RU-NT-192 and 19° in RU-NT-202 slightly increases the electron density around the carboxylate compared to RU-NT-165. The red arrow highlights the rotation of the carboxylate group relative to the thiophene ring in each inhibitor. C, RU-NT-192 (salmon red sticks) superposed onto RU-NT-202 (cyan sticks) revealing the different positions of the benzene ring in each inhibitor.
Figure 7
Figure 7
Analysis of RU-NT-192 binding site in RTA using chemical shift perturbation data obtained from NMR experiments acquired at 700 MHz spectrometer and 25 °C temperature.A, methyl 1H-13C HMQC and (B) amide 1H-15N HSQC in the free state of RTA (black contours) overlaid with the inhibitor-bound complex (red contours). C and D, backbone CSPs mapped on the X-ray structure of RTA (PDB code 1RTC) in two different orientations. Residues with amide CSPs > 0.05 ppm are highlighted in orange and those that disappear in the complex due to exchange broadening are painted red. Annotated methyl groups with CSP > 0 from panel A; substrate binding and catalytic site residues (green) are shown in line representation. E, residue-specific profile of the weighted average of the amide proton (1H) and nitrogen (15N) chemical shift differences between the free state and inhibitor complex calculated using the relationship √0.5∗[(ΔdHN)2 + (0.14∗ΔdN)2]. The exchange-broadened sites in the complex are indicated by red lines.
Figure 8
Figure 8
Analysis of RU-NT-206 binding site in RTA using chemical shift perturbation data obtained from NMR experiments acquired at 700 MHz spectrometer and 25 °C temperature.A, methyl 1H-13C HMQC and (B) amide 1H-15N HSQC in the free state of RTA (black contours) overlaid with the inhibitor-bound complex (red contours). C and D, backbone CSPs mapped on the X-ray structure of RTA (PDB code 1RTC) in two different orientations. Residues with amide CSPs > 0.05 ppm are highlighted in orange and those that disappear in the complex due to exchange broadening are painted red. Annotated methyl groups with CSP > 0 (panel A) and the catalytic site residues (green) are shown in line representation. E, residue-specific profile of the weighted average of the amide proton (1H) and nitrogen (15N) chemical shift differences between the free state and inhibitor complex calculated using the relationship √0.5∗[(ΔdHN)2 + (0.14∗ΔdN)2]. The exchange-broadened sites are shown by red lines.
Figure 9
Figure 9
Slight deviations in the binding mode of each RTA-inhibitor complex.A, the comparable binding mode of RU-NT-165 (gray), RU-NT-192 (salmon red), RU-NT-202 (cyan), and RU-NT-206 (yellow) with RTA (green) disclosed by the superposition of each RTA-inhibitor complex. B, close-up of the noncovalent interactions of RTA (green) in complex with RU-NT-206 (yellow). The salt-bridges and H-bond are represented as yellow and red dashes, respectively. The nonpolar contacts between RU-NT-206 and RTA are drawn as gray dashes. C, RU-NT-206 (yellow sticks) depicting the relative orientation of its carboxylate relative to the thiophene ring in this inhibitor where 43° angle in RU-NT-206 greatly boosts the electron density around the carboxylate of RU-NT-206. The red arrow highlights the rotation of the carboxylate group relative to the thiophene ring in each inhibitor. All nitrogen atoms were colored blue, all oxygen atoms were colored red, and all sulfur atoms were colored yellow.
Figure 10
Figure 10
Synthesis of RU-NT165, RU-NT192, and RU-NT-202.i – boronic acid, aryl halogen, Pd(PPh3)4, K3PO4, dioxane/water; ii – NaOH, THF/water, alternatively LiOH, THF/water/methanol.

References

    1. Audi J., Belson M., Patel M., Schier J., Osterloh J. Ricin poisoning: a comprehensive review. JAMA. 2005;294:2342–2351. - PubMed
    1. Endo Y., Tsurugi K., Yutsudo T., Takeda Y., Ogasawara T., Igarashi K. Site of action of a Vero toxin (VT2) from Escherichia coli O157:H7 and of Shiga toxin on eukaryotic ribosomes. RNA N-glycosidase activity of the toxins. Eur. J. Biochem. 1988;171:45–50. - PubMed
    1. Endo Y., Tsurugi K. RNA N-glycosidase activity of ricin A-chain. Mechanism of action of the toxic lectin ricin on eukaryotic ribosomes. J. Biol. Chem. 1987;262:8128–8130. - PubMed
    1. Karmali M.A., Petric M., Lim C., Fleming P.C., Arbus G.S., Lior H. The association between idiopathic hemolytic uremic syndrome and infection by verotoxin-producing Escherichia coli. J. Infect. Dis. 1985;151:775–782. - PubMed
    1. Tarr P.I., Gordon C.A., Chandler W.L. Shiga-toxin-producing Escherichia coli and haemolytic uraemic syndrome. Lancet. 2005;365:1073–1086. - PubMed

LinkOut - more resources