. 2025 Feb 15;16(1):1661.
doi: 10.1038/s41467-025-56885-9.

FGF21 protects against HFpEF by improving cardiac mitochondrial bioenergetics in mice

Affiliations

FGF21 protects against HFpEF by improving cardiac mitochondrial bioenergetics in mice

Ke Zhang et al. Nat Commun. .

Abstract

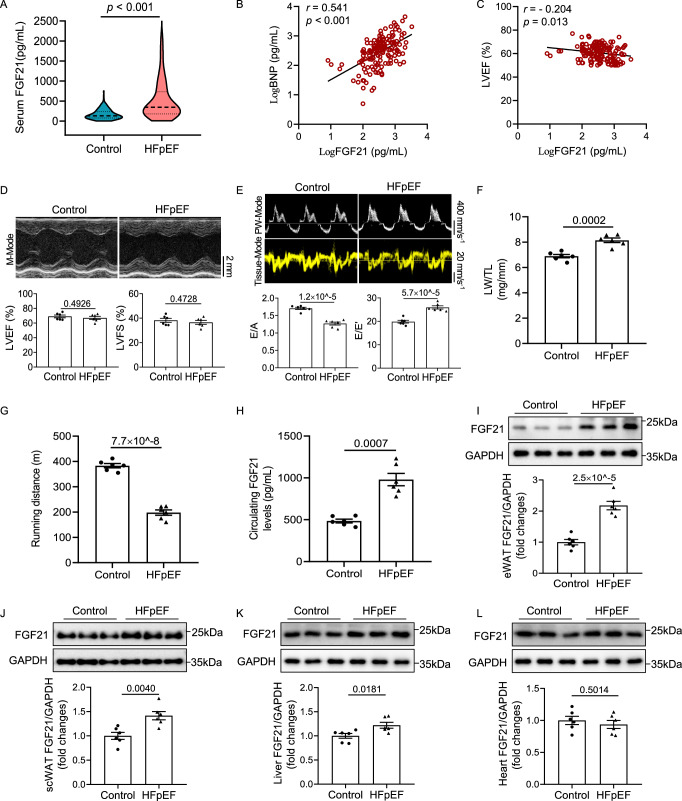
Fibroblast growth factor 21 (FGF21), a metabolic hormone with pleiotropic effects, is beneficial for various cardiac disorders. However, FGF21's role in heart failure with preserved ejection fraction (HFpEF) remains unclear. Here, we show that elevated circulating FGF21 levels are negatively associated with cardiac diastolic function in patients with HFpEF. Global or adipose FGF21 deficiency exacerbates cardiac diastolic dysfunction and damage in high-fat diet (HFD) plus N[w]-nitro-L-arginine methyl ester (L-NAME)-induced HFpEF mice, whereas these effects are notably reversed by FGF21 replenishment. Mechanistically, FGF21 enhances the production of adiponectin (APN), which in turn indirectly acts on cardiomyocytes, or FGF21 directly targets cardiomyocytes, to negatively regulate pyruvate dehydrogenase kinase 4 (PDK4) production by activating PI3K/AKT signals, then promoting mitochondrial bioenergetics. Additionally, APN deletion strikingly abrogates FGF21's protective effects against HFpEF, while genetic PDK4 inactivation markedly mitigates HFpEF in mice. Thus, FGF21 protects against HFpEF via fine-tuning the multiorgan crosstalk among the adipose, liver, and heart.


Conflict of interest statement

Competing interests: The authors declare no competing interests.

Figures

Fig. 1
Fig. 1. Circulating FGF21 levels are increased in subjects with HFpEF.
A Serum FGF21 levels of patients with HFpEF and healthy subjects were measured by immunoassay (HFpEF, n = 151; healthy, n = 146). B, C Correlation analysis between LogFGF21 and LogBNP, as well as left ventricular ejection fraction (LVEF) in subjects with HFpEF. (B, n = 151; C, n = 147). D Left ventricular systolic function of WT mice with HFpEF and controls. Top, M-mode echocardiographic tracings; Bottom, quantification of LVEF and left ventricular fractional shortening (LVFS). n = 6 mice per condition. E Left ventricular diastolic function. Top, pulsed-wave Doppler (top) and tissue Doppler (bottom) tracings of WT mice with or without HFpEF. Bottom, quantification of the ratio between the mitral E wave and A wave (E/A), and the mitral E wave and E′ wave (E/E′). n = 6 mice per condition. The lung weight to tibia length ratio (LW/TL, F) and the running distance during exercise exhaustion test (G) of WT mice with or without HFpEF. n = 6 mice per condition. H Serum FGF21 levels of WT mice with HFpEF and controls were measured by immunoassay. n = 6 mice per condition. FGF21 contents in epididymal white adipose tissue (eWAT, I), subcutaneous white adipose tissue (scWAT, J), liver (K), and heart (L) of mice with HFpEF and controls were tested by immunoblot, respectively. n = 6 mice per condition. Violin plots in (A) are presented as lines indicating the median and interquartile range. Bar graphs in (DL) are shown as mean ± SEM. Statistical significance was determined by the two-sided Mann–Whitney U test (A), two-tailed unpaired Student’s t test (DG, IL), or two-tailed unpaired Student’s t test with Welch’s correction (H). The associations between cardiac function parameters and serum levels of FGF21 were estimated by Pearson correlation analysis (B, C).
Fig. 2
Fig. 2. FGF21 deficiency decreases cardiac diastolic function and increases myocyte size, oxidative stress, and cardiac fibrosis in mice with HFpEF.
A Schematic diagram for evaluating cardiac function and cardiac remodeling in Fgf21 KO mice and WT controls with or without HFpEF. B Average systolic blood pressure (SBP, left) and diastolic blood pressure (DBP, right) of Fgf21 KO and WT mice with or without HFpEF. n = 6 mice per condition. C The body weight of mice mentioned above. n = 6 mice per condition. D Left ventricular systolic function. Top, M-mode echocardiographic tracings. Bottom, quantification of left ventricular ejection fraction (LVEF) and left ventricular fractional shortening (LVFS). n = 6 mice per condition. E Left ventricular diastolic function. Top, representative pulsed-wave Doppler (top) and tissue Doppler (bottom) tracings. Bottom, quantification of the ratio between the mitral E wave and A wave (E/A), and the mitral E wave and E′ wave (E/E′). n = 6 mice per condition. The lung weight to tibia length ratio (LW/TL, F), running distance during exercise exhaustion test (G), and the heart weight to tibia length ratio (HW/TL, H) of mice mentioned above. n = 6 mice per condition. I Hematoxylin and eosin (H&E) and wheat germ agglutinin (WGA) staining of cardiac sections (left) and cardiomyocyte cross-sectional quantification (right) of Fgf21 KO and WT mice with or without HFpEF. Scale bars, 1 mm (H&E), and 25 μm (WGA). n = 50 cardiomyocytes per condition. J Cardiac mRNA expression levels of hypertrophic markers (Anp, Bnp, and Myh7). n = 6 mice per condition. K Dihydroethidium (DHE) staining of cardiac sections (left) and quantification of the intensity (right). Scale bars, 100 μm. n = 6 mice per condition. L Sirius red staining (left) and quantification of fibrotic areas (right). Scale bars, 50 μm. n = 6 mice per condition. M Cardiac contents of fibrotic factors (fibronectin, collagen I, and α-SMA) were tested by immunoblot. n = 6 mice per condition. Violin plots in (I) are presented as lines indicating the median and interquartile range; other bar graphs are presented as mean ± SEM. Statistical significance was determined by the two-way ANOVA, followed by Tukey’s multiple comparison test.
Fig. 3
Fig. 3. Mitochondrial function in FGF21 null mice with HFpEF.
A Gene Set Enrichment Analysis (GSEA) - Gene Ontology (GO) analysis of proteomics data from the heart tissue of AAV-Fgf21- or AAV-GFP-treated mice with HFpEF. B, C Top, transmission electron microscopy images of heart tissue in Fgf21 KO and WT mice with or without HFpEF, or AAV-Fgf21-treated mice with HFpEF. Scale bar, 1 μm. Bottom, quantifications of mitochondrial density (n = 5 mice per condition), total area (n = 5 mice per condition), and cristae number (n = 50 mitochondria per condition). D, E Cardiac ATP content in mice mentioned above. n = 5 mice per condition. F Cardiac mitochondrial respiratory electron transport chain (ETC) complex I–V subunits were tested by immunoblot. n =  3 independent experiments. The activity of pyruvate dehydrogenase in the heart tissues (G), cardiac pyruvate (H), and acetyl-CoA (I) levels in Fgf21 KO and WT mice with or without HFpEF. n = 5 mice per condition. The activity of pyruvate dehydrogenase in the heart tissues (J), cardiac pyruvate (K), and acetyl-CoA (L) levels in mice with HFpEF, treated with AAV-Fgf21 or AAV-GFP. n = 5 mice per condition. MP Neonatal rat ventricular myocytes (NRVMs) were exposed to palmitic acid (PA) with a dosage of 500 μmol/L, then incubated with recombinant mouse FGF21 (rmFGF21) for 24 h. M Representative images of DCFH-DA staining and MitoSOX Green staining (top) and quantification of the DCFH-DA intensity and mitochondrial length (bottom). Scale bars, 50 μm for DCFH-DA staining, 10 μm (top) and 2 μm (bottom) for MitoSOX Green staining. n = 5 biological samples. N Representative images of JC-1 staining (left) and quantification of the red/green fluorescence intensity ratio (right). Scale bars, 50 μm. Aggregates, red; Monomers, green. n = 5 biological samples. O Real-time monitoring of the oxygen consumption rate (OCR) in NRVMs. n = 5 biological samples. P ATP contents tested by spectrophotometric methods. n = 5 biological samples. Violin plots in (B, C) are presented as lines indicating the median and interquartile range; other bar graphs are presented as mean ± SEM. The statistical significance of differences was assessed by two-way ANOVA with Tukey’s multiple comparison.
Fig. 4
Fig. 4. FGF21 decreases PDK4 expression in mice with HFpEF.
A Volcano plot of proteomic analysis in AAV-Fgf21- or AAV-GFP-treated mice with HFpEF. B Heatmap of the differentially expression proteins (DEPs) in the heart tissues of AAV-Fgf21- or AAV-GFP-treated mice with HFpEF. C Relative expression levels of cardiac PDK4 in AAV-Fgf21- or AAV-GFP-treated mice with HFpEF from the proteomic analysis data. n = 4 mice per condition. Cardiac PDK4 levels in Fgf21 KO and WT mice with or without HFpEF (D) or AAV-Fgf21- or AAV-GFP-treated HFpEF mice (E), tested by immunoblot, respectively. n = 6 mice per condition. The expressional difference of cardiac PDK4 in the mitochondria (F) and non-mitochondria (G) of cardiomyocytes in HFpEF mice and controls was examined by immunoblot, respectively. n = 6 mice per condition. Data are presented as mean ± SEM. Statistical significance was determined by the two-tailed unpaired Student’s t test (A, F, G), two-sided Brown-Forsythe and Welch ANOVA with Dunnett’s multiple comparison test (C), or two-way ANOVA with Tukey’s multiple comparison test (D, E).
Fig. 5
Fig. 5. Knockdown of cardiac PDK4 mitigates HFpEF-induced cardiac diastolic dysfunction, cardiac hypertrophy, cardiac oxidative stress and cardiac fibrosis in mice.
A Average systolic blood pressure (SBP, left) and diastolic blood pressure (DBP, right) of Fgf21 KO and WT mice with HFpEF, after treatment with or without Pdk4 shRNA. n = 6 mice per condition. B The body weight of mice mentioned above. n = 6 mice per condition. C Left ventricular diastolic function of mice mentioned above. Top, pulsed-wave Doppler (top) and tissue Doppler (bottom) tracings. Bottom, quantification of the ratio between the mitral E wave and A wave (E/A), and the mitral E wave and E′ wave (E/E′). n = 6 mice per condition. D The lung weight to tibia length ratio (LW/TL) of mice mentioned above. n = 6 mice per condition. Running distance during exercise exhaustion test (E) and the heart weight to tibia length ratio (HW/TL, F) of mice mentioned above. n = 6 mice per condition. G Hematoxylin and eosin (H&E) and wheat germ agglutinin (WGA) staining of cardiac sections (left) and cardiomyocyte cross-sectional area quantification (right) in mice mentioned above. Scale bars, 1 mm (H&E), and 25 μm (WGA). n = 50 cardiomyocytes per condition. H The mRNA expression levels of cardiac hypertrophic marker genes (Anp, Bnp, and Myh7) in mice mentioned above. n = 6 mice per condition. I Dihydroethidium (DHE) staining (left) of heart tissues and quantification (right) of the intensity, Scale bars, 100 μm. n = 6 mice per condition. J Sirius red staining of heart tissues (left) and quantification of the fibrotic areas (right). Scale bars, 50 μm. n = 6 mice per condition. K Cardiac contents of fibrotic factors, including fibronectin, collagen I, and α-SMA tested by immunoblot. n = 6 mice per condition. L Cardiac p-PDH, PDH and PDK4 contents of mice tested by immunoblot. n = 6 mice per condition. M Cardiac pyruvate dehydrogenase activity in mice mentioned above. n = 6 mice per condition. Cardiac pyruvate (N), acetyl-CoA (O), and ATP (P) contents in mice mentioned above. n = 6 mice per condition. Violin plots in (G) are presented as lines indicating the median and interquartile range; other bar graphs are presented as mean ± SEM. Statistical significance was determined by the two-way ANOVA, followed by Tukey’s multiple comparison test.
Fig. 6
Fig. 6. FGF21 improves mitochondrial bioenergetics by attenuating PDK4 expression.
A Cardiac p-PI3K, PI3K, p-AKT, AKT levels in Fgf21 KO and WT mice with or without HFpEF. n = 6 mice per condition. B Cardiac p-PI3K, PI3K, p-AKT, AKT contents in mice with HFpEF, treated with AAV-Fgf21 or AAV-GFP. n = 6 mice per condition. CI Neonatal rat ventricular myocytes (NRVMs) were incubated with palmitic acid (PA) before administration of recombinant mouse FGF21 (rmFGF21), and then treated with LY294002 or vehicle for 24 h. For Flag-Pdk4 transfection, NRVMs were infected with Flag-Pdk4 for 48 h, then incubated with PA and rmFGF21, followed by treatment with LY294002 or vehicle. C PDK4, p-PDH, and PDH levels in NRVMs were tested by immunoblot. n = 5 biological samples. The activity of pyruvate dehydrogenase (D), pyruvate (E), acetyl-CoA (F), and ATP (G) contents in NRVMs. n = 5 biological samples. H Representative images of DCFH-DA staining and MitoSOX Green staining (top) and quantification of the DCFH-DA intensity and mitochondrial length (bottom). Scale bars, 50 μm for DCFH-DA staining, 10 μm (top) and 2 μm (bottom) for MitoSOX Green staining. n = 5 biological samples. I Representative images of JC-1 staining (left) and quantification of the red/green fluorescence intensity ratio (right). Scale bars, 50 μm. Aggregates, red; Monomers, green. n = 5 biological samples. Data are presented as mean ± SEM. Statistical significance was determined by two-way ANOVA, followed by Tukey’s multiple comparison test (A, B). Other assays were assessed by one-way ANOVA, followed by Tukey’s multiple comparison test.
Fig. 7
Fig. 7. The protective effects of FGF21 against HFpEF-induced cardiac diastolic dysfunction and cardiac damage are notably attenuated in APN null mice.
A Average systolic blood pressure (SBP, left) and diastolic blood pressure (DBP, right) of Apn KO and WT mice with HFpEF after treatment with AAV-Fgf21 or AAV-GFP, respectively. n = 6 mice per condition. B The body weight of mice mentioned above. n = 6 mice per condition. C Left ventricular diastolic function of Apn KO and WT mice with HFpEF, treated with AAV-Fgf21 or AAV-GFP, respectively. Top, representative pulsed-wave Doppler (top) and tissue Doppler (bottom) tracings of mice. Bottom, quantification of the ratio between the mitral E wave and A wave (E/A), and the mitral E wave and E′ wave (E/E′). n = 6 mice per condition. D The lung weight to tibia length ratio (LW/TL) of mice mentioned above. n = 6 mice per condition. Running distance during exercise exhaustion test (E) and the heart weight to tibia length ratio (HW/TL, F) of mice mentioned above. n = 6 mice per condition. G Hematoxylin and eosin (H&E) and wheat germ agglutinin (WGA) staining of cardiac sections (left) and cardiomyocyte cross-sectional area quantification (right) in mice mentioned above. Scale bars, 1 mm (H&E), and 50 μm (WGA). n = 50 cardiomyocytes per condition. H The mRNA expression levels of cardiac hypertrophic marker genes (Anp, Bnp, and Myh7) in mice mentioned above. n = 6 mice per condition. I Dihydroethidium (DHE) staining (left) of heart tissues and quantification (right) of the intensity, Scale bars, 100 μm. n = 6 mice per condition. J Sirius red staining of heart tissues (left) and quantification of the fibrotic areas (right). Scale bars, 50 μm. n = 6 mice per condition. K Cardiac contents of fibrotic factors, including fibronectin, collagen I, and α-SMA tested by immunoblot. n = 6 mice per condition. L Cardiac PDK4, p-PDH and PDH contents of mice tested by immunoblot. n = 6 mice per condition. M Cardiac pyruvate dehydrogenase activity in mice mentioned above. n = 6 mice per condition. Cardiac pyruvate (N), acetyl-CoA (O), and ATP (P) contents in mice mentioned above. n = 6 mice per condition. Violin plots in (G) are presented as lines indicating the median and interquartile range; other bar graphs are presented as mean ± SEM. Statistical significance was assessed by two-way ANOVA, followed by Tukey’s multiple comparison test.
Fig. 8
Fig. 8. FGF21 enhances the beneficial effect of APN on mitochondrial bioenergetics in NRVMs.
Neonatal rat ventricular myocytes (NRVMs) were co-cultured with subcutaneous adipose tissues isolated from WT (wt-SAT) or Apn KO (ko-SAT) mice for 24 h after 48 h of Flag-Pdk4 transfection, then treated with palmitic acid (PA), followed by incubation with recombinant mouse FGF21 (rmFGF21) or rmFGF21 plus LY294002 for 24 h. A p-PI3K, PI3K, p-AKT, AKT, PDK4, p-PDH, and PDH levels in NRVMs were tested by immunoblot. n = 4 biological samples. The activity of pyruvate dehydrogenase (B), pyruvate (C), acetyl-CoA (D), and ATP (E) contents in NRVMs. n = 5 biological samples. F Representative images of DCFH-DA staining and MitoSOX Green staining (top) and quantification of the DCFH-DA intensity and mitochondrial length (bottom). Scale bars, 50 μm for DCFH-DA staining, 10 μm (top) and 2 μm (bottom) for MitoSOX Green staining. n = 5 biological samples. G Representative images of JC-1 staining (left) and quantification of the red/green fluorescence intensity ratio (right). Scale bars, 50 μm. Aggregates, red; Monomers, green. n = 5 biological samples. H Real-time monitoring of the oxygen consumption rate (OCR) in NRVMs. n = 5 biological samples. Data are presented as mean ± SEM. Statistical significance was determined by one-way ANOVA, followed by Tukey’s multiple comparison test.

References

    1. Kharitonenkov, A. et al. FGF-21 as a novel metabolic regulator. J. Clin. Investig.115, 1627–1635 (2005). - PMC - PubMed
    1. Fisher, F. M. & Maratos-Flier, E. Understanding the physiology of FGF21. Annu. Rev. Physiol.78, 223–241 (2016). - PubMed
    1. Salminen, A., Kaarniranta, K. & Kauppinen, A. Regulation of longevity by FGF21: Interaction between energy metabolism and stress responses. Ageing Res. Rev.37, 79–93 (2017). - PubMed
    1. Coskun, T. et al. Fibroblast growth factor 21 corrects obesity in mice. Endocrinology149, 6018–6027 (2008). - PubMed
    1. Kharitonenkov, A. et al. The metabolic state of diabetic monkeys is regulated by fibroblast growth factor-21. Endocrinology148, 774–781 (2007). - PubMed

MeSH terms

Substances