. 2025 Feb 15;24(1):48.
doi: 10.1186/s12943-025-02226-9.

Single-cell RNA sequencing identifies molecular biomarkers predicting late progression to CDK4/6 inhibition in patients with HR+/HER2- metastatic breast cancer

Affiliations

Single-cell RNA sequencing identifies molecular biomarkers predicting late progression to CDK4/6 inhibition in patients with HR+/HER2- metastatic breast cancer

Linjie Luo et al. Mol Cancer. .

Abstract

Background: Cyclin-dependent kinase 4/6 inhibitors (CDK4/6is) in combination with endocrine therapy are the standard treatment for patients with hormone receptor-positive, HER2-negative metastatic breast cancer (mBC). Despite the efficacy of CDK4/6is, intrinsic resistance occurs in approximately one-third of patients, highlighting the need for reliable predictive biomarkers.

Methods: Single-cell RNA sequencing analyzed metastatic tumors from HR+/HER2- mBC patients pre-CDK4/6i treatment at baseline (BL) and/or at disease progression. BL samples were from CDK4/6i responders (median progression-free survival [mPFS] = 25.5 months), while progressors were categorized as early-progressors (EP, mPFS = 3 months) and late-progressors (LP, mPFS = 11 months). Metastatic sites included liver, pleural effusions, ascites, and bone. InferCNV distinguished tumor cells, and functional analysis utilized the Molecular Signatures Database.

Results: LP tumors displayed enhanced Myc, EMT, TNF-α, and inflammatory pathways compared to those EP tumors. Samples from BL and LP responders showed increased tumor-infiltrating CD8+ T cells and natural killer (NK) cells compared to EP non-responders. Notably, despite a high frequency of CD8+ T cells in responding tumors, a functional analysis revealed significant upregulation of genes associated with stress and apoptosis in proliferative CD4+ and CD8+ T cells in BL tumors compared to in EP and LP tumors. These genes, including HSP90 and HSPA8, are linked to resistance to PD1/PD-L1 immune checkpoint inhibitors. A ligand-receptor analysis showed enhanced interactions associated with inhibitory T-cell proliferation (SPP1-CD44) and suppression of immune activity (MDK-NCL) in LP tumors. Longitudinal biopsies consistently revealed dynamic NK cell expansion and enhanced cytotoxic T cell activity, alongside upregulation of immune activity inhibition, in LP tumors compared to in BL tumors. Notably, the predictive biomarker panel from BL tumor cells was validated in 2 independent cohorts, where it consistently predicted a significant improvement in mPFS duration in signature-high versus -low groups.

Conclusion: This study underscores the significance of molecular biomarkers in predicting clinical outcomes to CDK4/6i. Tumor-infiltration CD8+ T and NK cells may also serve as baseline predictors. These insights pave the way for optimizing therapeutic strategies based on microenvironment-specific changes, providing a personalized and effective approach for managing HR+/HER2- mBC and improving patient outcomes.

Keywords: CDK4/6 inhibitor; Drug resistance; Metastatic breast cancer; Outcome prediction; Predictive biomarker; Single-cell RNA-sequencing; Target therapy; Transcriptomics; Tumor microenvironment; Tumor-infiltrating lymphocytes.


Conflict of interest statement

Declarations. Ethics approval and consent to participate: Tumor biopsy samples were collected from patients with HR+/HER2- mBC treated at the University of Texas MD Anderson Cancer Center under the Institutional Review Board (IRB)-approved protocol (PA19-0047). All participants signed informed consent. Clinical data were sourced from electronic medical records (OneConnect and Care Everywhere) and a prospectively maintained Breast Cancer Management System, managed by the Breast Medical Oncology Department from the University of Texas MD Anderson Cancer Center. The validation cohort comprised published sequencing data from Korean patients with HR+/HER2- mBC (NCT03401359) [35]. This cohort included patients with recurrent and/or mBC treated with palbociclib plus endocrine therapy at Samsung Medical Center and Seoul National University Hospital from 2017 to 2020. All participants signed informed consent. Patients who refused to provide informed consent or withdrew from the study were excluded. Competing interests: K.K.: Apeiron, Blueprint Medicines, REPARE, Schrodinger, and Novartis. K.K.H.: Armada Health, AstraZeneca, Cairn Surgical, Eli Lilly & Co, Lumicell. S.D.: EMD Serono, Guardant Health, Novartis, Pfizer, Sermonix, Taiho. D.T.: AstraZeneca, GlaxoSmithKline, Gilead, Novartis, OncoPep, Pfizer, Polyphor, Personalis, Puma Biotechnology, Sermonix, Stemline-Menarini. The rest of the authors declare no competing interests.

Figures

Fig. 1
Fig. 1
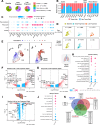
Identification of tumor and non-tumor cells. A Schematic depicting the study design, including 8 BL samples, 3 EP samples, and 7 LP samples from patients with HR+/HER2- mBC on CDK4/6i treatment. The cutoff for EP versus LP samples was a PFS duration of 6 months. B Study workflow illustrating sample processing, tumor cell identification (inferred by the presence of copy number aberrations using InferCNV), and downstream analysis. C UMAP plot of 18 samples in the embedding space. D Bar plot showing the relative fraction of tumor versus non-tumor cells for each sample, stratified by different sample statuses (BL, EP, and LP). E UMAP plot of tumor cells (left, pink) versus non-tumor cells (right, blue) without (top) or with (bottom) Harmony integration. F UMAP plot of cells, stratified by different sample statuses (BL, EP, and LP). G Heatmap displaying the expression of the top 15 differentially expressed genes, stratified by different sample statuses (BL, EP, and LP). H Predictive biomarker panels generated from the top differentially expressed genes from BL tumor cells. I Hallmark pathway analysis in tumor cells. The dot size represents the percentage of cells with the expression of certain genes under each sample status
Fig. 2
Fig. 2
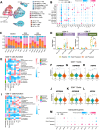
Tumor cells stratified by metastatic site. A Pie chart displaying the frequency of metastatic sites, stratified by different sample statuses (BL, EP, and LP). B Bar plot showing the relative fraction of tumor versus non-tumor cells for each sample, stratified by different metastatic sites (ascites, liver, pelvic bone, and pleural effusion). C Dot plot depicting the top 7 differentially expressed genes across various metastatic sites. D UMAP plot of tumor cells from the liver and pleural effusion, stratified by different sample statuses (BL, EP, and LP). E Trajectory analysis of liver and pleural effusion samples using Monocle 3. F Volcano plot showing differentially expressed genes between BL (left) and LP (right) samples with pleural effusion metastasis. The x-axis indicates the log2 fold changes, while the y-axis represents the negative log P values. A positive log2 fold change indicates genes are upregulated in the LP samples. G Volcano plot showing differentially expressed genes between the EP (left) and LP (right) samples with pleural effusion metastasis. H Hallmark GSEA showing the normalized enrichment score from pleural effusion samples. I Volcano plot showing differentially expressed genes between the BL (left) and LP (right) samples from the liver metastases. J Hallmark pathway analysis showing the normalized enrichment score from samples with liver metastases. K Venn diagram showing overlapping and unique genes from pleural effusion or liver metastases in BL samples
Fig. 3
Fig. 3
Analysis of major non-tumor cell subtypes. A UMAP plot of major non-tumor cells stratified by different sample statuses (BL, EP, and LP). B Dot plot showing the marker gene expression for each major non-tumor cell type in (A). C Bar plot showing the relative fractions of major non-tumor cell types for each sample. The color legend is the same as in panel (A). D Cell fraction frequency of major non-tumor cell types across sample statuses (BL, EP, and LP). E MP analysis heatmap showing the median module score difference from samples with pooled T cells. F Ligand-receptor (L-R) interaction analysis using CellChat in samples from BL, EP, and LP. The red box indicates the SPP1-CD44 or ITGA4 interactions, while the green box indicates the MDK-NCL, MDK-syndecan, or LGALS9 interactions. *, p < 0.05
Fig. 4
Fig. 4
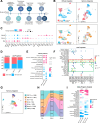
CD4+ T and CD8+ T cell functional analysis. A t-Distributed stochastic neighbor embedding (t-SNE) plot of 13 different subtypes of T cells in the embedding space. B Dot plot showing the marker gene expression of each T cell subtype in (A). C Bar plot showing the relative fraction of each T cell subtype for each sample, stratified by different sample statuses (BL, EP, and LP). D Cell fraction of CD4+ and CD8+ T cell subtypes in BL, EP, and LP samples. E Heatmap displaying expression of 14 curated gene signatures across CD4+ T cell clusters. Violin plots show significantly differentially expressed stress genes of (F) HSP90AA, (G) HSP90AB, and (H) HSPA8 across different groups for CD4+ T cells. I Heatmap displaying expression of 14 curated gene signatures across CD8+ T cell clusters. Violin plots showing that (J) HSP90AA, (K) HSP90AB, and (L) HSPA8 were significantly differentially expressed across different groups for CD8.+ T cells. M Dot plot showing the expression of exhaustive gene signatures across different groups. *, p < 0.05; **, p < 0.01; ***, p < 0.001; ****, p < 0.0001
Fig. 5
Fig. 5
Other non-tumor cells atlas. A UMAP plot of NK cells stratified by 3 different NK subtypes. B Comparison of NK cell subtype fractions among BL, EP, and LP samples. C Dot plot showing the marker gene expression of each NK cell subtype in (A). D Heatmaps of module score differences from samples with NK cells, M1 macrophages, M2 macrophages, and B cells. (E) UMAP plot of myeloid cells stratified by 5 different cell subtypes. F Comparison of macrophage cell subtype fractions among BL, EP, and LP samples. G Comparison of DC subtype fractions among BL, EP, and LP samples. H UMAP plot of annotated myeloid cells stratified by BL, EP, and LP samples. I Dot plot showing the marker gene expression for each myeloid cell subtype in (D). J Module score analysis of M1 macrophages among BL, EP, and LP samples. K Module score analysis of M2 macrophages between BL, EP, and LP samples. *, p < 0.05
Fig. 6
Fig. 6
Longitudinal biopsy analysis. A Workflow outlining the history of BC diagnosis and collection of longitudinal samples from patient PA3. B UMAP plot displaying tumor cells (pink) versus non-tumor cells (blue) with (right) or without (left) Harmony integration. Samples were stratified based on 3 longitudinal biopsies (PA3, PA3#1, and PA3#2). C Dot plot showing the top 10 differentially expressed genes across 3 longitudinal biopsies. D Bar plot depicting the relative fraction of tumor cells versus non-tumor cells for each sample. E Hallmark pathway analysis conducted in tumor cells from each sample. F Ligand-receptor (L-R) interaction analysis using CellChat in progression samples. The red box indicates the MIF and CD74 interactions, while the green box indicates the MDK-NCL and LGALS9-CD44 interactions. G UMAP plot of major non-tumor cell subtypes with Harmony integration. H Alluvial plot demonstrating the dynamic changes in major non-tumor cell subtype fractions across 3 longitudinal samples. The color legend is the same as in panel (G). I Heatmap from MP module score analysis displaying the median module score difference from pooled CD4+ and CD8+ T cells, respectively
Fig. 7
Fig. 7
Predictive biomarker signature validation. A Workflow detailing the collection process for fresh biopsies and FFPE samples for bulk RNA sequencing and subsequent data processing. B Composition of samples in the MD Anderson cohort (n = 89). The cutoff for early versus late progression was 6 months. C KM plots illustrating mPFS time in the signature-high group compared to the -low group were generated using fresh biopsy RNA-seq data from the MD Anderson cohort (n = 35) and (D) FFPE RNA-seq data from the MD Anderson cohort (n = 54). KM plots, shown with the mPFS duration, were generated utilizing all 13 upregulated gene signatures for tissue samples and 10 upregulated gene signatures for FFPE samples, respectively. E Composition of samples in the Korean cohort (n = 61). F Utilizing bulk RNA-seq data from the Korean cohort (n = 61), we generated KM plots with the indicated mPFS durations utilizing 8 upregulated gene signatures. Log-rank test p-values are displayed

References

    1. Sung H, Ferlay J, Siegel RL, Laversanne M, Soerjomataram I, Jemal A, Bray F. Global cancer statistics 2020: GLOBOCAN estimates of incidence and mortality worldwide for 36 cancers in 185 countries. CA Cancer J Clin. 2021;71(3):209–49. - PubMed
    1. Howlader N, Altekruse SF, Li CI, Chen VW, Clarke CA, Ries LAG, Cronin KA. US incidence of breast cancer subtypes defined by joint hormone receptor and HER2 status. J Natl Cancer Inst. 2014;106(5):dju055. - PMC - PubMed
    1. Reinert T, Barrios CH. Optimal management of hormone receptor positive metastatic breast cancer in 2016. Ther Adv Med Oncol. 2015;7(6):304–20. - PMC - PubMed
    1. Network, N. C. C. NCCN Guidelines for Breast Cancer V.1.2023; 2023.
    1. Finn RS, Martin M, Rugo HS, Jones S, Im S-A, Gelmon K, Harbeck N, Lipatov ON, Walshe JM, Moulder S. Palbociclib and letrozole in advanced breast cancer. N Engl J Med. 2016;375(20):1925–36. - PubMed

MeSH terms