. 2025 Feb 25;44(2):115315.
doi: 10.1016/j.celrep.2025.115315. Epub 2025 Feb 15.

TGF-β1-mediated intercellular signaling fuels cooperative cellular invasion

Affiliations

TGF-β1-mediated intercellular signaling fuels cooperative cellular invasion

Tala O Khatib et al. Cell Rep. .

Abstract

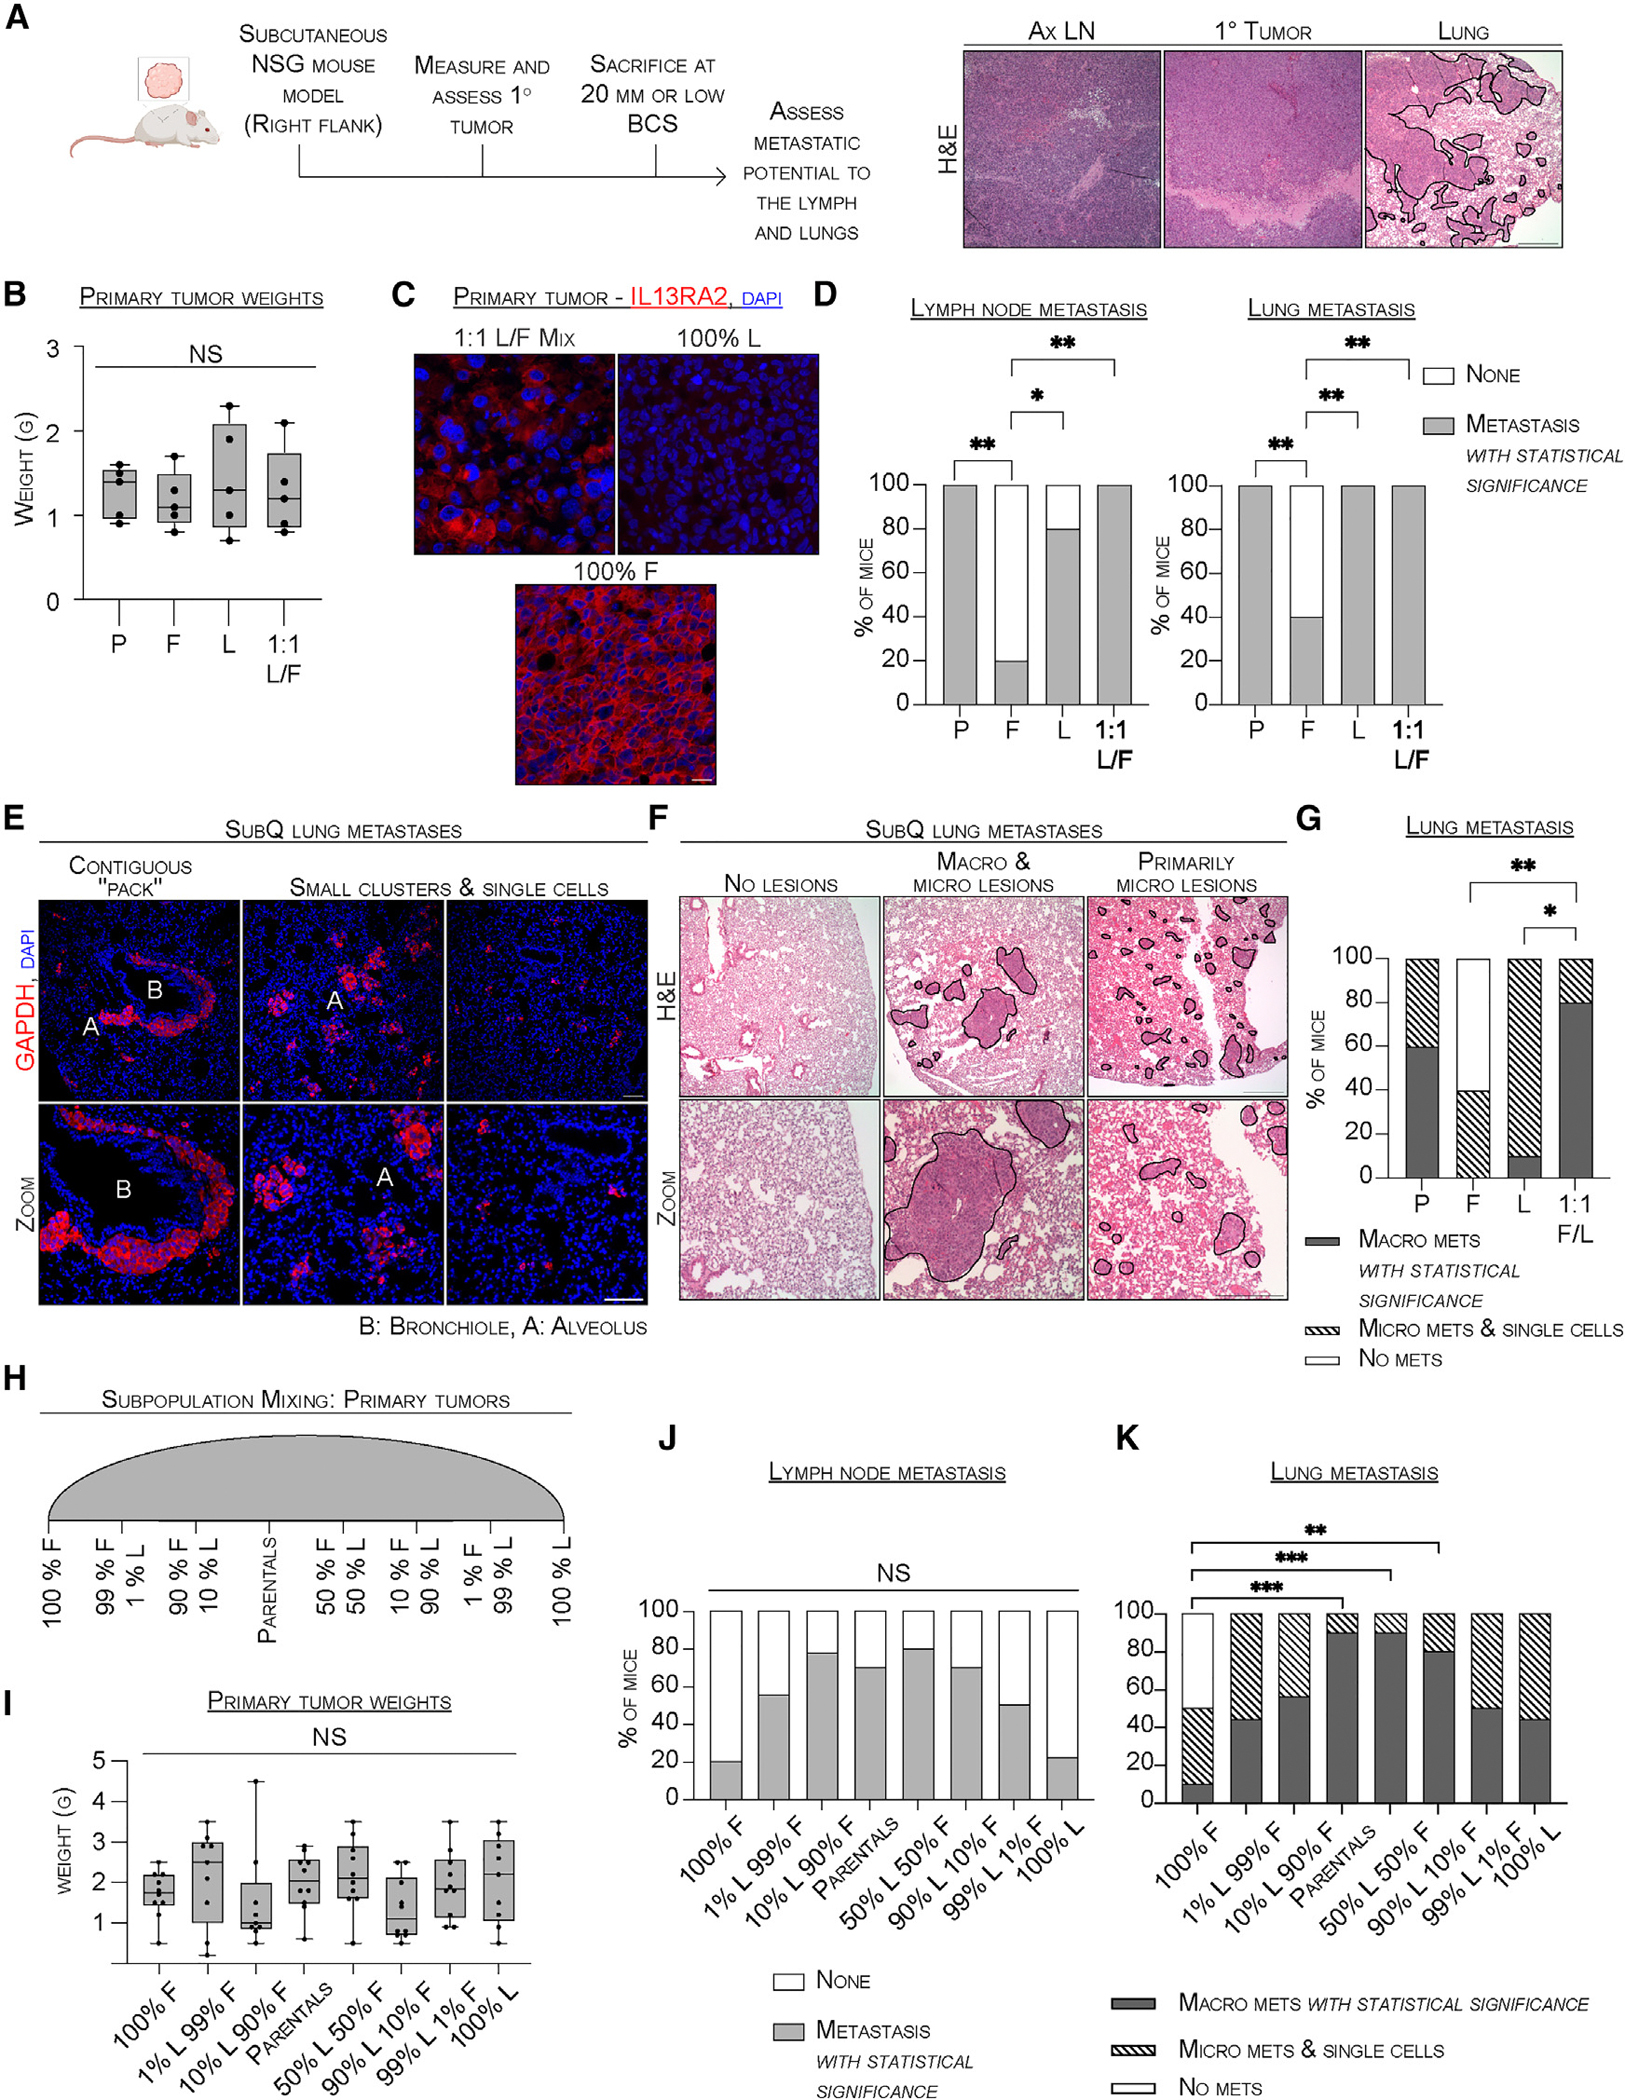
Intratumoral heterogeneity drives cancer progression and influences treatment outcomes. The mechanisms underlying how cellular subpopulations communicate and cooperate to impact progression remain largely unknown. Here, we use collective invasion as a model to deconstruct processes underlying non-small cell lung cancer subpopulation cooperation. We reveal that collectively invading packs consist of heterogeneously cycling and non-cycling subpopulations using distinct pathways. We demonstrate that the follower subpopulation secretes transforming growth factor beta one (TGF-β1) to stimulate divergent subpopulation responses-including proliferation, pack cohesion, and JAG1-dependent invasion-depending on cellular context. While isolated followers maintain proliferation in response to TGF-β1, isolated leaders enter a quiescence-like cellular state. In contrast, leaders within a heterogeneous population sustain proliferation to maintain subpopulation proportions. In vivo, both leader and follower subpopulations are necessary for macro-metastatic disease progression. Taken together, these findings highlight that intercellular communication preserves tumor cell heterogeneity and promotes collective behaviors such as invasion and tumor progression.

Keywords: CP: Cancer; cell cycle progression; collective invasion; heterogeneity; intercellular cooperation; tumor progression.


Conflict of interest statement

Declaration of interests The authors declare no competing interests with this work.

Figures

Figure 1.
Figure 1.. Single-cell SaGA enables high resolution deconstruction of cell cycle dynamics within collective invasion packs
(A) Single-cell SaGA graphical schematic. Created with BioRender.com. (B) Pie chart distribution of single cells categorized by cell cycle phase. (C) tSNE visualization of cells clustered by cell cycle phase. (D) tSNE plot showing KI67 mRNA transcript levels (fragments per kilobase of transcript per million mapped reads). (E) Bar graph showing correlation analysis using Pearson’s R coefficient. Pearson r two-tailed t test. Simple linear regression, goodness of fit r2 value. (F) Three-dimensional immunofluorescence of collective invasion packs. Phosphorylated histone H3 = pHH3. Scale bar, 50 μm; n = 2. (G) Bar graph quantifying (F). Data are represented as mean ± SEM. Ordinary two-way ANOVA, Tukey’s multiple comparisons test, with single pooled variance. n = 2, N = 6. (H) GSEA dot plot comparative analysis. See also Figure S1.
Figure 2.
Figure 2.. Follower cells produce and secrete TGF-β1 to elicit distinct responses across heterogeneous collectively invading subpopulations
(A) Mutation profile graph with rows representing a single cell classified as either a leader (L), both (B), unknown (N/A), or follower (F) cells. (B) Pie chart categorizing single cells by their mutation profile. (C) tSNE plot displaying clusters based on mutation profiles. (D) tSNE plot displaying clusters based on mRNA transcript profiles. (E) tSNE plot combining L/F and KI67 mRNA transcript status. (F) Bar chart quantifying mRNA transcript levels by cluster. Data are represented as mean ± SEM. (G) Volcano plot depicting differential leader and follower secreted factors assessed via proteomics. Blue dotted lines denote a 4-fold change, and the solid black line indicates a p value of <0.05. n = 4. (H) Dot plot integrating proteomics with scRNA-seq. Highlighted genes show a minimum of 2-fold change between leader and follower cells with a p value of <0.05. (I) Whole cell lysate (WCL) and conditioned media (CM) immunoblot analyses. n = 3. (J) Immunoblot time-course analysis with TGF-β1. n = 3. (K) 3D spheroid invasion images with and without TGF-β1. Scale bar, 500 μm, n = 3. See also Figure S2.
Figure 3.
Figure 3.. Follower-secreted TGF-β1 promotes JAG1 and beta-catenin expression to support 3D cooperative collective invasion
(A) Whole cell lysate (WCL) immunoblotting analysis treated with TGF-β1 and/or SB505124. n = 3. (B) Three-dimensional immunofluorescence imaging of collective invasion packs with and without TGF-β1. n = 2. (C) WCL immunoblot analysis treated with TGF-β1 and/or SB505124. n = 2. (D) Three-dimensional immunofluorescence imaging of collective invasion packs with and without TGF-β1. n = 2. (E) Bar graph quantifying Pearson’s R correlation analysis in (D). Data are represented as mean ± SD. n = 2, N = 6. (F) WCL immunoblot analysis with and without TGF-β1. n = 3. Low exposure (LE), high exposure (HE). (G) Bar graph quantifying flow cytometry treated with vehicle (V) or TGF-β1 (T). Data are represented as mean ± SEM. n = 3. (H) Three-dimensional spheroid invasion images with and without TGF-β1. n = 3. Scale bar, 500 μm. All statistical analysis performed using ordinary two-way ANOVA, Sidak multiple comparisons test, with single pooled variance. (B, D) Scale bar, 50 μm. See also Figures S3 and S4.
Figure 4.
Figure 4.. Leader and follower cooperation attenuates the TGF-β1-induced reduction in leader cell proliferation
(A) Whole cell lysate (WCL) immunoblot time-course analysis with TGF-β1. n = 3. (B) Line graph quantifying proliferation over time with and without TGF-β1. Data are represented as mean ± SEM. n = 3. (C) WCL immunoblot analysis using unconditioned defined media (UCM) and follower conditioned media (FCM) with and without SB505124. n = 3. (D) Bar graph quantifying intracellular flow cytometry with and without TGF-β1. Data are represented as mean ± SD. n = 3. (E) WCL immunoblot analysis treated with and without TGF-β1. n = 3. (F) Three-dimensional immunofluorescence imaging of collective invasion packs with and without TGF-β1. Scale bar, 50 μm, n = 2. (G) Bar graph quantifying the number of pHH3-positive cells in (4F). Data are represented as mean ± SEM. Ordinary two-way ANOVA, Tukey’s multiple comparisons test, with single pooled variance. n = 2, N = 5. (B, D) Ordinary two-way ANOVA, Sidak multiple comparisons test, with single pooled variance. See also Figure S4.
Figure 5.
Figure 5.. Leader and follower cellular cooperation manages stress within 2D and 3D micro-environments
(A) Whole cell lysate (WCL) immunoblot with varying media conditions. n = 3. (B) WCL immunoblot analysis with and without TGF-β1. n = 2. (C) WCL immunoblot analysis with and without TGF-β1. n = 2. (D) Three-dimensional immunofluorescence imaging of collective invasion packs with and without TGF-β1. Scale bar, 50 μm, n = 2. See also Figure S5.
Figure 6.
Figure 6.. Leaders and followers in combination enhances tumor progression and metastatic disease in vivo
(A) In vivo mouse modeling schematic and Hematoxylin and eosin (H&E) stained sections. BCS, body condition score. Scale bar, 500 μm. Created with BioRender.com. (B) Quantification of the primary tumor mass at experimental endpoint. Parental (P), leader (L), follower (F), and recombined mix (1:1 L/F). n = 5. (C) Two-dimensional immunofluorescence of tissue sections. n = 5. Scale bar, 50 μm. (D) Bar graph quantification. n = 5. (E) Two-dimensional immunofluorescence of tissue sections. n = 5. Scale bar, 100 μm. (F) Representative H&E lung metastases by lesion size. Scale bar, 500 μm. (G) Bar graph quantification. mets, metastases. n = 5. (H) Primary tumor dilution series schematic. (I) Quantification of the primary tumor mass. n = 9 or 10. (J) Bar graph quantification. n = 9 or 10. (K) Bar graph quantification. n = 9 or 10. All statistical analysis performed used ordinary two-way ANOVA, Sidak multiple comparisons test, with single pooled variance.
Figure 7.
Figure 7.. Metastatic leader-only cells display a quiescent cellular phenotype
(A) Two-dimensional immunofluorescence of tissue sections. n = 5. (B) Two-dimensional immunofluorescence of tissue sections. n = 5. (A and B) Scale bar, 100 μm. (C) Model illustrating the findings. Created with BioRender.com.

References

    1. Wu F, Fan J, He Y, Xiong A, Yu J, Li Y, Zhang Y, Zhao W, Zhou F, Li W, et al. (2021). Single-cell profiling of tumor heterogeneity and the microenvironment in advanced non-small cell lung cancer. Nat. Commun. 12, 2540. 10.1038/s41467-021-22801-0. - DOI - PMC - PubMed
    1. Jamal-Hanjani M, Wilson GA, McGranahan N, Birkbak NJ, Watkins TBK, Veeriah S, Shafi S, Johnson DH, Mitter R, Rosenthal R, et al. (2017). Tracking the Evolution of Non-Small-Cell Lung Cancer. N. Engl. J. Med. 376, 2109–2121. 10.1056/NEJMoa1616288. - DOI - PubMed
    1. Andor N, Graham TA, Jansen M, Xia LC, Aktipis CA, Petritsch C, Ji HP, and Maley CC (2016). Pan-cancer analysis of the extent and consequences of intratumor heterogeneity. Nat. Med. 22, 105–113. 10.1038/nm.3984. - DOI - PMC - PubMed
    1. Lawson DA, Kessenbrock K, Davis RT, Pervolarakis N, and Werb Z (2018). Tumour heterogeneity and metastasis at single-cell resolution. Nat. Cell Biol. 20, 1349–1360. 10.1038/s41556-018-0236-7. - DOI - PMC - PubMed
    1. Okamoto T, duVerle D, Yaginuma K, Natsume Y, Yamanaka H, Kusama D, Fukuda M, Yamamoto M, Perraudeau F, Srivastava U, et al. (2021). Comparative Analysis of Patient-Matched PDOs Revealed a Reduction in OLFM4-Associated Clusters in Metastatic Lesions in Colorectal Cancer. Stem Cell Rep. 16, 954–967. 10.1016/j.stemcr.2021.02.012. - DOI - PMC - PubMed

Substances

LinkOut - more resources