. 2025 Jun;168(6):1153-1169.
doi: 10.1053/j.gastro.2025.01.244. Epub 2025 Feb 14.

TREM2 Depletion in Pancreatic Cancer Elicits Pathogenic Inflammation and Accelerates Tumor Progression via Enriching IL-1β+ Macrophages

Affiliations

TREM2 Depletion in Pancreatic Cancer Elicits Pathogenic Inflammation and Accelerates Tumor Progression via Enriching IL-1β+ Macrophages

Daowei Yang et al. Gastroenterology. 2025 Jun.

Abstract

Background & aims: Pancreatic ductal adenocarcinoma (PDAC) has a complex tumor microenvironment enriched with tumor-associated macrophages. Triggering receptor expressed on myeloid cells 2 (TREM2) is highly expressed by a subset of macrophages in PDAC. However, the functional role of TREM2 in PDAC progression remains elusive.

Methods: We generated a novel transgenic mouse model (KPPC;Trem2-/-) that enables the genetic depletion of TREM2 in the context of spontaneous PDAC development. Single-cell RNA-sequencing analysis was used to identify changes in the tumor immune microenvironment on TREM2 depletion. We evaluated the impacts of TREM2 depletion on the tumor immune microenvironment to elucidate the functions of TREM2 in macrophages and PDAC development.

Results: Unexpectedly, genetic depletion of TREM2 significantly accelerated spontaneous PDAC progression and shortened the survival of KPPC;Trem2-/- mice. Single-cell analysis revealed that TREM2 depletion enhanced proinflammatory macrophages and exacerbated pathogenic inflammation in PDAC. Specifically, TREM2 functions as a key braking mechanism for the NLRP3/nuclear factor-κB/interleukin (IL)-1β inflammasome pathway, opposing to microbial lipopolysaccharide as the key activator of this pathway. TREM2 deficiency orchestrated with microbial lipopolysaccharide to trigger IL-1β upregulation and pathogenic inflammation, thereby fueling PDAC development. Notably, IL-1β inhibition or microbiome ablation not only reversed the accelerated PDAC progression caused by TREM2 depletion, but also further inhibited PDAC progression in the TREM2-depleted context.

Conclusions: TREM2 depletion accelerates tumor progression by enhancing proinflammatory macrophages and IL-1β-mediated pathogenic inflammation in PDAC. The accelerated tumor progression by TREM2 depletion can be reversed by blocking IL-1β-associated pathogenic inflammation.

Keywords: Genetically Engineered Mouse Models; Macrophages; Pancreatic Cancer; Single-Cell RNA-Sequencing; TREM2; Tumor Immune Microenvironment.


Conflict of interest statement

Declaration of interests

The authors declare no competing interests.

Figures
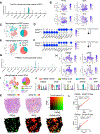
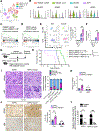
Figure 1.
Figure 1.. Expression profile of TREM2 in macrophages of human and mouse pancreatic tumors.
(A-D) Analyses on the single-cell RNA-sequencing (scRNA-seq) data of mouse primary pancreatic tumors from LSL-KrasG12D/+;Trp53loxP/loxP;Pdx1-Cre (KPPC) mice. The expression profile of Trem2 gene in various cell populations was shown in violin plot (A). The expression profiles of Trem2, Apoe, C1qa, and Il1b in macrophages were shown in UMAP plot (B). Trem2Low and Trem2High macrophage subpopulations were defined in UMAP plot (C), with signature genes shown in dot plot (D). (E and F) Analyses of mouse primary pancreatic tumors from LSL-KrasG12D/+;Trp53R172H/loxP;Ptf1a-Cre (KPC) mice based on the scRNA-seq data (GEO: GSE202651). Trem2Low and Trem2High macrophage subpopulations were defined in UMAP plot (E), with signature genes shown in dot plot (F). (G-J) Analyses on the scRNA-seq data of human pancreatic tumors (GEO: GSE229413). The expression profile of TREM2 gene in various cell populations from was shown in violin plot (G). The expression profiles of TREM2, APOE, C1QA, and IL1B in macrophages were shown in UMAP plot (H). Indicated macrophage subpopulations were defined in UMAP plot (I). Violin plot for the expression profiles of indicated genes in macrophage subpopulations was shown in (J). (K) Spatial transcriptomic profiles of TREM2 and APOE based on a recent dataset (GEO: GSE233254) of human primary pancreatic tumor samples. (L) Scatterplot illustrating the correlation between the expression levels of TREM2 and macrophage-related genes, including APOE and C1QA, based on the bulk RNA-sequencing (RNA-seq) data from pancreatic cancer patient cohort of The Cancer Genome Atlas (TCGA) database. Pearson’s correlation test was used. ****P < .0001.
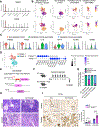
Figure 2.
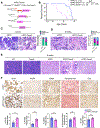
Figure 2.. TREM2 depletion accelerates spontaneous PDAC development in a novel transgenic mouse model and shortens the survival.
(A) Genetic strategy to delete Trem2 in the context of autochthonous PDAC development using the LSL-KrasG12D/+;Trp53loxP/loxP;Pdx1-Cre;Trem2−/− (KPPC;Trem2−/−) mouse model. (B) Survival of KPPC;Trem2−/− mice (n = 13), as compared to that of background-matched KPPC mice (n = 13). Survival of KPPC;Trem2−/+ mice harboring heterozygous Trem2 deletion was also shown (n = 12). Log-rank (Mantel-Cox) test was used. (C-E) Histology of pancreatic tissues from KPPC and KPPC;Trem2−/− mice at the same age of four weeks (C), six weeks (D), and eight weeks (E). Quantitative histology evaluation of tumors from KPPC (n = 5) and KPPC;Trem2−/− (n = 5) mice was shown. Pancreatic tissues from tumor-free wild-type (WT) mice, pancreatic tissues from tumor-free Trem2−/− mice, and pancreatic tumors from KPPC;Trem2−/+ mice (with heterozygous Trem2 deletion) were also examined as additional control samples in (E). Scale bar: 100 μm. (F) Representative images of immunohistochemistry staining for cytokeratin-19 (CK19), phosphorylated ERK (P-ERK), αSMA, type I collagen (Col1), and Picrosirius Red on KPPC and KPPC;Trem2−/− tumors (n = 5/group). Staining positivity quantification was shown with Student’s t test. Scale bar: 100 μm. *P < .05, **P < .01, ****P < .0001; ns: not significant.
Figure 3.
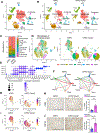
Figure 3.. scRNA-seq analysis identifies altered cell composition in TREM2-depleted pancreatic tumors.
(A-C) scRNA-seq analysis of unfractionated live cell mixture from autochthonous pancreatic tumors from KPPC mice (with 7432 total cells from 3 mice) and stage-matched KPPC;Trem2−/− mice (with 6813 total cells from 3 mice). The major cell clusters were defined in UMAP plot (A). Split view of cell composition profiles comparing KPPC tumors and KPPC;Trem2−/− tumors was shown in UMAP plot (B). cDC, classical dendritic cell; pDC, plasmacytoid dendritic cell. The relative abundance (%) of indicated cell populations in KPPC tumors and KPPC;Trem2−/− tumors was compared in (C). (D) UMAP showing cell compositions of indicated macrophage subpopulations (left). Split view of macrophage subtype compositions comparing KPPC tumors and KPPC;Trem2−/− tumors was shown in UMAP plot (right). The relative abundance of various macrophage subtypes was shown in pie chart plot. (E) The signature genes of defined macrophage subpopulations were shown in dot plot. (F) The cell-cell interaction networks among indicated macrophage subpopulations in KPPC and KPPC;Trem2−/− tumors, shown as intensity of interactions based on the “CellChat” algorithm. Dot size represented the cell number of indicated cell subpopulation. (G) UMAP showing Adgre1 (encoding F4/80) expression in macrophages from KPPC and KPPC;Trem2−/− tumors. (H) Representative images of immunohistochemistry staining for F4/80 in KPPC and KPPC;Trem2−/− tumors (n = 5/group). Staining positivity quantification was shown with Student’s t test. Scale bar: 100 μm. (I) UMAP showing Csf1r (encoding CSF1R) expression in macrophages from KPPC and KPPC;Trem2−/− tumors. (J) Representative images of immunohistochemistry staining for CSF1R in KPPC and KPPC;Trem2−/− tumors (n = 5/group). Staining positivity quantification was also shown with Student’s t test. Scale bar: 100 μm. **P < .01.
Figure 4.
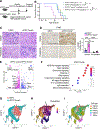
Figure 4.. TREM2 depletion enhances the accumulation of macrophages with pro-inflammatory phenotypes, which can be reversed by CSF1R inhibition.
(A) Schematic of CSF1R inhibitor (CSF1Ri) Pexidartinib treatment in KPPC and KPPC;Trem2−/− mice. Indicated treatments started in stage-matched KPPC and KPPC;Trem2−/− mice with palpable tumors (n = 5/group). (B) Survival of KPPC and KPPC;Trem2−/− mice with indicated treatments in (A). Log-rank (Mantel-Cox) test was used. (C and D) Representative images of H&E staining (C) and F4/80 immunohistochemistry (D) staining on endpoint pancreatic tumors from vehicle- or Pexidartinib-treated KPPC and KPPC;Trem2−/− mice (n = 5/group). Staining positivity quantification was also shown with one-way ANOVA with Tukey’s multiple comparisons test (D). Scale bar: 100 μm. (E) Volcano plot showing differentially expressed genes in macrophages between KPPC and KPPC;Trem2−/− tumors, based on scRNA-seq data. (F) KEGG analysis of top enriched gene pathways in macrophages of KPPC;Trem2−/− tumors, as compared to macrophages of KPPC tumors. (G-I) Pseudo-time trajectory of macrophages from KPPC and KPPC;Trem2−/− tumors, as plotted by the Monocle 3 inference analysis. The UMAP distributions of macrophages from KPPC and KPPC;Trem2−/− groups were compared in (G). The pseudo-time trajectory (H) and distribution of indicated macrophage subpopulations (I) were also shown. **P < .01, ***P < .001, ****P < .0001.
Figure 5.
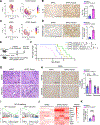
Figure 5.. TREM2 depletion upregulates IL-1β pro-inflammatory pathway in macrophages, which can be reversed by IL-1β inhibitor treatment.
(A) UMAP showing Il1b (encoding IL-1β) expression in macrophages of KPPC and KPPC;Trem2−/− tumors. (B) Representative images of immunohistochemistry staining for IL-1β in KPPC and KPPC;Trem2−/− tumors (n = 5/group). Staining positivity quantification was shown with Student’s t test. Scale bar: 100 μm. (C) UMAP showing Casp1 (encoding Caspase-1) expression in macrophages of KPPC and KPPC;Trem2−/− tumors. (D) Representative images of immunohistochemistry staining for Cleaved Caspase-1 in KPPC and KPPC;Trem2−/− tumors (n = 5/group). Staining positivity quantification was shown with Student’s t test. Scale bar: 100 μm. (E) Schematic of IL-1β inhibitor (IL-1βi) Diacerein treatment in KPPC and KPPC;Trem2−/− mice. Indicated treatments started in stage-matched KPPC and KPPC;Trem2−/− mice with palpable tumors (n = 7/group). (F) Survival of KPPC and KPPC;Trem2−/− mice treated with or without IL-1β inhibitor Diacerein (n = 7/group). Log-rank (Mantel-Cox) test was used. (G and H) Representative images of H&E staining (G) and F4/80 immunohistochemistry staining (H) on tumor sections from vehicle- or Diacerein-treated KPPC and KPPC;Trem2−/− mice at endpoint. Staining positivity quantification was shown with one-way ANOVA with Tukey’s multiple comparisons test (H). Scale bar: 100 μm. (I) Gene set enrichment analysis (GSEA) analysis showing upregulation of NF-κB pathway genes in macrophages of KPPC;Trem2−/− tumors. (J and K) qRT-PCR analysis of NOD-like receptor (NLR) pathway genes in KPPC and KPPC;Trem2−/− tumors, as shown in heatmap plot (J) or normalized bar graph (K). Student’s t test was used. **P < .01, ***P < .001, ****P < .0001.
Figure 6.
Figure 6.. TREM2 depletion orchestrates with microbial lipopolysaccharide (LPS) to ignite NLRP3/IL-1β inflammatory pathway, which can be reversed by antibiotics treatment.
(A-C) Analysis on scRNA-seq data of macrophages from human pancreatic tumors (GEO: GSE229413). Cell compositions of indicated macrophage subpopulations were shown in UMAP plot (A). The expression profiles of indicated genes were shown in violin plot (B). GSEA analysis revealed the upregulation of inflammatory response pathway genes in TREM2-IL1B+ macrophage subpopulation as compared with TREM2+APOE+ subpopulation (C). (D) GSEA analysis identified the upregulation of inflammatory response pathway genes in macrophages of KPPC;Trem2−/− tumors, as compared to macrophages of KPPC tumors. (E) Enhanced activation of IL-1β+CD11b+ bone marrow-derived macrophages (BMDMs) from Trem2−/− mice as compared to BMDMs from WT mice, as measured by the percentage of emerging IL-1β+CD11b+ macrophages after stimulation with LPS at 20 ng/mL for three hours (n = 4 biological replicates). Significance was determined by one-way ANOVA with Tukey’s multiple comparisons test. (F) qRT-PCR analysis of Il1b in the total mRNA samples from WT and Trem2−/− BMDMs treated with or without LPS at 20 ng/mL for four hours (n = 3 biological replicates). Significance was determined by one-way ANOVA with Tukey’s multiple comparisons test. (G) Schematic representation of broad-spectrum antibiotics (ABX) treatment in KPPC and KPPC;Trem2−/− mice. Indicated treatments started in stage-matched KPPC and KPPC;Trem2−/− mice with palpable tumors (n = 5/group). (H) Survival of KPPC and KPPC;Trem2−/− mice treated with or without ABX (n = 5/group) from (G). Log-rank (Mantel-Cox) test was used. (I) Representative images of H&E staining on endpoint tumors from KPPC and KPPC;Trem2−/− mice treated with or without ABX. Quantitative histology analysis of each group was plotted in bar graph (n = 5/group). Scale bar: 100 μm. (J) Representative images of immunohistochemistry staining for IL-1β in KPPC and KPPC;Trem2−/− tumors treated with or without ABX from (G). Staining positivity quantification was also shown with Student’s t test (n = 5/group). Scale bar: 100 μm. (K) qRT-PCR analysis of Il1b in the total mRNA samples from KPPC and KPPC;Trem2−/− tumors treated with or without ABX from (G) (n = 5/group). Student’s t test was used. (L) qRT-PCR analysis of total bacterial 16S DNA gene expression in fecal samples collected from KPPC and KPPC;Trem2−/− mice treated with vehicle control or ABX (n = 5/group). The number of 16S DNA copies was normalized to the number of mouse genomic DNA copies. The values of vehicle-treated groups were used to normalize the value of ABX-treated groups. Student’s t test was used. *P < .05, **P < .01, ***P < .001, ****P < .0001; ns: not significant.
Figure 7.
Figure 7.. TREM2 deficiency is associated with aggravated pancreatitis and inflammation-induced PDAC development.
(A-D) Analysis of a recently published scRNA-seq dataset of human chronic pancreatitis and non-diseased pancreatic tissues (GEO: GSE165045). Violin plot for the expression profiles of TREM2 and APOE in various cell populations was shown in (A). Expression profiles of TREM2 and IL1B in macrophages, compared across non-diseased control, hereditary chronic pancreatitis, and idiopathic chronic pancreatitis groups, were shown in UMAP plot (B) and violin plot (C). TREM2High and TREM2Low macrophage subpopulations were defined in UMAP plot, with indicated signature gene expression profiles shown in dot plot (D). (E) Genetic strategy to genetically deplete Trem2 in the context of KrasG12D-driven autochthonous disease development using the LSL-KrasG12D/+;Pdx1-Cre;Trem2−/− (KC;Trem2−/−) mouse model. (F) Schematic representation of pancreatitis induction in KC and KC;Trem2−/− mice at the age of 10 weeks (n = 5/group). Each arrow indicates two intraperitoneal injections of Cerulein at a 4-hour interval (50 μg/kg) on each indicated day. (G-I) Quantitative histology evaluation (G), representative H&E staining images (H), and representative CK19 immunohistochemistry staining images (I) on the pancreatic tissues of KC and KC;Trem2−/− mice treated with or without Cerulein as shown in (F). CK19 staining positivity quantification was shown with Student’s t test. Scale bar: 100 μm. ***P < .001; ns: not significant.

References

    1. Ho WJ, Jaffee EM, Zheng L. The tumour microenvironment in pancreatic cancer - clinical challenges and opportunities. Nat Rev Clin Oncol 2020;17:527–540. - PMC - PubMed
    1. Chen Y, Kim J, Yang S, et al. Type I collagen deletion in alphaSMA(+) myofibroblasts augments immune suppression and accelerates progression of pancreatic cancer. Cancer Cell 2021;39:548–565 e6. - PMC - PubMed
    1. Chen Y, Yang S, Tavormina J, et al. Oncogenic collagen I homotrimers from cancer cells bind to alpha3beta1 integrin and impact tumor microbiome and immunity to promote pancreatic cancer. Cancer Cell 2022. - PMC - PubMed
    1. McAndrews KM, Chen Y, Darpolor JK, et al. Identification of Functional Heterogeneity of Carcinoma-Associated Fibroblasts with Distinct IL6-Mediated Therapy Resistance in Pancreatic Cancer. Cancer Discov 2022;12:1580–1597. - PMC - PubMed
    1. Chen Y, McAndrews KM, Kalluri R. Clinical and therapeutic relevance of cancer-associated fibroblasts. Nat Rev Clin Oncol 2021;18:792–804. - PMC - PubMed

MeSH terms

LinkOut - more resources