Review
. 2025 Aug;78(4):301-314.
doi: 10.4097/kja.25001. Epub 2025 Feb 14.

Heterogeneity in meta-analyses: an unavoidable challenge worth exploring

Affiliations
Review

Heterogeneity in meta-analyses: an unavoidable challenge worth exploring

Geun Joo Choi et al. Korean J Anesthesiol. 2025 Aug.

Abstract

Heterogeneity is a critical but unavoidable aspect of meta-analyses that reflects differences in study outcomes beyond what is expected by chance. These variations arise from differences in the study populations, interventions, methodologies, and measurement tools and can influence key meta-analytical outputs, including pooled effect sizes, confidence intervals, and overall conclusions. Systematic reviews and meta-analyses combine evidence from diverse studies; thus, a clear understanding of heterogeneity is necessary for reliable and meaningful interpretations of the results. This review examines the concepts, sources, measurement techniques, and implications of this heterogeneity. Statistical tools (e.g., Cochran's Q, I2, and τ2) quantify heterogeneity, whereas τ and prediction intervals, as they use the same units, aid in the intuitive understanding of heterogeneity. The choice between fixed- and random-effects models can also significantly affect the handling and interpretation of heterogeneity in meta-analyses. Effective management strategies include subgroup analyses, sensitivity analyses, and meta-regressions, which identify sources of variability and strengthen the robustness of the findings. Although heterogeneity complicates the synthesis of a single effect size, it offers valuable insights into patterns and differences among studies. Recognizing and understanding heterogeneity is vital for accurately synthesizing the evidence, which can indicate whether an intervention has consistent effects, benefits, or harms. Rather than viewing heterogeneity as inherently good or bad, researchers and clinicians should consider it a key component of systematic reviews and meta-analyses, allowing for a deeper understanding and more nuanced application of pooled findings. Addressing heterogeneity ultimately enhances the reliability, applicability, and overall impact of the conclusions of meta-analyses.

Keywords: Bias; Biostatistics; Epidemiology; Evidence-based medicine; Heterogeneity; Meta-analysis as topic; Systematic Review..


Conflict of interest statement

Conflicts of Interest

Geun Joo Choi has been an editor for the Korean Journal of Anesthesiology since 2020 and Hyun Kang has been an statistical rounds board of KJA since 2013. However, they were not involved in any process of review for this article, including peer reviewer selection, evaluation, or decision-making. There were no other potential conflicts of interest relevant to this article.

Figures
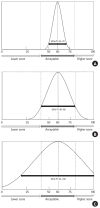
Fig. 1.
Fig. 1.
Normal distribution curves illustrating how prediction intervals (PIs) widen with increasing heterogeneity at the primary study level. All curves have the same mean, but increasing standard deviations (SDs) from A to C reflect greater variability in individual outcomes within a single study. (A) Mean score = 60, SD = 5 (narrow prediction interval). (B) Mean score = 60, SD = 10 (moderate prediction interval). (C) Mean score = 60, SD = 20 (wide prediction interval).
Fig. 2.
Fig. 2.
Normal distribution curves illustrating how prediction intervals (PIs) widen with increasing heterogeneity at the meta-analysis level. All curves share the same mean standardized mean difference (SMD = −2), but increasing standard deviations (SDs) from A to C represent greater variability in effect sizes across studies. (A) Mean SMD = −2 , SD = 0.1 (narrow prediction interval). (B) Mean SMD = −2 , SD = 0.4 (moderate prediction interval). (C) Mean SMD = −2 , SD = 0.8 (wide prediction interval).
Fig. 3.
Fig. 3.
Effects of heterogeneity on standard errors and confidence intervals. Forest plots of five studies with the same standard deviation (SD = 1) and sample size (n = 10), resulting in equal 95% CI widths. Fig. 3A–C use fixed-effects models, and Fig. 3D–F use random-effects models. The pooled mean is constant (1.000), but the 95% CI becomes wider as heterogeneity increases under the random-effects model. (A) Fixed-effects; no heterogeneity (all means = 1.0). (B) Fixed-effects; moderate heterogeneity (means vary by 0.5). (C) Fixed-effects; high heterogeneity (means vary by 1.0). (D) Random-effects; no heterogeneity (same as A). (E) Random-effects; moderate heterogeneity (same data as B). (F) Random-effects; high heterogeneity (same data as C).
Fig. 4.
Fig. 4.
Forest plots showing how heterogeneity affects the pooled mean effect size in meta-analyses. Five studies with increasing means (−1 to 3) and increasing sample sizes (10 to 50) are analyzed. (A) Fixed-effects model. The pooled mean (1.667) is strongly influenced by larger studies. (B) Random-effects model. The pooled mean (1.018) reflects more balanced weighting due to between-study heterogeneity.
Fig. 5.
Fig. 5.
Schematic diagrams illustrating how I2 represents the proportion of true effect variance to observed variance. In Figures A and B, the observed variances are the same, so differences in I2 reflect differences in true effect variance. In Figures C and D, the observed variances differ, so I2 does not indicate the actual extent of heterogeneity. (A) I2 = 75%; large true effect variance with the same observed variance as in B. (B) I2 = 25%; small true effect variance with the same observed variance as in A. (C) I2 = 40%; moderate true effect variance with more observed variance than in D. (D) I2 = 80%; small true effect variance with less observed variance than in C.
Fig. 6.
Fig. 6.
L’Abbé plot comparing the odds of postoperative nausea and vomiting between the palonosetron and ramosetron groups. Each circle represents an individual study, with size reflecting its precision. The solid diagonal line (X = Y) indicates equal odds between groups. The dashed trend line lies above the diagonal, indicating a tendency toward lower odds in the palonosetron group.
Fig. 7.
Fig. 7.
Galbraith plot for assessing heterogeneity. Each point represents a study, with the standardized effect size on the Y-axis and the reciprocal of its standard error on the X-axis. The shaded area indicates the ±2 range around the regression line. The right-hand axis shows the corresponding unstandardized effect sizes.

References

    1. Kang H. Use, application, and interpretation of systematic reviews and meta-analyses. Korean J Anesthesiol. 2021;74:369–70. doi: 10.4097/kja.21374. - DOI - PMC - PubMed
    1. Ahn E, Kang H. Introduction to systematic review and meta-analysis. Korean J Anesthesiol. 2018;71:103–12. doi: 10.4097/kjae.2018.71.2.103. - DOI - PMC - PubMed
    1. Choi GJ, Kang H. Introduction to umbrella reviews as a useful evidence-based practice. J Lipid Atheroscler. 2023;12:3–11. doi: 10.12997/jla.2023.12.1.3. - DOI - PMC - PubMed
    1. Kang H. Trial sequential analysis: novel approach for meta-analysis. Anesth Pain Med (Seoul) 2021;16:138–50. doi: 10.17085/apm.21038. - DOI - PMC - PubMed
    1. Ahn E, Kang H. Concepts and emerging issues of network meta-analysis. Korean J Anesthesiol. 2021;74:371–82. doi: 10.4097/kja.21358. - DOI - PMC - PubMed

LinkOut - more resources