. 2025 Feb 16;16(1):1681.
doi: 10.1038/s41467-025-56916-5.

A multiparametric anti-aging CRISPR screen uncovers a role for BAF in protein synthesis regulation

Affiliations

A multiparametric anti-aging CRISPR screen uncovers a role for BAF in protein synthesis regulation

Sophia Y Breusegem et al. Nat Commun. .

Abstract

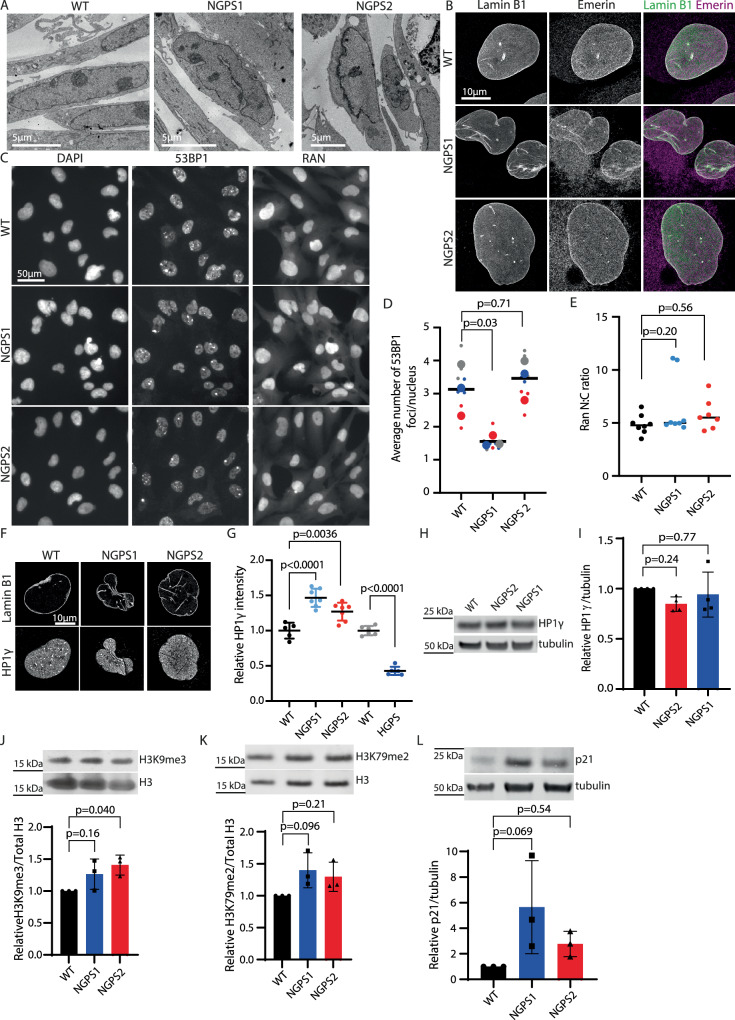
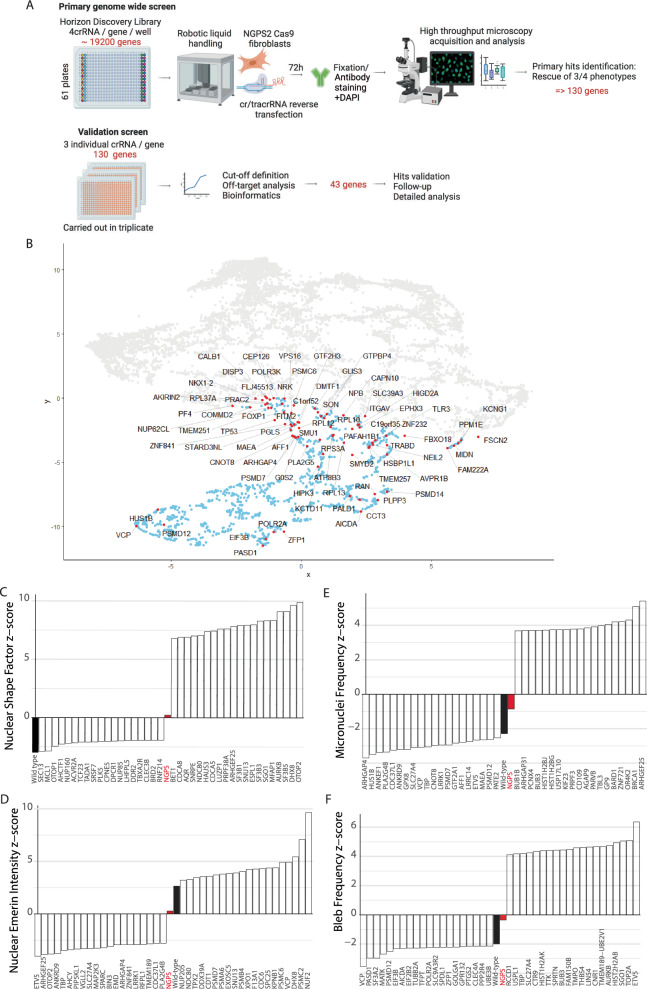
Progeria syndromes are very rare, incurable premature aging conditions recapitulating most aging features. Here, we report a whole genome, multiparametric CRISPR screen, identifying 43 genes that can rescue multiple cellular phenotypes associated with progeria. We implement the screen in fibroblasts from Néstor-Guillermo Progeria Syndrome male patients, carrying a homozygous A12T mutation in BAF. The hits are enriched for genes involved in protein synthesis, protein and RNA transport and osteoclast formation and are validated in a whole-organism Caenorhabditis elegans model. We further confirm that BAF A12T can disrupt protein synthesis rate and fidelity, which could contribute to premature aging in patients. This work highlights the power of multiparametric genome-wide suppressor screens to identify genes enhancing cellular resilience in premature aging and provide insights into the biology underlying progeria-associated cellular dysfunction.


Conflict of interest statement

Competing interests: D.L. is an employee of Altos Labs. J.R.B.P. is an employee/shareholder of Insmed. J.R.B.P. also receives research funding from GSK and consultancy fees from WW International. The other authors declare that they have no competing interests.

Figures

Fig. 1
Fig. 1. NGPS fibroblasts show distinctive phenotypes to HGPS.
A Representative transmission electron micrographs of WT, NGPS1 and NGPS2 fibroblasts (males). B Representative high resolution microscopy images showing the expression and localization of lamin B1 and emerin in WT and NGPS fibroblasts. C Immunofluorescence images showing DNA damage foci (53BP1) and nucleocytoplasmic transport (Ran) in WT and NGPS fibroblasts. Images were obtained with the CX7 high-content microscope and quantified in (D) and (E) using the HCS StudioTM software. D Superplot of the data (3 technical replicates in 3 independent experiments), lines indicate average values, statistical analysis using nested one-way ANOVA with Dunnett’s multiple comparisons. E Data from 3 independent experiments, 2-3 technical replicates each, lines indicate average values, statistical comparison using one-way ANOVA with Dunnett’s multiple comparisons. F High resolution microscopy images of the heterochromatin marker HP1γ in WT and NGPS cells. G Nuclear HP1γ levels quantified using the high-content microscope in 2 independent experiments, each averaging 500 nuclei in 3 wells. Means ± SD are shown. For the NGPS cells statistical testing used one-way ANOVA with Dunnett’s multiple comparisons; HGPS cells were compared to WT using two-tailed unpaired t-test. H Representative Western blot and (I) quantitative analysis of 4 independent experiments showing HP1γ in NGPS cells compared to WT. JL Representative western blots and quantitative analysis of 3 independent experiments, showing the heterochromatin marks H3K9me3 (J) and H3K79me2 (K) or the aging and senescence marker p21 (L) in NGPS cells compared to WT. In IL data points are overlaid on columns indicating the mean +/- SD, and statistical analysis used one-way ANOVA with Dunnett’s multiple comparisons.
Fig. 2
Fig. 2. Whole genome CRISPR screening set-up in NGPS fibroblasts.
A Schematic detailing the four main steps involved in the CRISPR screen set-up (Created in BioRender. Larrieu, D. (2024) BioRender.com/e32i842). B Example immunofluorescence images of the indicated stainings used in the screen and obtained with the high-content microscope. C Quantification of the nucleus to cytoplasmic (N:C) emerin intensity ratio in WT and NGPS2 cells. D Quantification of the nuclear shape in WT and NGPS2 cells using a perimeter to area (P2A) analysis obtained with HCS Studio. Each data point in (C) and (D) is the average value measured over 500 cells, in 7 independent experiments; lines indicate the average ± SD and unpaired two-tailed t-tests were used for statistical analysis. E Graphical representation and corresponding immunofluorescence images showing the identification of blebs as the origin of NE ruptures using a nuclear localization signal (NLS) reporter tagged with a GFP. F, G Representative nuclei imaged with the CX7 microscope, showing the outlines of the nuclei in blue, and the nuclear blebs (F) or micronuclei (G) in yellow as detected by the HCS software and quantified (as in C and D) in (H and I). Each data point in (H) and (I) is the average value measured over 500 cells, in 7 independent experiments; lines indicate the average ± SD and unpaired two-tailed t-tests were used for statistical analysis (J) Knock down efficiency of individual or pooled crRNAs assessed in the clonal population of Cas9-expressing WT and NGPS cells. crRNAs targeting SIRT7 (top 2 blots) or HDAC6 (bottom 3 blots) were used, either as single sequences (#1, #2) or as a pool of the 2 sequences. K Representative immunofluorescence images of emerin intensity in NGPS1-Cas9 cells upon transfection of a pool of 3 crRNAs or sgRNAs and quantified in 2 independent experiments using the HCS image studio software (right panel). L Comparison of cell growth inhibition upon transfection of the indicated sgRNA or crRNA in NGPS1-Cas9 cells. The growth rate was measured using an Incucyte S3 live-cell analysis system in 2 independent experiments. The data shows the representative cell growth from 4 images/well, (average ± SD indicated by lines).
Fig. 3
Fig. 3. Identification of genes and pathways modulating NGPS phenotypes.
A Schematic showing the experimental outline of the primary and validation screens in NGPS2-Cas9 fibroblasts (Created in BioRender. Larrieu, D. (2024) BioRender.com/e32i842). B Uniform Manifold Approximation and Projection (UMAP) of the cluster analysis from the primary screen. Nuclear shape, micronuclei and NE blebs frequency quantified in NGPS2-Cas9 cells (gray dots) for each single knock-out were reduced to two dimensions and mapped alongside the same parameters measured in matching control cells (blue dots). The hit genes are labeled in red. CF S plots depicting the top 20 genes with the highest and lowest Z scores for each individual phenotype quantified from the NGPS genome-wide CRISPR screen alongside the mean value obtained for the NGPS cells (red bars) and the wild type cells (black bars) transfected with a non-targeting crRNA.
Fig. 4
Fig. 4. Validation of hits normalizing multiple nuclear envelope phenotypes in NGPS cells.
AB Biological processes gene set enrichment was carried out using the clusterProfiler R package. P values were calculated through clusterProfiling using a hypergeometric distribution which corresponds to a one-sided version of Fisher’s exact test. No corrections for multiple comparisons were applied. The 43 validated genes were tested against a full homo sapiens ontology database. C Representative immunofluorescence images obtained in the validation screen, showing the effects of some of the hits on the nuclear envelope phenotypes. D Heatmap showing the overlap between identified target genes and human genetic datasets. For all four phenotypic traits (BMI (n = 806,834), WHR (n = 694,649), triglycerides (n = 1,253,275) and eBMD, (n = 426,824)), target genes were annotated on the basis of (i) proximity to GWAS signals, (ii) coding-variant gene-level associations to the trait (MAGMA), (iii) colocalization between the GWAS and eQTL data and (iv) the presence of known enhancers within the association peaks. A count of the observed concordant predictors (out of a maximum of 16) is displayed in Summary (right panel). Expanded results can be found in Supplementary Data 8.
Fig. 5
Fig. 5. BAF A12T is associated with enhanced protein synthesis and translation errors.
AB Differential gene expression analysis in wild-type compared to NGPS1 and NGPS2 cell lines reveals enrichment for biological processes associated with RNA processing and translation. P-values were adjusted for multiple testing via the False Discovery Rate (FDR; Benjamini-Hochberg) approach. Gene Ontology Analysis was performed on genes with a False Discovery Rate value less than 0.01. C Nascent protein synthesis assay using HPG incorporation followed by labeling using a “click” reaction with Alexa fluor 488 (AF 488) in WT, NGPS2 or NGPS2 corrected (C) or in WT fibroblasts expressing a BAF WT or BAF A12T construct (D). AF 488-HPG intensity was quantified using the high-content microscope in 4 (C) or 3 (D) independent experiments, each measuring 1000 cells in 3 wells per cell line, graphed as a Superplot with data from different experiments indicated in different colors and larger symbols indicating each experiment’s average. AF 488-HPG intensity was normalized to the WT cell line. Mean values were analyzed using nested one-way ANOVA (C) or paired two-tailed t-test (D), with Tukey’s method used for multiple comparisons in (C). E Immunofluorescence images of nucleolin used to identify and outline the nucleoli (yellow) in the indicated cell lines using the HCS Studio software. FG Average nucleolar area quantified in NGPS2 and NGPS2 corrected cells (F) or in WT fibroblasts expressing BAF WT or BAF A12T (G). F and (G) are superplots as in (CD), and statistical comparisons were made using paired two-tailed t-tests. H Translation error rate measured as an increased read-through using a dual luciferase assay in 3 independent repeats (Superplot of the data). Mean values were analyzed using one-way ANOVA with Dunnett’s multiple comparison testing. Results are derived from the ratio hFluc/hRluc, given in fold induction.
Fig. 6
Fig. 6. Inhibition of protein synthesis restores nuclear envelope abnormalities in NGPS cells.
A Nascent protein synthesis assay based on fluorescence intensity of HPG AF 488. NGPS2 or NGPS2 corrected cells (NGPS WT) were imaged with the high throughput microscope following siRNA depletion of 41 of the validated screen hits. Depletion of genes highlighted in blue show significant (one-way ANOVA with Dunnett’s multiple comparisons test, p < 0.05) reduction of HPG incorporation compared to NGPS2 cells transfected with a non-targeting siRNA (red dotted line). Shown are averages ± SD of 3 independent experiments in 500 cells. B Quantification of emerin nuclear intensity in NGPS1 and NGPS2 cell lines compared to WT, upon protein synthesis inhibition using cycloheximide (CHX) or silvestrol. Superplots of the 3 independent experiments are shown, and nested one-way ANOVA was used for statistical comparisons with Dunnett’s multiple comparison testing. C Representative immunofluorescence images of emerin staining upon protein synthesis inhibition by treatment with CHX or silvestrol.
Fig. 7
Fig. 7. Depletion of PAFAH1B1, RPS3A, SMU1 and VPS16 suppress the larvae lethality of an NGPS hermaphrodite C. elegans model.
A Confocal images of hypodermal nuclei of live wild-type (WT; strain COP262) and NGPS (G12T; strain BN1389) 1 day old adult hermaphrodites C. elegans expressing FIB-1::GFP. Shown are overlays of GFP (green) and DIC images. Scale bar 5 um. B Nucleolar area was measured in 124 nucleoli for the WT worms and 146 nucleoli for the baf-1(G12T), representing > 20 animals per strain over 4 independent experiments. Black lines show the average nucleolar area ± SD. The p-value from Welch two sample t-test is indicated. C The indicated genes were knocked down by RNAi and tested for suppression of lethality in gfp::lmn-1, baf-1(G12T) hermaphrodites (strain BN1336). Each point corresponds to the percentage of eggs developing into larvae from a single plate with 50-100 eggs laid by 1 day old adult hermaphrodites. For PAFAH1B1, 9 plates were analyzed for both the control and PAFAH1B1, over 3 independent experiments. For RPS3A, 15 control plates and 14 RPS3A plates were analyzed over 4 independent experiments. For SMU1, 14 control and 16 SMU-1 plates were analyzed over 5 independent experiments. For VPS16, 12 controls and 11 VPS16 plates were analyzed over 4 independent experiments. Black lines indicate medians. Mann-Whitney test p-values were calculated for each set of control and test plates.

References

    1. De Sandre-Giovannoli, A. et al. Lamin a truncation in Hutchinson-Gilford progeria. Science300, 2055 (2003). - PubMed
    1. Eriksson, M. et al. Recurrent de novo point mutations in lamin A cause Hutchinson-Gilford progeria syndrome. Nature423, 293–298 (2003). - PMC - PubMed
    1. Cabanillas, R. et al. Nestor-Guillermo progeria syndrome: a novel premature aging condition with early onset and chronic development caused by BANF1 mutations. Am. J. Med Genet A155A, 2617–2625 (2011). - PubMed
    1. Puente, X. S. et al. Exome sequencing and functional analysis identifies BANF1 mutation as the cause of a hereditary progeroid syndrome. Am. J. Hum. Genet88, 650–656 (2011). - PMC - PubMed
    1. Bradley, C. M., Ronning, D. R., Ghirlando, R., Craigie, R. & Dyda, F. Structural basis for DNA bridging by barrier-to-autointegration factor. Nat. Struct. Mol. Biol.12, 935–936 (2005). - PubMed