. 2025 May;44(18):1272-1283.
doi: 10.1038/s41388-025-03297-0. Epub 2025 Feb 16.

GDP-mannose 4,6-dehydratase is a key driver of MYCN-amplified neuroblastoma core fucosylation and tumorigenesis

Affiliations

GDP-mannose 4,6-dehydratase is a key driver of MYCN-amplified neuroblastoma core fucosylation and tumorigenesis

Beibei Zhu et al. Oncogene. 2025 May.

Abstract

MYCN-amplification is a genetic hallmark of ~40% of high-risk neuroblastomas (NBs). Altered glycosylation is a common feature of adult cancer progression, but little is known about how genetic signatures such as MYCN-amplification alter glycosylation profiles. Herein, matrix-assisted laser desorption/ionization mass spectrometry imaging (MALDI-MSI) revealed increased core fucosylated glycan abundance within neuroblast-rich regions of human MYCN-amplified NB tumors. GDP-mannose 4,6-dehydratase (GMDS) is responsible for the first-committed and rate-limiting step of de novo GDP-fucose synthesis. High GMDS expression was found to be associated with poor patient survival, advanced stage disease, and MYCN-amplification in human NB tumors. Chromatin immunoprecipitation and promoter reporter assays demonstrated that N-MYC directly binds and activates the GMDS promoter in NB cells. When GMDS was blocked through either genetic or pharmacological mechanisms, NBs were found to be dependent upon de novo GDP-fucose production to sustain cell surface and secreted core fucosylated glycan abundance, as well as adherence and motility. Moreover, genetic knockdown of GMDS inhibited tumor formation and progression in vivo. These critical findings identify de novo GDP-fucose production as a novel metabolic vulnerability that may be exploited in designing new treatment strategies for MYCN-amplified NBs.


Conflict of interest statement

Competing interests: The authors declare no competing interests. Ethics approval and consent to participate: All methods were performed in accordance with the relevant guidelines and regulations. Animal studies were performed with approval from the University of Kentucky IACUC (2021-3934). Human studies were performed under approval of the University of Kentucky Institutional Review Board (75968). Informed consent was obtained from all participants.

Figures

Fig. 1
Fig. 1. MALDI-MSI workflow.
De-identified FFPE human NB tumors were sectioned at 4 µM. Adjacent slides underwent MALDI-MSI protocol and H&E staining. PNGase F application mediated enzymatic release into an α-Cyano-4-hydroxycinnamic acid (CHCA) matrix. MALDI-MSI was performed on a timsTOF fleX. H&E and acquired spectra were overlaid in SCiLSTM Lab.
Fig. 2
Fig. 2. Core fucosylated and complex N-linked glycans are enriched within neuroblast-rich regions of human MYCN-amplified NB tumors.
A Representative spectra for Hex6dHex1HexNAc5 (m/z 2174) with MYCN-amplified (left panel) and MYCN non-amplified (right panel) human NB tumors. Relative ion count is represented from blue (low) to yellow (high). Regions of interest were histologically annotated to identify neuroblast-rich regions within tumor specimens demonstrated in the upper panel inserts. B Heatmap for the top 25 differentially expressed N-linked glycans. Statistically significant N-linked glycans are highlighted in bold with an *. C Fold change analysis reveals eight unique N-linked glycans with log2 fold change >1. D Significance analysis of microarrays revealed 20 significant N-linked glycans with q values < 0.05. E Total abundance of core fucosylated N-linked glycans compared between MYCN-amplified and MYCN non-amplified human NB samples were calculated by summation of the total ion counts (TIC) and compared using an unpaired t test (p < 0.01).
Fig. 3
Fig. 3. High GMDS expression is associated with poor patient survival, stage of disease, and MYCN-amplification in human NB tumors.
A, D Kaplan–Meier analysis of the Kocak (upper panels) and SEQC (lower panels) databases was performed using the scanning features with Bonferroni correction. B, E GMDS expression is increased in Stage 4 NBs. One-way ANOVA was performed with Tukey correction. C, F GMDS expression was enriched in MYCN-amplified (MYCN-amp) tumors. Significance determined by unpaired t test.
Fig. 4
Fig. 4. GMDS is a direct transcriptional target of N-MYC in NB cells.
MYCN-regulatable SH-EP cells, labeled IND (inducible) or REP (repressible) were treated with 40 ng/mL doxycycline (Dox). GMDS and MYCN mRNA and protein were measured by qPCR (A) or western blot (B). C MYCN-inducible SH-EP cells were transfected with a GMDS promoter reporter, shortened promoter, or PGL4.10 vector as control, followed by 48 h treatment with 100 ng/mL doxycycline. Firefly and Renilla luminescence were measured; values shown are normalized to Renilla. D Chromatin from BE(2)-C cells was pulled down with anti-N-MYC or anti-rabbit antibody and purified genomic DNA was measured by qPCR with DNA from 2% input used as standard. E, F BE(2)-C cells were treated with scramble or MYCN siRNA and collected for rt-PCR to confirm the knockdown at 72 h as well as lectin-based flow cytometry at 96 h. Example histograms are normalized to mode; open histogram, scramble siRNA; closed blue histogram, siMYCN. Bar graphs indicate mean fluorescence intensity (MFI) with each dot representing one treated well. AAL Aleuria aurantia lectin (core fucose), SNA Sambucus nigra lectin (sialic acid). Significance determined by multiple t tests (A,C,D) or unpaired t test (E, F); bars indicate mean; error bars indicate SEM.
Fig. 5
Fig. 5. GMDS is a key modulator of core fucosylation in neuroblastoma cell lines.
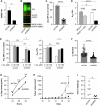
BE(2)-C cells were stably transfected with GMDS (shGMDS) or scramble (shCON) shRNA. A Quantitative PCR results (GMDS mRNA fold-difference) are shown for each transfection. B Cells were lysed and a western blot using Aleuria aurantia (AAL) and an anti-GMDS antibody was performed. C Cell surface core-fucosylation status was analyzed by lectin-based flow cytometry. AAL mean fluorescence intensity (MFI) for shGMDS cells was normalized to the average value for shCON cells (dashed line at 100). Pooled data from three independent experiments at different passages is shown. D AAL absorbance values are shown for supernatant collected from BE(2)-C, shCON, and shGMDS cells after 24 h incubation in serum free medium. Brefeldin A (BFA) is included as a positive control for secretory pathway blockade. E BE(2)-C shCON and shGMDS cells were grown for 3 d with indicated concentrations of L-fucose and then analyzed for AAL binding by flow cytometry (left panel) or ELISA (right panel). MFI of all samples was normalized to untreated shCON samples (gray dashed line at 100) for the top figure. F A Vybrant cell adhesion assay was performed, and percentage of cells attached at completion is shown (n = 48 samples per cell type). G Cell migration was measured via wound healing assay where a uniform gap was created at t = 0 h. Example images are provided in Supplementary Fig. S6. H Tumor induction using GMDS genetic knockdown cells (shGMDS) was completed by injection into the bilateral flanks of athymic nude mice. Daily tumor measurements were performed with linear mixed effects modeling (p = 0.009). I Tumor explant weight was also compared at sacrifice. Bars or points indicate mean ± SEM. Representative data from one of two (F) or three (CE, G) independent experiments is shown, n = 3 biological replicates per condition. Significance determined by unpaired t test (A, C, F, I), two-way ANOVA (G) or one-way ANOVA (D, E); only significant comparisons are shown.
Fig. 6
Fig. 6. Pharmacological fucosylation blockade inhibits NB cell growth and core fucosylation.
A BE(2)-C cells incubated with 100 μM 2-FF for 5 d were assessed for core fucosylation by Aleuria aurantia (AAL) western blot. BE(2)-C cells were grown for 3 d in the presence of DMSO or indicated concentrations of 2-FF and then analyzed by flow cytometry (B) or lectin-based ELISA (C) with AAL. An example histogram is shown for indicated concentrations of 2-FF. AAL mean fluorescence intensity (MFI) was normalized to DMSO control values (indicated by dotted line at 100). Representative data from one of three independent experiments is shown for each. D A Vybrant cell adhesion assay was performed using BE(2)-C cells treated for two days with 500 μM 2-FF (n = 40/ treatment). EI Established BE(2)-C tumors were randomized to 2-FF or vehicle water supplementation. E Serial tumor measurements were compared by linear mixed effect modeling (p = 0.02). F Kaplan–Meier analysis with log-rank testing revealed 2-FF treatment prolonged survival (p = 0.02). G H&E staining reveals large areas of treatment-effect necrosis at low power (×20) magnification. High power magnification is shown in the red inset (center image). AAL IHC staining (H), and the total necrotic percentage of each tumor (I) were quantified in QuPath0.4.3. Significance determined by one-sample t test (B), one-way ANOVA (C), or unpaired t test (D, H, I); only significant comparisons are shown. Bars or lines indicate mean; error bars indicate SEM.

References

    1. Brodeur GM. Neuroblastoma: biological insights into a clinical enigma. Nat Rev Cancer. 2003;3:203–16. - PubMed
    1. Cheung NK, Dyer MA. Neuroblastoma: developmental biology, cancer genomics and immunotherapy. Nat Rev Cancer. 2013;13:397–411. - PMC - PubMed
    1. Park JR, Bagatell R, London WB, Maris JM, Cohn SL, Mattay KK, et al. Children’s Oncology Group’s 2013 blueprint for research: neuroblastoma. Pediatr Blood Cancer. 2013;60:985–93. - PubMed
    1. Mahapatra S, Challagundla KB Neuroblastoma. StatPearls. Treasure Island, FL: StatPearls Publishing; 2023.
    1. Varki A, Cummings RD, Esko JD, Stanley P, Hart GW, Aebi M, et al., editors. Essentials of Glycobiology. New York: Cold Spring Harbor 2022. - PubMed