. 2025 Jun;24(6):e70018.
doi: 10.1111/acel.70018. Epub 2025 Feb 17.

Activated mTOR Signaling in the RPE Drives EMT, Autophagy, and Metabolic Disruption, Resulting in AMD-Like Pathology in Mice

Affiliations

Activated mTOR Signaling in the RPE Drives EMT, Autophagy, and Metabolic Disruption, Resulting in AMD-Like Pathology in Mice

Olivia Chowdhury et al. Aging Cell. 2025 Jun.

Abstract

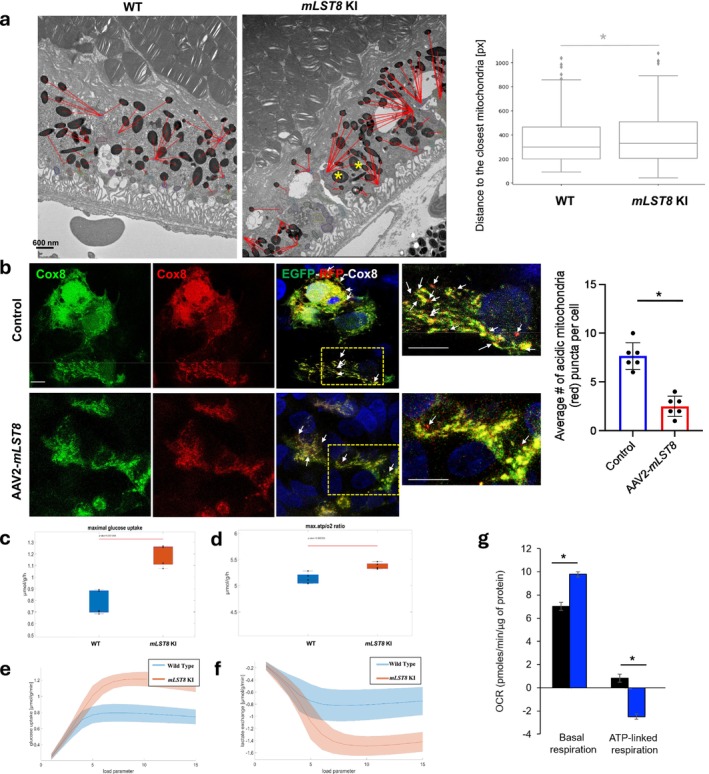
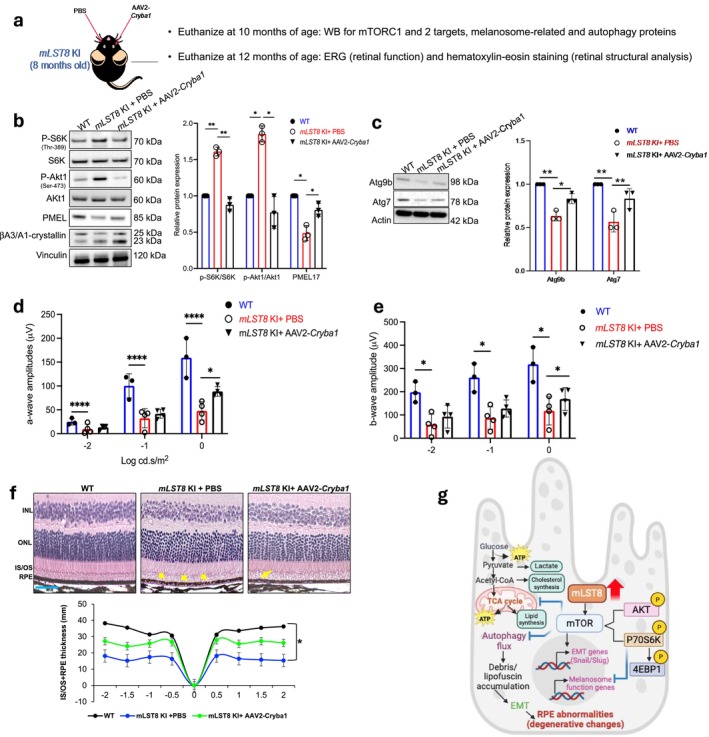
The mechanistic target of rapamycin (mTOR) complexes 1 and 2 (mTORC1/2) are crucial for various physiological functions. Although the role of mTORC1 in retinal pigmented epithelium (RPE) homeostasis and age-related macular degeneration (AMD) pathogenesis is established, the function of mTORC2 remains unclear. We investigated both complexes in RPE health and disease. Therefore, in this study, we have attempted to demonstrate that the specific overexpression of mammalian lethal with Sec13 protein 8 (mLST8) in the mouse RPE activates both mTORC1 and mTORC2, inducing epithelial-mesenchymal transition (EMT)-like changes and subretinal/RPE deposits resembling early AMD-like pathogenesis. Aging in these mice leads to RPE degeneration, causing retinal damage, impaired debris clearance, and metabolic and mitochondrial dysfunction. Inhibition of mTOR with TORIN1 in vitro or βA3/A1-crystallin in vivo normalized mTORC1/2 activity and restored function, revealing a novel role for the mTOR complexes in regulating RPE function, impacting retinal health and disease.

Keywords: RPE; epithelial–mesenchymal transition; mLST8; mTOR complex 1; mTOR complex 2; metabolic/mitochondrial changes.


Conflict of interest statement

The authors declare no conflicts of interest.

Figures

FIGURE 1
FIGURE 1
Generation and characterization of mLST8 KI mice. (a) Cartoon showing that in addition to mTOR, mLST8 is a major component of both mTOR complexes 1 and 2. (b) Schematic showing the strategy for generating mLST8 KI mice. Briefly, TGA stop codon in the mouse Best1 gene was replaced with the “T2A‐mouse mLST8 CDS (coding sequence)” cassette. The targeting vector was generated by PCR using BAC clone RP23‐340G9 from the C57BL/6 library as a template. The targeting vector had Neo cassette, which was flanked by SDA (self‐deletion anchor) sites. DTA (diptheria toxin A) was used for negative selection. C57BL/6 embryonic stem cells were used for gene targeting. (c) Western blot analysis indicating that RPE lysates shows overexpression of mLST8 relative to WT. Such changes were not seen in retina lysates from the same mice. Retina RPE lysate preparation was confirmed by evaluating the levels of GFAP and RPE65 in the respective lysates n = 3. **p < 0.01. (d) Western blot from RPE lysates of mLST8 KI RPE cells further revealed an increased ratio of p‐S6K/S6K, p‐4EBP/4EBP, p‐ULK1/ULK1, and p‐Akt1/Akt1 in these cells, compared to controls (WT) n = 3. *p < 0.05. (e) Western blot showing that mLST8 overexpression (AAV2‐mLST8) in Raptor or Rictor KO MEF cells activates mTORC2 target (p‐Akt1) and mTORC1 target (p‐P70S6K), respectively, compared to controls n = 3. ****p < 0.001, ns = not significant.
FIGURE 2
FIGURE 2
mLST8 KI mice show retinal structural abnormalities. Hematoxylin–eosin staining on retinal sections revealed disintegration of the POS layer in 5‐month‐old mLST8 KI retina, but not in age‐matched controls (a, arrows). Consistent abnormalities were also observed in the SRS (disruptions/debris‐like accumulation, cellular infiltrations) and RPE (patchy, depigmented appearance) with increased age in 7, 9, 12 and 15‐month‐old mLST8 KI retina compared to WT (b, c, d, e) n = 6. Scale bar = 50 μm (Zoomed Inset: 20 μm).
FIGURE 3
FIGURE 3
mLST8 KI RPE cells show accumulation of debris and structural abnormalities. (a) Immunostaining of RPE flat mounts with phalloidin‐Alexafluor 488 to stain F‐actin (Green) showed pronounced changes in the honeycomb‐like morphology in 9‐month‐old mLST8 KI RPE, with noticeable disruption of cell boundaries (arrows) compared to age‐matched controls n = 4. Scale bar = 20 μm. (b) β‐catenin staining (red) on RPE flatmounts showed noticeable decrease in the expression in the 9‐month‐old mLST8 KI RPE cells (arrows), compared to WT, with the increase of cytosolic localization of the protein (asterisks in b) n = 4. Scale bar = 20 μm. (c) Transmission electron microscopy reveals a disruption of the tight junctions between adjacent RPE cells in 15‐month‐old mLST8 KI mice compared to age‐matched WT controls (arrowheads). Scale bar = 600 nm (d) Immunohistochemistry of 9‐month‐old retinal sections showed a disruption of apical polarity characterized by the expression Na+K+ATPase (green) and basal polarity characterized by MCT3 (red). **p < 0.01. Scale bar = 20 μm. (e) The mLST8KI mice show disruption (arrows) as well as significant decrease in the expression of the protein compared to age–matched wild‐type controls. **p < 0.01. Scale bar = 20 μm. (f) Immunohistochemistry of 9‐month‐old mLST8 KI retinal sections stained positive for EMT markers Snail/SLUG (red) (arrows) compared to WT controls n = 4. Scale bar = 20 μm. (g) Immunohistochemistry of 9‐month‐old retinal sections showed basolateral accumulation of early AMD markers, APOE (green) in mLST8 KI RPE (arrow) but not in age‐matched WT. Scale bar = 20 μm. (h) TEM images show deposits under the RPE cell at the basal lamina in a 15‐month‐old mLST8 KI (asterisk in d) compared to age–matched WT controls. Scale bar = 600 nm.
FIGURE 4
FIGURE 4
Abnormal mitochondrial function in the RPE cells from mLST8 KI mice. (a) TEM images showing noticeably fewer mitochondria near melanosomes in mLST8 KI RPE cells compared to WT (asterisks in a). n = 3. *p < 0.05. Scale bar = 600 nm. (b) Mitophagy flux was estimated using EGFP‐mCherry‐Cox8 construct in control (uninfected) or AAV2‐mLST8 construct–infected undifferentiated ARPE19 cells, which showed a reduced number of acidic mitochondria in the mLST8‐overexpressing cells relative to controls, indicating diminished mitophagy in these cells. n = 4. Scale bar = 20 μm. *p < 0.05. Metabolomics analysis revealed an increase in (c, e) glucose uptake but decline in (d) ATP production rate and (f) lactate exchange in mLST8 KI RPE compared to WT, suggesting an abnormal glucose metabolism in these cells. n = 5. (g) Seahorse analysis revealed increase in basal respiration but decline in ATP‐linked respiration in cultured adult mLST8 KI RPE cells compared to WT, indicating abnormal mitochondrial function. n = 5. *p < 0.05.
FIGURE 5
FIGURE 5
mLST8 overexpression in the RPE triggers alterations in autophagy. (a) Heat map shows differential expression of autophagy‐related genes (Log2 fold change; mLST8 KI vs. WT) from RNAseq analysis of WT and mLST8 KI RPE cells at 1 and 5 months (n = 3). (b) qPCR confirms reduced expression of autophagosome formation genes (Atg3, Atg9b, Uvrag) in 5‐month‐old mLST8 KI RPE cells compared to WT (n = 4; **p < 0.01). (c) TEM images reveal increased autophagosomes (double membrane structures, arrows) and debris (asterisks) in mLST8 KI RPE, indicating impaired clearance, absent in WT (scale bar = 600 nm; n = 3). (d) Western blot shows higher p62/SQSTM1 levels in mLST8 KI RPE (n = 3; ****p < 0.0001). (e) Western blot of LC3‐I and LC3‐II in RPE explants with/without chloroquine (ChQ) indicates reduced autophagy flux in mLST8 KI (n = 3; *p < 0.05). (f) Undifferentiated ARPE19 cells overexpressing mLST8 show decreased LC3 lipidation compared to controls (n = 3; *p < 0.05). (g) AAV2‐mLST8–infected ARPE19 cells (undifferentiated) have increased autophagosomes (yellow puncta, asterisks) and fewer autolysosomes (red puncta, arrows), indicating reduced autophagy flux (n = 4; **p < 0.01, scale bar = 10 μm). (h, i) Torin1 treatment (50 nM, 20 h) in mLST8 KI RPE explants restores autophagy protein and gene levels (Atg7, Atg9b) compared to untreated controls, suggesting upregulation of autophagy mediators n = 3. *p < 0.05, **p < 0.01 (for h) and n = 4. ***p < 0.001, ****p < 0.0001 (for i).
FIGURE 6
FIGURE 6
βA3/A1‐crystallin overexpression in the RPE rescues autophagy and melanosome alterations and retinal structure/function in mLST8 KI mice. (a) Cartoon showing the strategy for subretinal injection of the AAV2‐mCryba1 construct into one eye of 8‐month‐old mLST8 KI mice, with the contralateral eyes receiving PBS vehicle. Animals were euthanized 2 and 4 months after injection. (b, c) Western blot analysis and densitometry showing that Cryba1 overexpression in the RPE (confirmed by western blot in b) of mLST8 KI mice could rescue the abnormal levels of both mTORC1 (p‐S6K) and mTORC2 (p‐Akt1) targets (b), and the melanosome marker (PMEL; b), as well as rescued the levels of major regulators of autophagosome formation (Atg9b, Atg7; c) in these animals (b, c), relative to PBS injected eyes (b, c). n = 3. *p < 0.05, **p < 0.01. AAV2‐mCryba1 treatment (subretinal injection) to mLST8 KI mice for 4 months rescued retinal function as evident from increase in scotopic (d) a‐ and (e) b‐wave amplitudes after the treatment, compared to PBS‐injected contralateral eyes of the KI mouse. n = 4. ****p < 0.0001, *p < 0.05. (f) AAV2‐mCryba1 treatment to mLST8 KI mice for 4 months also rescued early RPE changes (arrows) like the patchy appearance of the monolayer and decline in thickness (spider plot), compared to PBS–treated contralateral eyes of the mLST8 KI mouse. n = 4. Scale bar = 20 μm. *p < 0.05. (g) Cartoon depicting overexpression of mLST8 in RPE cells (mLST8 KI mice) activated both mTORC1 and mTORC2, disrupting glucose metabolism, mitochondrial function, autophagy, and melanosome function, leading to debris accumulation, EMT activation, and age‐related retinal degeneration resembling AMD. Targeting mTOR with inhibitors or modulators rescued these changes, suggesting a potential therapeutic strategy for retinal diseases by modulating mTOR signaling. Created with BioRender.com.

References

    1. Boulton, M. E. 2014. “Studying Melanin and Lipofuscin in RPE Cell Culture Models.” Experimental Eye Research 126: 61–67. 10.1016/j.exer.2014.01.016. - DOI - PMC - PubMed
    1. Boya, P. , Kaarniranta K., Handa J. T., and Sinha D.. 2023. “Lysosomes in Retinal Health and Disease.” Trends in Neurosciences 46, no. 12: 1067–1082. 10.1016/j.tins.2023.09.006. - DOI - PMC - PubMed
    1. Chambers, M. C. , MacLean B., Burke R., et al. 2012. “A Cross‐Platform Toolkit for Mass Spectrometry and Proteomics.” Nature Biotechnology 30, no. 10: 918–920. 10.1038/nbt.2377. - DOI - PMC - PubMed
    1. Conrad, R. , and Narayan K.. 2023. “Instance Segmentation of Mitochondria in Electron Microscopy Images With a Generalist Deep Learning Model Trained on a Diverse Dataset.” Cell Systems 14, no. 1: 58–71. 10.1016/j.cels.2022.10.005. - DOI - PMC - PubMed
    1. da Veiga Leprevost, F. , Haynes S. E., Shen S., et al. 2020. “Philosopher: A Versatile Toolkit for Shotgun Proteomics Data Analysis.” Nature Methods 17, no. 10: 869–870. 10.1038/s41592-020-0938-4. - DOI - PMC - PubMed

MeSH terms

Substances

LinkOut - more resources