. 2025 Feb;61(4):e70021.
doi: 10.1111/ejn.70021.

Posture-Dependent Modulation of Interoceptive Processing in Young Male Participants: A Heartbeat-Evoked Potential Study

Affiliations

Posture-Dependent Modulation of Interoceptive Processing in Young Male Participants: A Heartbeat-Evoked Potential Study

Mayu Dohata et al. Eur J Neurosci. 2025 Feb.

Abstract

Interoception, the internal perception of bodily states such as heartbeat and hunger, plays a crucial role in shaping cognitive and emotional states. Since postural control affects cognitive and emotional processing, exploring postural effects on interoception could help uncover the neural mechanisms underlying its effects on cognition and emotion. In this study, we aimed to investigate how different postures affect interoception by using heartbeat-evoked potentials (HEPs), which reflect the cortical processing of cardiac signals. Two experiments were conducted; Experiment 1 involved 47 healthy male participants comparing sitting and standing postures, and Experiment 2 involved 24 healthy male participants comparing stable and unstable standing conditions. HEPs were analyzed using cluster-based permutation analysis to identify statistically significant spatiotemporal clusters. In Experiment 1, significant clusters were identified over central electrodes (Cz, C1, C2, FCz, and FC1) within the post-R-wave interval of 304-572 ms, revealing significantly lower HEP amplitudes during standing compared to sitting [W = 80, p < 0.001, r = 0.62]. In Experiment 2, HEP amplitudes were significantly lower during unstable standing compared to stable standing [t(20) = 2.9, p = 0.0099, d = 0.62]. Furthermore, we found no significant correlations between HEP changes and physiological changes such as cardiac activity and periodic and aperiodic brain activity. These findings suggest postural differences modulate interoceptive processing, with standing postures attenuating HEP amplitudes, probably because of a redistribution of attentional resources from interoceptive to somatosensory (proprioceptive) and vestibular processing, necessary for maintaining standing posture. This study provides insights into the neural mechanisms underlying posture-interoception interaction.

Keywords: EEG; brain–heart interaction; heartbeat‐evoked potentials; interoception; posture.


Conflict of interest statement

The authors declare no conflicts of interest.

Figures
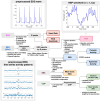
FIGURE 1
FIGURE 1
Schematic diagram depicting the preprocessing and analysis workflow for calculating HEP, PSD, periodic and aperiodic activity, cardiac activity, tonic EDA, and COP variables. (A) Examples of preprocessed ECG, EEG and detected R peaks time series patterns, preprocessed epochs, and HEP waveform are shown. PSD was calculated within the frequency range of 1–30 Hz using Welch's method, whereas periodic and aperiodic components were dissociated using the Fitting Oscillations & One‐Over‐F (FOOOF) algorithm. Tonic EDA and COP variables were derived from raw EDA and COP data during the task. Abbreviations: CSD, current source density; ICA, independent component analysis; PSD, power spectral density; FFT, fast Fourier transformation.
FIGURE 2
FIGURE 2
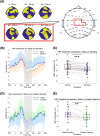
Cluster‐based permutation analysis and HEP comparisons in Experiments 1 and 2. (A) Topographic plot showing the results of the cluster‐based permutation test comparing HEPs between the Sitting and Standing conditions. The topography illustrates the difference (sitting–standing) in the post‐R‐wave latency range of 0–600 ms. Positive differences are represented in yellow, and negative differences are in blue. Significant clusters for each 100‐ms interval are highlighted with asterisks. The electrode map to the right highlights electrodes that were consistently part of significant clusters across all 100‐ms intervals within the time window of 300–600 ms, shown enclosed in red (Cz, C1, C2, FCz, and FC1). (B) HEPs in the sitting and standing conditions. The waveforms represent the grand‐averaged HEPs calculated by averaging data from Cz, C1, C2, FCz, and FC1 electrodes. Colored solid lines and shadows represent the grand averages of all participants and the SD, respectively. HEP amplitudes were calculated from HEPs in the latency range of 304–572 ms (gray‐shaded area). (C) Box plots and individual plots show the average HEP amplitudes for the Sitting and Standing conditions. The box plots show the median and interquartile ranges, whereas the individual plots display average HEP amplitudes for each participant. The plots for participants who had lower HEP in standing against sitting are connected by solid lines, and plots for participants who had higher HEP in standing against sitting are connected by dotted lines. (D) Grand‐averaged HEPs in the stable and unstable standing conditions. The waveforms represent the grand‐averaged HEPs calculated by averaging data from Cz, C1, C2, FCz, and FC1 electrodes. Colored solid lines represent the average HEPs of all participants, and the shaded areas show the SD. HEP amplitudes were calculated from the gray‐shaded latency range of 304–572 ms. (E) Box plots and individual participant data for HEP amplitudes in the stable and unstable conditions. The box plots show the median and interquartile ranges, whereas the individual plots display average HEP amplitudes for each participant. Solid lines connect participants with lower HEP amplitudes in the unstable condition, whereas dotted lines connect those with higher HEP amplitudes in the unstable condition.
FIGURE 3
FIGURE 3
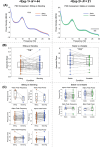
PSDs, aperiodic slope, and periodic parameters in Experiments 1 and 2. (A) PSDs (1–30 Hz) at the electrodes in the ROI for Experiment 1 (left) and Experiment 2 (right). Colored solid lines and shadows represent the grand averages of all participants and the SD, respectively. (B) Box plots and individual plots for the aperiodic slope in Experiment 1 (left) and Experiment 2 (right). Box plots display the median and interquartile ranges, whereas individual plots represent the average aperiodic slope for each participant. Solid lines connect participants with lower values in the right condition, whereas dotted lines connect those with higher values in the right condition. The aperiodic slopes were derived from FOOOF analysis and are inherently unitless, as they represent mathematical features of the frequency spectrum rather than physical measurements. (C) Box plots and individual plots for periodic parameters in Experiment 1 (left) and Experiment 2 (right). Box plots display the median and interquartile ranges, whereas individual plots represent the average periodic parameters for each participant. Solid lines connect participants with lower values in the right condition, whereas dotted lines connect those with higher values in the right condition. Parameters include peak frequency and peak power for theta, alpha, and beta bands. The peak power parameters were derived from FOOOF analysis and are inherently unitless, as they represent mathematical features of the frequency spectrum rather than physical measurements. Data from participants for whom periodic parameters were calculated are included. In Experiment 2, no participants (N = 0) had detectable peaks in the theta band. No significant differences were observed in any of the comparisons.
FIGURE 4
FIGURE 4
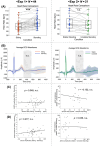
Heart rate, ECG waveforms, and correlations with interconditional differences in HEP. (A) Box plots and individual plots showing heart rate for the two conditions in Experiment 1 (left) and Experiment 2 (right). Box plots display the median and interquartile ranges, whereas individual plots represent the average heart rate for each participant. Solid lines connect participants with lower values in the right condition, whereas dotted lines connect those with higher values in the right condition. (B) ECG waveforms in the epoch (−200 to 1000 ms) for the two conditions in Experiment 1 (left) and Experiment 2 (right). Colored solid lines and shadows represent the grand averages of all participants and the SD, respectively. Mean ECG amplitudes were calculated from the gray‐shaded latency range of 304–572 ms (the same time window used for HEP analysis). (C) Scatter plots showing a correlation between interconditional differences in HEP amplitudes and interconditional differences in heart rate for the two conditions in Experiment 1 (left) and Experiment 2 (right). The gray plots show individual plots. The black line is the straight line of linear approximation. (D) Scatter plots showing the correlation between interconditional differences in HEP amplitudes and interconditional differences in ECG amplitudes for the two conditions in Experiment 1 (left) and Experiment 2 (right). Gray points represent individual data, and the black line represents the linear approximation.
FIGURE 5
FIGURE 5
Comparison of tonic EDA across conditions. Box plots and individual plots showing tonic EDA for the two conditions in Experiment 1 (left) and Experiment 2 (right). Box plots display the median and interquartile ranges, whereas individual plots represent the tonic EDA for each participant. Solid lines connect participants with lower tonic EDA values in the right condition, whereas dotted lines connect those with higher tonic EDA values in the right condition. Since cvxEDA calculates the tonic component from standardized EDA signals, the output is unitless.
FIGURE 6
FIGURE 6
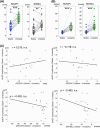
Comparison of COP variables and their correlation with HEP amplitudes across stable and unstable conditions. Box plots and individual plots showing COP variables ([A] left: SD [AP], [A] right: SD (ML], [B] left: MV [AP], and [B] right: MV [ML]) for the stable and unstable conditions. Box plots display the median and interquartile ranges, whereas individual plots represent the COP variables for each participant. Solid lines connect participants with lower COP values in the unstable condition, whereas dotted lines connect those with higher COP values in the unstable condition. (C) Scatter plots showing the correlation between interconditional differences in HEP amplitudes and interconditional differences in COP variables (ΔSD [AP]: upper left, ΔSD [ML]: upper right, ΔMV [AP]: lower left, and ΔMV [ML]: lower right) for the stable and unstable conditions. Gray plots represent individual data points, and the black line shows the linear approximation. For ΔMV (AP) and ΔMV (ML), no significant correlations were observed after FDR correction (p = 0.094). However, before correction, significant negative correlations were observed (ΔMV [AP]: uncorrected p = 0.047, ΔMV [ML]: uncorrected p = 0.033).

References

    1. Ainley, V. , Apps M. A. J., Fotopoulou A., and Tsakiris M.. 2016. “‘Bodily Precision’: A Predictive Coding Account of Individual Differences in Interoceptive Accuracy.” Philosophical Transactions of the Royal Society B 371: 20160003. - PMC - PubMed
    1. Al, E. , Iliopoulos F., Forschack N., et al. 2020. “Heart–Brain Interactions Shape Somatosensory Perception and Evoked Potentials.” Proceedings. National Academy of Sciences. United States of America 117: 10575–10584. - PMC - PubMed
    1. Al, E. , Iliopoulos F., Nikulin V. V., and Villringer A.. 2021. “Heartbeat and Somatosensory Perception.” NeuroImage 238: 118247. - PubMed
    1. Al, E. , Stephani T., Engelhardt M., Haegens S., Villringer A., and Nikulin V. V.. 2023. “Cardiac Activity Impacts Cortical Motor Excitability.” PLoS Biology 21: e3002393. - PMC - PubMed
    1. Awad, S. , Debatin T., and Ziegler A.. 2021. “Embodiment: I sat, I ‘Felt, I Performed—Posture Effects on Mood and Cognitive Performance.” Acta Psychologica 218: 103353. - PubMed