. 2025 Feb;31(2):e70259.
doi: 10.1111/cns.70259.

Fecal Microbiota Transplantation Improves Cognitive Function of a Mouse Model of Alzheimer's Disease

Affiliations

Fecal Microbiota Transplantation Improves Cognitive Function of a Mouse Model of Alzheimer's Disease

Xueqin Jiang et al. CNS Neurosci Ther. 2025 Feb.

Abstract

Background: A growing body of evidence suggests a link between the gut microbiota and Alzheimer's disease (AD), although the underlying mechanisms remain elusive. This study aimed to investigate the impact of fecal microbiota transplantation (FMT) on cognitive function in a mouse model of AD.

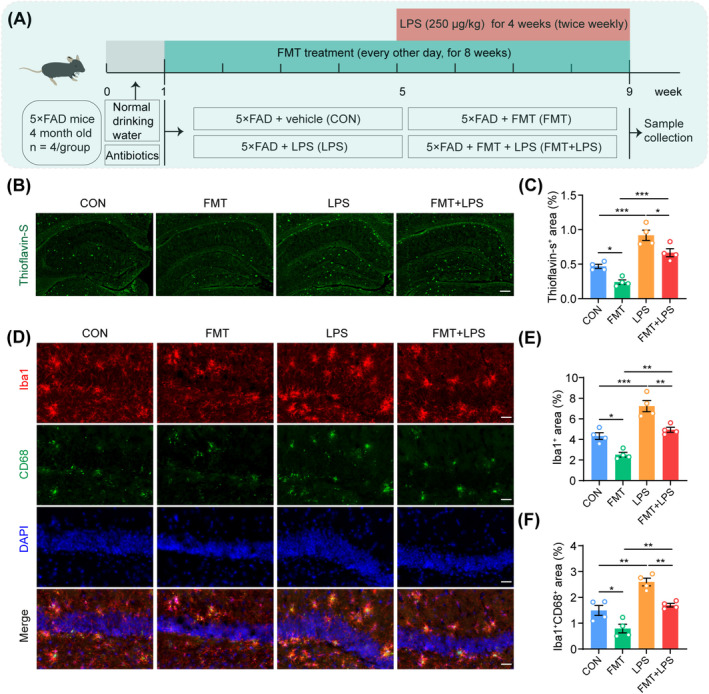
Methods: Four-month-old 5 × FAD (familial Alzheimer's disease) mice underwent antibiotic treatment to deplete their native gut microbiota. Subsequently, they received FMT either weekly or every other day. After 8 weeks, cognitive function and β-amyloid (Aβ) load were assessed through behavioral testing and pathological analysis, respectively. The composition of the gut microbiota was analyzed using 16S rRNA sequencing.

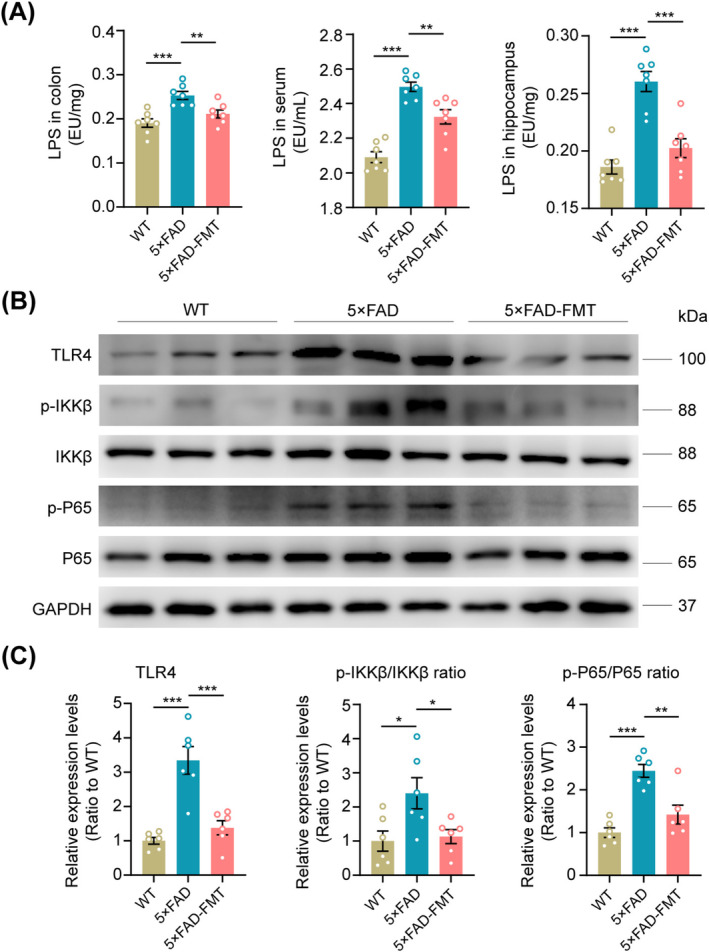
Results: Initial weekly FMT failed to alleviate memory deficits or reduce brain Aβ pathology in 5 × FAD mice. In contrast, FMT administered every other day effectively restored gut dysbiosis in 5 × FAD mice and decreased Aβ pathology and lipopolysaccharide levels in the colon and hippocampus. Mechanistically, FMT reduced the expression of amyloid β precursor protein, β-site APP cleaving enzyme 1, and presenilin-1, potentially by inhibiting the Toll-like receptor 4/inhibitor of kappa B kinase β/nuclear factor kappa-B signaling pathway. However, the cognitive benefits of FMT on 5 × FAD mice diminished over time.

Conclusion: These findings demonstrate the dose- and time-dependent efficacy of FMT in mitigating AD-like pathology, underscoring the potential of targeting the gut microbiota for AD treatment.

Keywords: Alzheimer's disease; fecal microbiota transplantation; gut microbiota; lipopolysaccharide; β‐amyloid.


Conflict of interest statement

The authors declare no conflicts of interest.

Figures

FIGURE 1
FIGURE 1
Cognitive improvements in 5 × FAD mice following FMT. (A) Diagrammatic illustration of the experimental process. Mice underwent antibiotic treatment, FMT (administered every other day for 8 weeks), behavioral tests, and sacrifices. (B) Statistical analysis of the latency for each mouse to reach the platform during the 5‐day training period in the Morris water maze. (C) Representative trajectories of mice on the sixth day (probe trial) of the Morris water maze. (D) Statistical analysis of the number of platform crossings and the percentage of time spent in the target quadrant during the Morris water maze probe trial. (E) Movement tracks of mice in the testing phase of the Y‐maze test. (F) Statistical analysis of the number of entries into the novel arm and the duration of exploration in the Y‐maze. (G) Movement tracks of mice in the novel object recognition test. (H) Statistical analysis of the discrimination index for novel objects among the mice. n = 12 per group. Significance was evaluated using repeated measures two‐way ANOVA with Tukey's post hoc test for the latency data in (B), the Kruskal‐Wallis test with Dunn's post hoc analysis for the number of entries into the novel arm in (F), and one‐way ANOVA with Dunnett's post hoc test for all other data. *p < 0.05, **p < 0.01, ***p < 0.001.
FIGURE 2
FIGURE 2
Alterations in gut microbiota composition in 5 × FAD mice following FMT. (A) Alpha diversity analysis of gut microbial richness (Chao1 index) and diversity (Simpson and Shannon indices) across different groups. (B) Beta diversity was assessed using PCoA at the ASV level to visualize intergroup differences in gut bacterial composition. PERMANOVA was employed to evaluate the statistical significance of these differences. (C) Taxonomic distribution of gut microbiota at the genus level. (D) Heatmap representation of the genus‐level composition of the gut microbiota, showing relative abundances across samples. (E) Quantitative analysis of the relative abundances of Bifidobacterium, Lactobacillus, Faecalibaculum, Desulfomicrobium, and Lysinibacillus among the three groups. n = 7 per group. Statistical analyses were conducted using the Kruskal‐Wallis test with Dunn's post hoc test for multiple comparisons. *p < 0.05, **p < 0.01, ***p < 0.001.
FIGURE 3
FIGURE 3
Ameliorative effects of FMT on colonic inflammatory responses and Aβ pathology in 5 × FAD mice. (A) Mean body weight changes in mice during the modeling phase. (B) Representative images of mouse colons. (C) Statistical analysis of colon length. (D) Representative images of HE staining in the colon. Scale bar, 100 μm. (E) Colonic histological scores based on HE staining. (F) Quantitative analysis of colonic IL‐1β, IL‐6, and TNF‐α mRNA expression levels. (G) Representative immunofluorescence images of 6E10 staining in the colon. Scale bar, 40 μm. (H) Percentage of 6E10+ area in the colon. n = 12 (A–C), n = 7 (E) and n = 6 (F–H) per group. Statistical significance was assessed using repeated measures two‐way ANOVA with Tukey's post hoc test for the weight data in (A), the Kruskal‐Wallis test with Dunn's post hoc analysis for the histological scores in (E) and relative mRNA expression levels of IL‐1β and IL‐6 in (F), and one‐way ANOVA with Dunnett's post hoc test for all other data. *p < 0.05, **p < 0.01.
FIGURE 4
FIGURE 4
Improvements in hippocampal Aβ deposition and neuroinflammation following FMT in 5 × FAD mice. (A) Representative images showing Thioflavin‐S+ plaques in the hippocampus. Scale bar, 200 μm. (B) Quantitative analysis of the percentage of hippocampal Thioflavin‐S+ area. (C, D) Representative immunofluorescence images of the hippocampus stained with 6E10 (Red), Iba1 (Green), and DAPI (Blue) for each group. Scale bar, 200 μm for (C), and 40 μm for (D). (E) Statistical analysis of the percentage of hippocampal 6E10+ and Iba1+ area. (F, G) Representative Western blot bands and densitometry analysis of 6E10 and Iba1 in the hippocampus of all groups. (H) Statistical analysis of hippocampal IL‐1β, IL‐6, and TNF‐α mRNA expression levels. n = 6 per group. Statistical significance was evaluated using the Kruskal‐Wallis test with Dunn's post hoc analysis for Iba1 relative expression levels in (G) and one‐way ANOVA with Dunnett's post hoc test for all other data. *p < 0.05, **p < 0.01, ***p < 0.001.
FIGURE 5
FIGURE 5
FMT‐induced APP, BACE1, and PS1 downregulation in the hippocampus of 5 × FAD mice. (A) Representative immunofluorescence images of APP in the hippocampus. Scale bar, 100 μm. (B) Statistical analysis of the percentage of hippocampal APP+ area. (C–E) Representative Western blot bands and densitometry analysis of APP, BACE1, PS1, ADAM10, IDE, NEP, and LRP1 in the hippocampus across the three groups. n = 6 per group. Statistical significance was evaluated using the Kruskal‐Wallis test with Dunn's post hoc analysis for relative expression levels of PS1 and ADAM10 shown in (E) and one‐way ANOVA with Dunnett's post hoc test for all other data. *p < 0.05, **p < 0.01, ***p < 0.001.
FIGURE 6
FIGURE 6
FMT‐induced suppression of the TLR4/IKKβ/NF‐κB signaling pathway in the hippocampus of 5 × FAD mice. (A) ELISA analysis of LPS levels in the colon, serum, and hippocampus. (B, C) Representative Western blot bands and densitometry analysis of hippocampal TLR4, p‐IKKβ/IKKβ, and p‐NF‐κB/NF‐κB. n = 7 (A) and n = 6 (B, C) per group. All statistical analyses were performed using one‐way ANOVA with Dunnett's post hoc test. *p < 0.05, **p < 0.01, ***p < 0.001.
FIGURE 7
FIGURE 7
Correlation analyses between FMT‐altered gut microbiota relative abundance and various pathological and behavioral indicators. (A) The relative abundance of Bifidobacterium was negatively correlated with the percentage of 6E10+ area in the hippocampus. (B) The relative abundance of Faecalibaculum was negatively associated with the percentage of Iba1+ area in the hippocampus. (C) The relative abundance of Bifidobacterium was positively correlated with the percentage of time spent in the target quadrant in the Morris water maze test. (D) The relative abundance of Lactobacillus was positively correlated with the percentage of time spent exploring the novel arm in the Y‐maze test. (E) The relative abundance of Faecalibaculum was positively correlated with the discrimination index in the novel object recognition test. (F) The relative abundance of Lactobacillus was inversely correlated with LPS levels in the colon. (G) The relative abundance of Faecalibaculum was negatively correlated with TLR4 expression levels in the hippocampus. (H) Heatmap of correlation analyses. All analyses were performed using Spearman correlation analysis. *p < 0.05, **p < 0.01, ***p < 0.001.
FIGURE 8
FIGURE 8
LPS supplementation attenuated the beneficial effects of FMT on AD‐like pathology in 5 × FAD mice. (A) Flowchart of the supplementary LPS experiment. (B) Representative images of Thioflavin‐S staining in the hippocampus. Scale bar, 200 μm. (C) Statistical analysis of the percentage of Thioflavin‐S+ area in the hippocampus. (D) Representative immunofluorescence images of Iba1 (Red), CD68 (Green), and DAPI (Blue) in the hippocampus of each group. Scale bar, 40 μm. (E) Statistical analysis of the percentage of Iba1+ area. (F) Statistical analysis of the percentage of Iba1+CD68+ area in the hippocampus. n = 4 per group. Statistical significance was evaluated using one‐way ANOVA with Tukey's post hoc test. *p < 0.05, **p < 0.01, ***p < 0.001.

Similar articles

Cited by

References

    1. “2023 Alzheimer's Disease Facts and Figures,” Alzheimer's & Dementia 19 (2023): 1598–1695. - PubMed
    1. Scheltens P., Blennow K., Breteler M. M., et al., “Alzheimer's Disease,” Lancet 388 (2016): 505–517. - PubMed
    1. Webers A., Heneka M. T., and Gleeson P. A., “The Role of Innate Immune Responses and Neuroinflammation in Amyloid Accumulation and Progression of Alzheimer's Disease,” Immunology and Cell Biology 98 (2020): 28–41. - PubMed
    1. Xin S. H., Tan L., Cao X., Yu J. T., and Tan L., “Clearance of Amyloid Beta and Tau in Alzheimer's Disease: From Mechanisms to Therapy,” Neurotoxicity Research 34 (2018): 733–748. - PubMed
    1. Tarasoff‐Conway J. M., Carare R. O., Osorio R. S., et al., “Clearance Systems in the Brain‐Implications for Alzheimer Disease,” Nature Reviews Neurology 11 (2015): 457–470. - PMC - PubMed

Substances