

The Risk Analysis Index Has Superior Discrimination Compared With the Modified Frailty Index-5 in Predicting Worse Postoperative Outcomes for the Octogenarian Neurosurgical Patient
- PMID: 39958794
- PMCID: PMC11809970
- DOI: 10.1227/neuprac.0000000000000044
The Risk Analysis Index Has Superior Discrimination Compared With the Modified Frailty Index-5 in Predicting Worse Postoperative Outcomes for the Octogenarian Neurosurgical Patient
Abstract
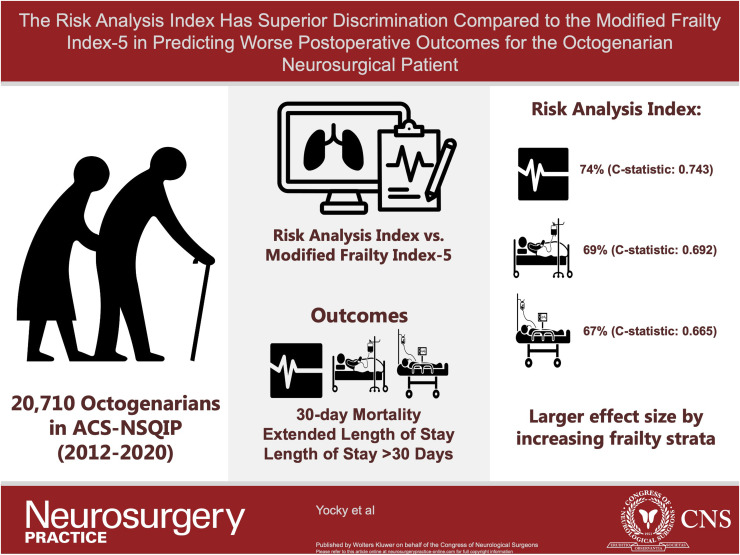
Background and importance: Healthcare systems continuously strive to improve quality and value of care. Advances in surgical technologies, enhanced perioperative surgical planning, and multidisciplinary care strategies are increasing the number of elective procedures in the geriatric population. However, frail older adults are still more likely to have poor postoperative outcomes. We examined the impact of frailty on postoperative outcomes, we compared the discriminative thresholds for the Risk Analysis Index (RAI), modified Frailty Index-5 (mFI-5), and increasing patient age.
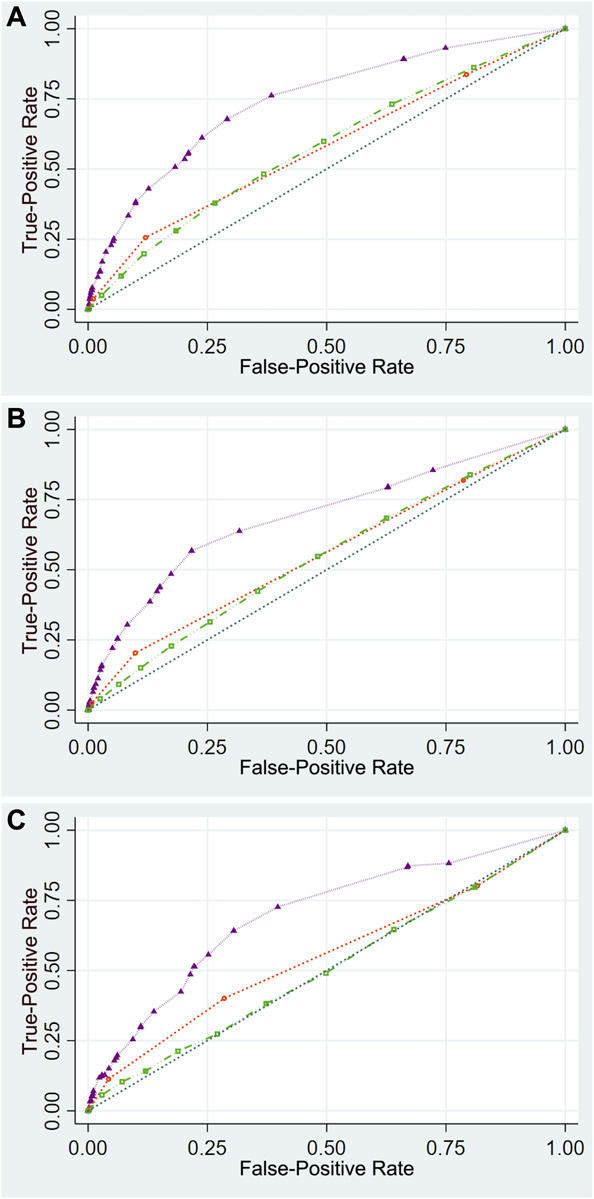
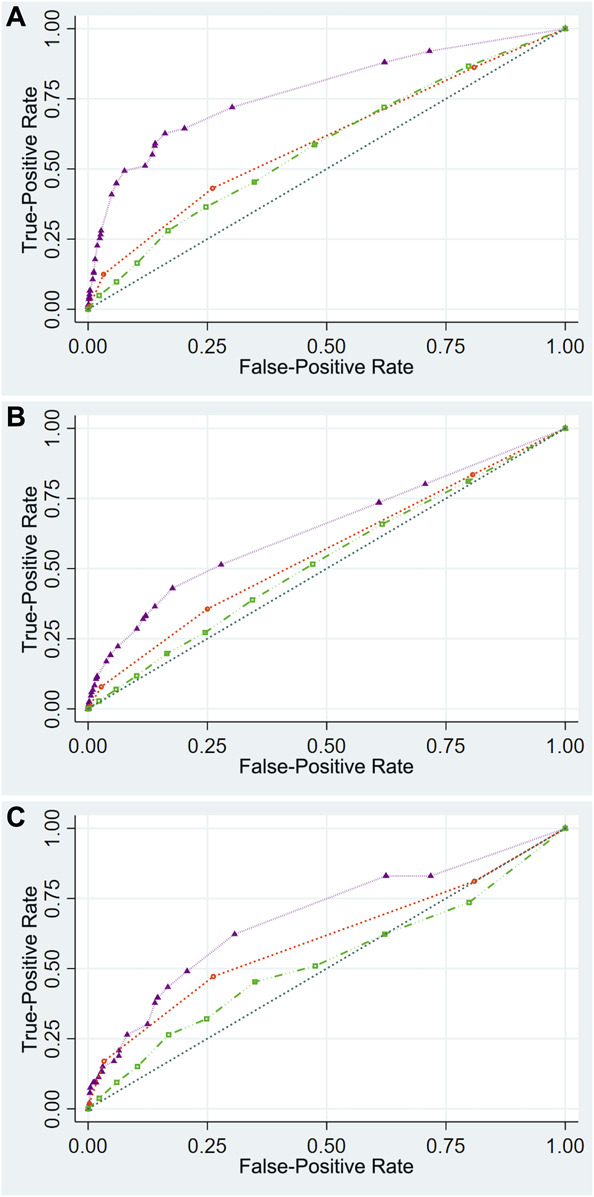
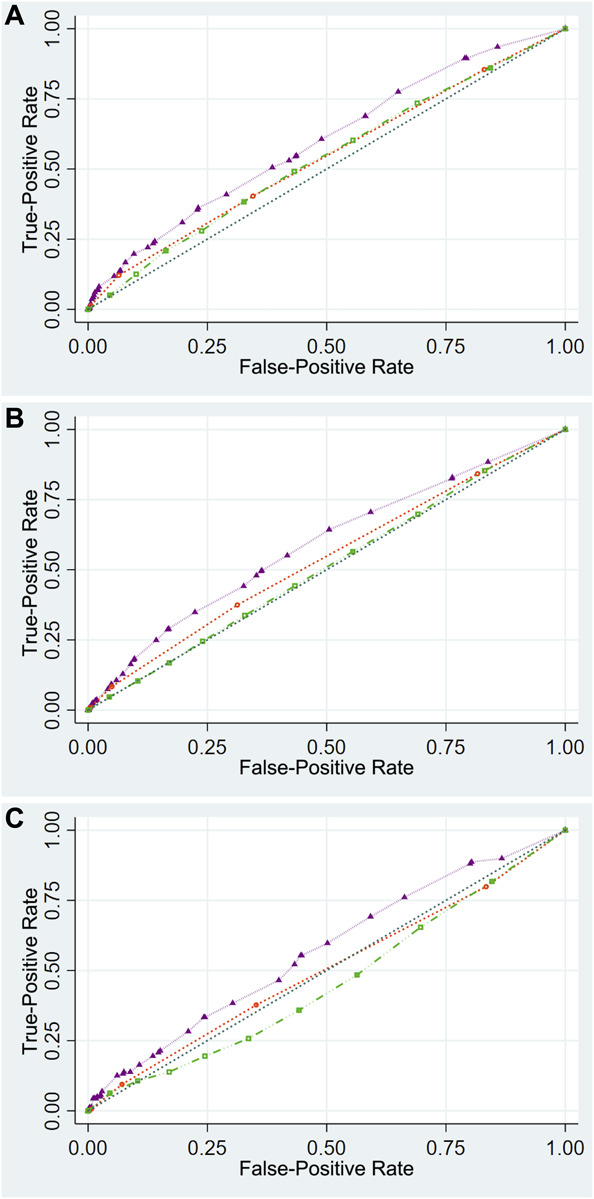
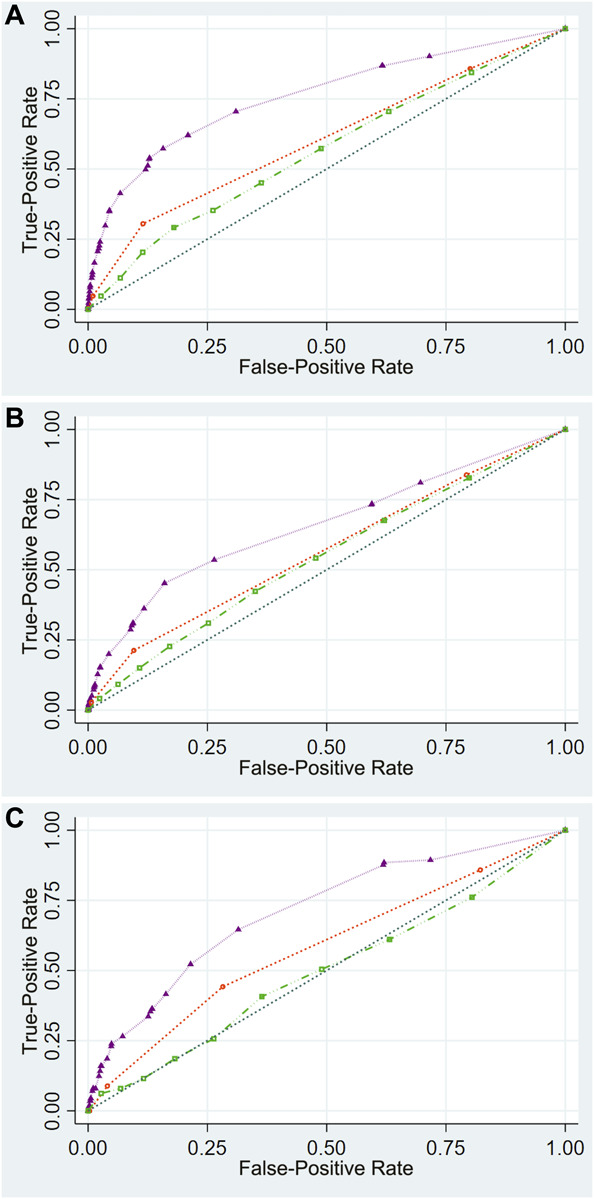
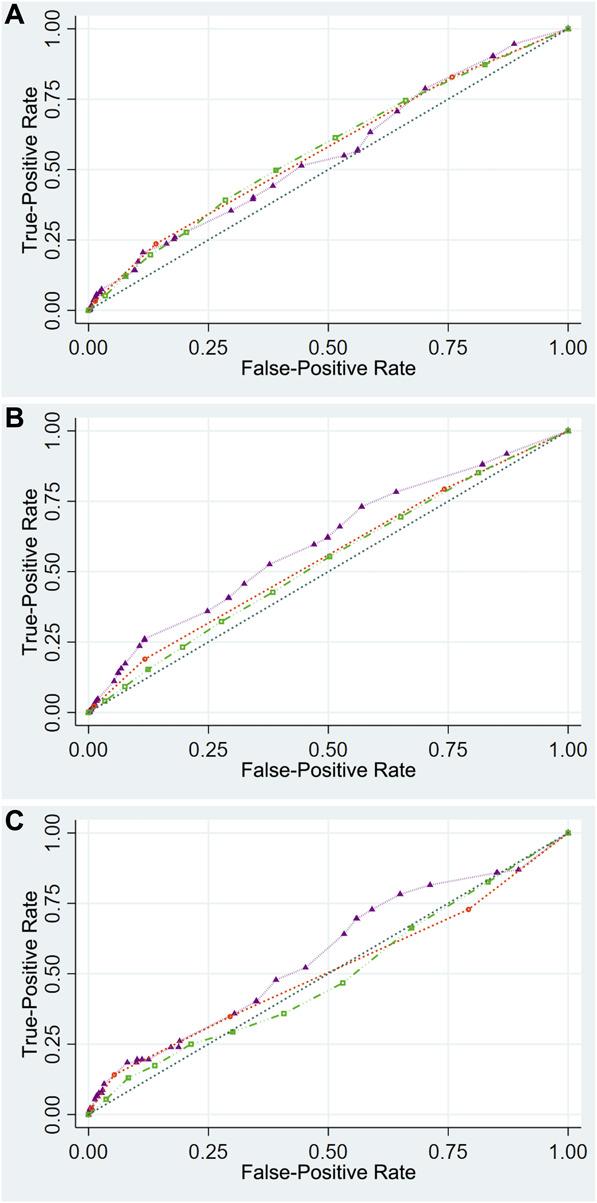
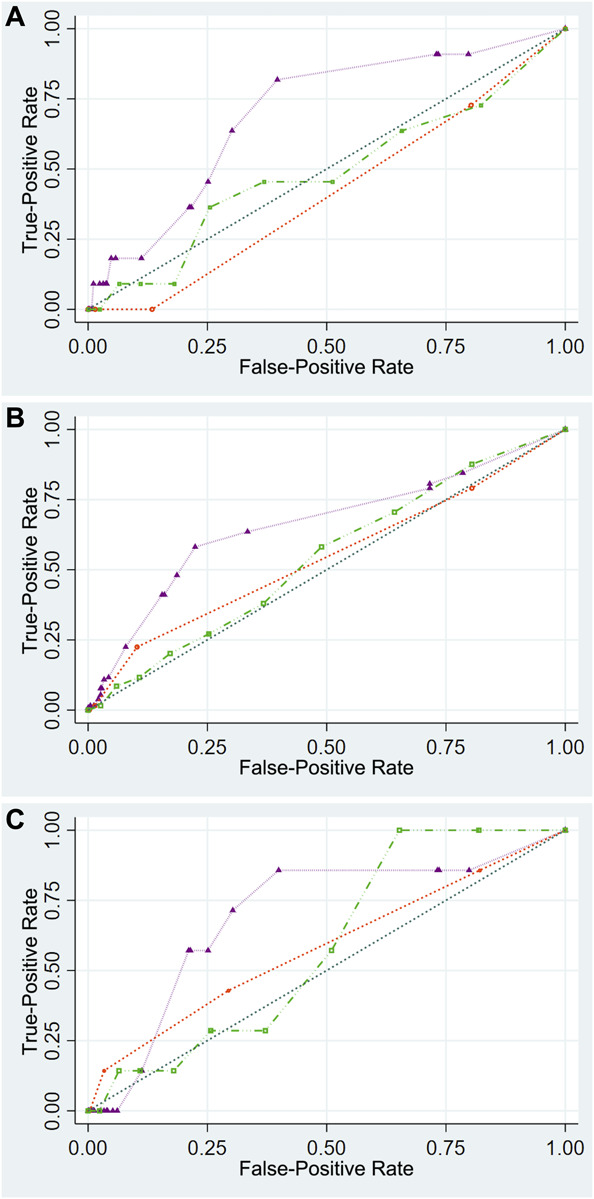
Clinical presentation: Octogenarian patients undergoing spine, cranial, and other procedures captured in the American College of Surgeons National Surgical Quality Improvement Program between 2012 and 2020 were included. We used receiver operating characteristic curve to examine discriminative thresholds of RAI, mFI-5, and increasing patient age. Multivariable analyses were performed. Our primary outcomes were 30-day mortality, extended length of stay (eLOS [≥75th percentile]), and continued inpatient care >30 days (pLOS). Secondary outcomes were skilled care facility (skilled nursing facility [SNF]) discharges and readmissions.
Discussion: In total, 20 710 octogenarians were included, with a mean age of 83 years (SD, 2.5) and a men (52.7%) and White (79.8%) majority. The RAI had higher predictive discriminative thresholds for 30-day mortality (C-statistic of 0.743), eLOS (C-statistic: 0.692), and pLOS (C-statistic: 0.697) compared with the mFI-5 (C-statistic: 0.574, 0.556, and 0.550, respectively), and increasing patient age (C-statistic: 0.577, 0.546, and 0.504, respectively), P < .001. On multivariable analyses, RAI showed a larger effect size with adverse postoperative outcomes by increasing frailty strata than mFI-5 and increasing patient age. Nonetheless RAI showed decreased risk for SNF discharges.
Conclusion: We found that RAI was a more accurate predictor than mFI-5 and increasing patient age for 30-day mortality, eLOS, and pLOS in octogenarian neurosurgery patients. More research is needed on RAI's performance in different specialized neurosurgical populations. Moreover, it is increasingly clear that comprehensive risk assessment strategies tailored to optimize perioperative care should be prioritized to potentially improve outcomes for this at-risk population.
Keywords: 30-day mortality; Frailty; Geriatrics; Length of stay; Modified frailty index; Postoperative outcomes; Risk analysis index.
© The Author(s) 2023. Published by Wolters Kluwer Health, Inc. on behalf of Congress of Neurological Surgeons.
Conflict of interest statement
The authors have no personal, financial, or institutional interest in any of the drugs, materials, or devices described in this article.
Figures
Similar articles
-
The risk analysis index demonstrates exceptional discrimination in predicting frailty's impact on neurosurgical length of stay quality metrics.World J Surg. 2024 Jan;48(1):59-71. doi: 10.1002/wjs.12020. Epub 2023 Dec 18. World J Surg. 2024. PMID: 38686751
-
The Weight of Frailty in Neurosurgery Patients: Analyzing the Combined Effect of Frailty and Body Mass Index on 30-Day Postoperative Mortality.World Neurosurg. 2024 Apr;184:e449-e459. doi: 10.1016/j.wneu.2024.01.145. Epub 2024 Feb 3. World Neurosurg. 2024. PMID: 38310945
-
A comprehensive analysis of the triad of frailty, aging, and obesity in spine surgery: the risk analysis index predicted 30-day mortality with superior discrimination.Spine J. 2023 Dec;23(12):1778-1789. doi: 10.1016/j.spinee.2023.08.008. Epub 2023 Aug 23. Spine J. 2023. PMID: 37625550
-
Comparison of the Risk Analysis Index and the modified 5-factor frailty index in predicting 30-day morbidity and mortality after spine surgery.J Neurosurg Spine. 2023 Apr 7;39(1):136-145. doi: 10.3171/2023.2.SPINE221019. Print 2023 Jul 1. J Neurosurg Spine. 2023. PMID: 37029672
-
Frailty impact on postoperative complications and early mortality rates in patients undergoing radical cystectomy for bladder cancer: a systematic review.Arab J Urol. 2020 Nov 2;19(1):9-23. doi: 10.1080/2090598X.2020.1841538. Arab J Urol. 2020. PMID: 33763244 Free PMC article. Review.
Cited by
-
Discriminatory Value of the Risk Analysis Index Versus the 5-Factor Modified Frailty Index for Major Outcome Measures in Degenerative Cervical Myelopathy.Global Spine J. 2025 Apr 29:21925682251339101. doi: 10.1177/21925682251339101. Online ahead of print. Global Spine J. 2025. PMID: 40300200 Free PMC article.
-
The risk analysis index as a predictor of 30-day mortality for elderly obese patients undergoing elective total joint arthroplasty.J Orthop. 2025 May 5;65:178-184. doi: 10.1016/j.jor.2025.05.009. eCollection 2025 Jul. J Orthop. 2025. PMID: 40487330
References
-
- United Nations, Department of Economic and Social Affairs, Population Division. World Population Ageing. 2019. Accessed 01/12/2023. https://www.un.org/en/development/desa/population/publications/pdf/agein...
-
- Rice DP, Fineman N. Economic implications of increased longevity in the United States. Annu Rev Public Health. 2004; 25(1):457-473. - PubMed
-
- Osborn R, Moulds D, Squires D, Doty MM, Anderson C. International survey of older adults finds shortcomings in access, coordination, and patient-centered care. Health Aff. 2014;33(12):2247-2255. - PubMed
-
- Bartels SJ, Naslund JA. The underside of the silver tsunami—older adults and mental health care. N Engl J Med. 2013;368(6):493-496. - PubMed
-
- Boyd CM, Darer J, Boult C, Fried LP, Boult L, Wu AW. Clinical practice guidelines and quality of care for older patients with multiple comorbid diseases implications for pay for performance. JAMA. 2005;294(6):716-724. - PubMed
LinkOut - more resources
Full Text Sources