The TRACERS Analyzer for Cusp Electrons
- PMID: 39958870
- PMCID: PMC11828801
- DOI: 10.1007/s11214-025-01147-9
The TRACERS Analyzer for Cusp Electrons
Abstract
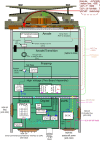
The Analyzer for Cusp Electrons (ACE) instruments on the Tandem Reconnection and Cusp Electrodynamics Reconnaissance Satellites (TRACERS) mission provide measurements of electron velocity distribution functions from two closely spaced spacecraft in a low Earth orbit that passes through the magnetospheric cusp. The precipitating and upward-going electrons provide a sensitive probe of the magnetic field line topology and electrostatic potential structure, as well as revealing dynamic processes. ACE measurements contribute to the top-level TRACERS goals of characterizing the spatial and temporal variation of magnetic reconnection at the terrestrial magnetopause and its relationship to dynamic structures in the cusp. ACE utilizes a classic hemispheric electrostatic analyzer on a spinning platform to provide full angular coverage with 10 degree by 7 degree resolution. ACE can measure electrons over an energy range of 20-13,500 electron volts, with fractional energy resolution of 19%. ACE provides 50 ms cadence measurements of the electron velocity distribution, enabling sub-kilometer spatial resolution of cusp boundaries and other structures.
Keywords: Electrons; Electrostatic analyzer; Magnetosphere; TRACERS mission.
© The Author(s) 2025.
Conflict of interest statement
Competing InterestsThe authors have no competing interests to declare that are relevant to the content of this article.
Figures


References
-
- Carlson CW, Curtis DW, Paschmann G, Michael W (1982) An instrument for rapidly measuring plasma distribution functions with high resolution. Adv Space Res 2(7):67–70. 10.1016/0273-1177(82)90151-X
-
- Chaston CC, Carlson CW, McFadden JP, Ergun RE, Strangeway RJ (2007) How important are dispersive Alfvén waves for auroral particle acceleration? Geophys Res Lett 34(7):L07101. 10.1029/2006GL029144
-
- Fuselier SA, Kletzing CA, Petrinec SM, Trattner KJ, George D, Bounds SR, Sawyer RP, Bonnell JW, Burch JL, Giles BL, Strangeway RJ (2022) Multiple reconnection X-lines at the magnetopause and overlapping cusp ion injections. J Geophys Res Space Phys 127(5):2022–030354. 10.1029/2022JA030354
-
- Halekas JS, Taylor ER, Dalton G, Johnson G, Curtis DW, McFadden JP, Mitchell DL, Lin RP, Jakosky BM (2015) The Solar Wind Ion Analyzer for MAVEN. Space Sci Rev 195(1–4):125–151. 10.1007/s11214-013-0029-z
-
- Kletzing CA, Hu S (2001) Alfvén wave generated electron time dispersion. Geophys Res Lett 28(4):693–696. 10.1029/2000GL012179
Publication types
Grants and funding
LinkOut - more resources
Full Text Sources
Miscellaneous
