. 2025 Jan 31:15:1506401.
doi: 10.3389/fphar.2024.1506401. eCollection 2024.

Mechanism of mTOR/RILP-regulated autophagic flux in increased susceptibility to myocardial ischemia-reperfusion in diabetic mice

Affiliations

Mechanism of mTOR/RILP-regulated autophagic flux in increased susceptibility to myocardial ischemia-reperfusion in diabetic mice

Jiyao Zhao et al. Front Pharmacol. .

Abstract

Background: The increased myocardial vulnerability that occurs in diabetic patients following an ischemia-reperfusion injury (I/RI) represents a significant perioperative safety risk. A comprehensive understanding of the intrinsic mechanisms underlying this phenomenon is therefore of paramount importance.

Purposes: The objective of this study is to investigate the potential mechanism of action between impaired autophagic flux and increased vulnerability in diabetic myocardium. This will provide a foundation for the clinical search for effective preventive and curative measures.

Methods: The transcriptomic alterations in autophagy-related genes following myocardial exposure to I/RI were analyzed by single-cell sequencing. This was followed by the validation of potential mechanisms of action between impaired autophagic flux and increased susceptibility at the cellular and animal levels, respectively.

Results: After I/RI in diabetic myocardium, there was a significant increase in the number of CM1 subgroups and a specific downregulation of 239 autophagy-related genes led by RILP. HE staining revealed that myocardial injury was exacerbated in diabetic mice subjected to I/RI. Transmission electron microscopy revealed that the accumulation of autophagic vesicles in cardiomyocytes of diabetic mice resulted in impaired autophagic flux. qRT-PCR revealed that the expression of RILP was significantly reduced in diabetic mice subjected to I/RI. WB showed that P62 was significantly increased and RILP was significantly decreased in diabetic mice subjected to I/RI compared to healthy mice. Inhibition of mTOR during hypoxia/reoxygenation (H/R) injury restored RILP expression and attenuated cellular injury in cardiomyocytes cultured with high glucose.

Conclusion: Following I/RI in diabetic myocardium, an increase in the CM1 subpopulation and a reduction in RILP expression result in impaired autophagic flux. Regulation of the mTOR/RILP pathway can restore impaired autophagic flux and improve myocardial vulnerability, thereby exerting cardioprotective effects.

Keywords: autophagic flux; diabetic cardiomyopathy; mTOR/RILP pathway; myocardial protection; vulnerability.


Conflict of interest statement

The authors declare that the research was conducted in the absence of any commercial or financial relationships that could be construed as a potential conflict of interest.

Figures

FIGURE 1
FIGURE 1
Flowchart of cellular experiments.
FIGURE 2
FIGURE 2
Single cell sequencing results. (A) t-SNE mapping of cardiac tissue in each group of mice. (B) Box plots of autophagy-related genes by cell subpopulation. (C) t-SNE mapping of cardiomyocyte subpopulations in various groups. (D) GSEA enrichment analysis of cardiomyocyte subpopulations in various groups. (E) GO enrichment analysis of differential genes between DM and DMI groups. (F) KEGG enrichment analysis of differential genes between DM and DMI groups. (G) Venn diagram of autophagy-related differential genes in normal and diabetic mice undergoing ischemia-reperfusion. (H) Volcano plot of differential genes between DM and DMI groups.
FIGURE 3
FIGURE 3
HE staining pictures and TEM pictures of heart tissues of various groups of mice. (A) HE staining of heart tissue from mice in the NM group, line segments represent 20 μm. (B) TEM picture of heart tissue from mice in the NM group, line segments represent 2 μm. (C) TEM picture of heart tissue from mice in the NM group, line segments represent 1 μm. (D) HE staining of heart tissue from mice in the NMI group, line segments represent 20 μm. (E) TEM picture of heart tissue from mice in the NMI group, line segments represent 2 μm. (F) TEM pictures of mouse heart tissue in NMI group, line segments represent 1 μm. (G) HE staining of mouse heart tissue in DM group, line segments represent 20 μm. (H) TEM pictures of mouse heart tissue in DM group, line segments represent 2 μm. (I) TEM pictures of mouse heart tissue in DM group, line segments represent 1 μm. (J) HE staining of mouse heart tissue in DMI group, line segments represent 20 μm. (K) Electron microscope picture of heart tissue of mice in DMI group, line segments represent 2 μm. (L) Electron microscope picture of heart tissue of mice in DMI group, line segments represent 1 μm. (Red arrows are autophagic lysosomes, blue arrows are intra-mitochondrial micro-autophagy, and yellow arrows are autophagic vesicles).
FIGURE 4
FIGURE 4
(A) q-PCR analysis of Rilp mRNA expression across different groups. (B) Immunoblotting results for RILP and P62. (C) Relative expression levels of RILP protein. (D) Relative expression levels of P62 protein. (*: P < 0.05, **: P < 0.01, ***: P < 0.001, ****: P < 0.0001).
FIGURE 5
FIGURE 5
(A) WB results for mTOR, RILP, LC3 and P62. (B) Relative expression levels of mTOR protein. (C) Relative expression levels of RILP protein. (D) The ratio of LC3II to LC3I. (E) Relative expression levels of P62 protein. (*: P < 0.05, **: P < 0.01, ***: P < 0.001, ****: P < 0.0001).
FIGURE 6
FIGURE 6
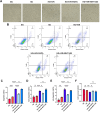
Myocardial cell injury. (A) Light micrographs of cardiomyocytes in each group (Bar = 10 um). (B) Flow cytometry detection of cell apoptosis in each group. (C) Cell apoptosis rate in each group. (D) Early apoptosis rate in each group. (E) Late apoptosis rate in each group. (F) Cell survival rate in each group. (*: P < 0.05,**: P < 0.01,***: P < 0.001,****: P < 0.0001).

References

    1. Amaya C., Militello R. D., Calligaris S. D., Colombo M. I. (2016). Rab24 interacts with the Rab7/Rab interacting lysosomal protein complex to regulate endosomal degradation. Traffic 17, 1181–1196. 10.1111/tra.12431 - DOI - PubMed
    1. Aniskevich S., Renew J. R., Chadha R. M., Irizarry-Alvarado J. M. (2017). Pharmacology and perioperative considerations for diabetes mellitus medications. Curr. Clin. Pharmacol. 12, 157–163. 10.2174/1574884712666170810115847 - DOI - PubMed
    1. Bosc C., Broin N., Fanjul M., Saland E., Farge T., Courdy C., et al. (2020). Autophagy regulates fatty acid availability for oxidative phosphorylation through mitochondria-endoplasmic reticulum contact sites. Nat. Commun. 11, 4056. 10.1038/s41467-020-17882-2 - DOI - PMC - PubMed
    1. Dewanjee S., Bhattacharjee N. (2018). MicroRNA: a new generation therapeutic target in diabetic nephropathy. Biochem. Pharmacol. 155, 32–47. 10.1016/j.bcp.2018.06.017 - DOI - PubMed
    1. GBD (2023). Global, regional, and national burden of diabetes from 1990 to 2021, with projections of prevalence to 2050: a systematic analysis for the Global Burden of Disease Study 2021. Lancet 402, 203–234. 10.1016/S0140-6736(23)01301-6 - DOI - PMC - PubMed

LinkOut - more resources