. 2025 Feb 10:18:1969-1991.
doi: 10.2147/JIR.S504480. eCollection 2025.

Identification of Potential Diagnostic Biomarkers of Carotid Atherosclerosis in Obese Populations

Affiliations

Identification of Potential Diagnostic Biomarkers of Carotid Atherosclerosis in Obese Populations

Xize Wu et al. J Inflamm Res. .

Abstract

Objective: This study aimed to investigate the potential mechanisms and biomarkers between Obesity (OB) and carotid atherosclerosis (CAS).

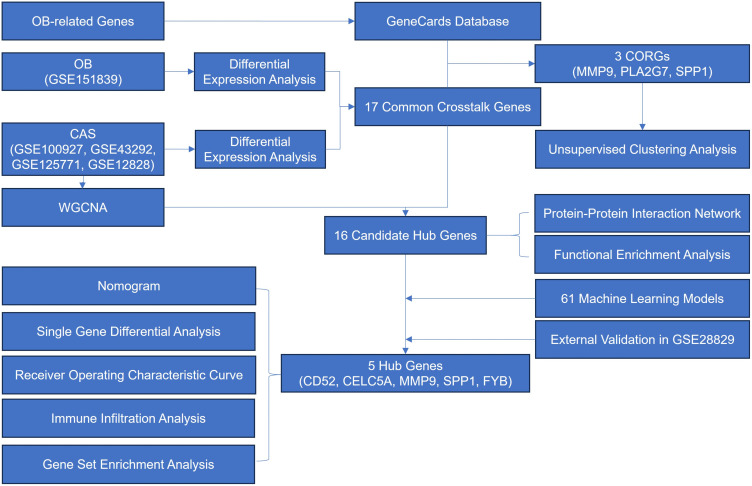
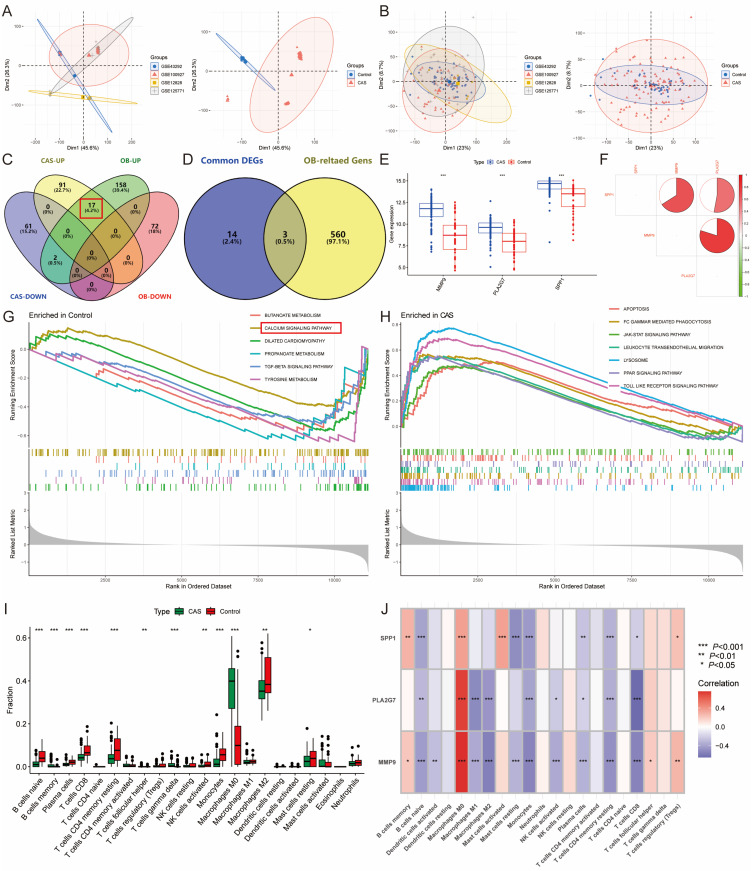
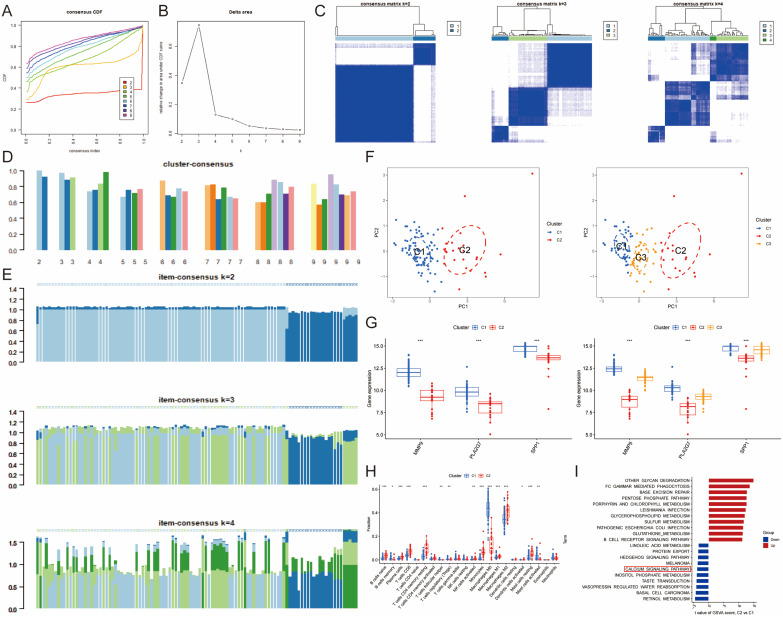
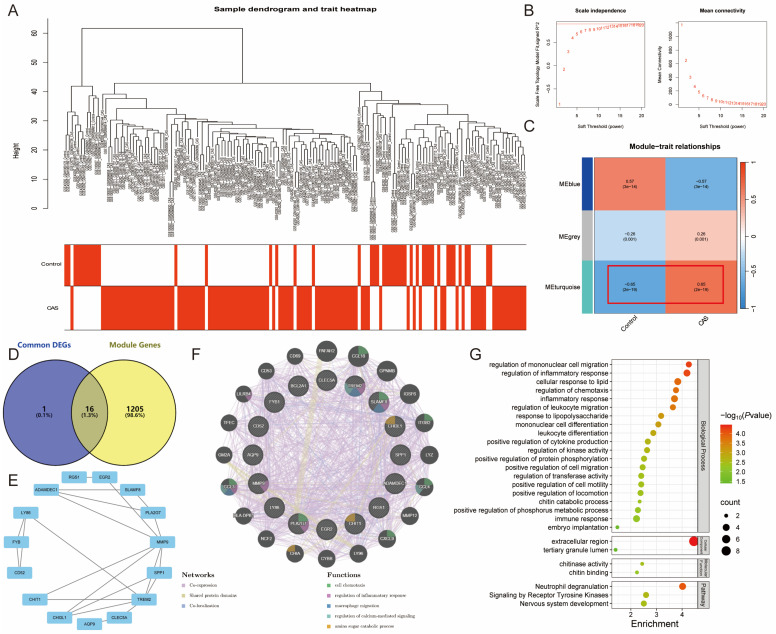
Methods: The GSE12828, GSE125771, GSE43292, and GSE100927 datasets were combined and normalized to obtain CAS-related differentially expressed genes (DEGs), and OB-related DEGs were obtained from the GSE151839 dataset and the GeneCards database. Unsupervised cluster analysis was conducted on CAS samples based on the DEGs of CAS and OB. Subsequently, immune infiltration analysis and gene set enrichment analysis (GESA) were performed. 61 machine learning models were developed to screen for Hub genes. The Single-gene GESA focused on calcium signaling pathway-related genes (CaRGs). Finally, high-fat diet-fed C57BL/6J ApoE-/- mice were used for in vivo validation.

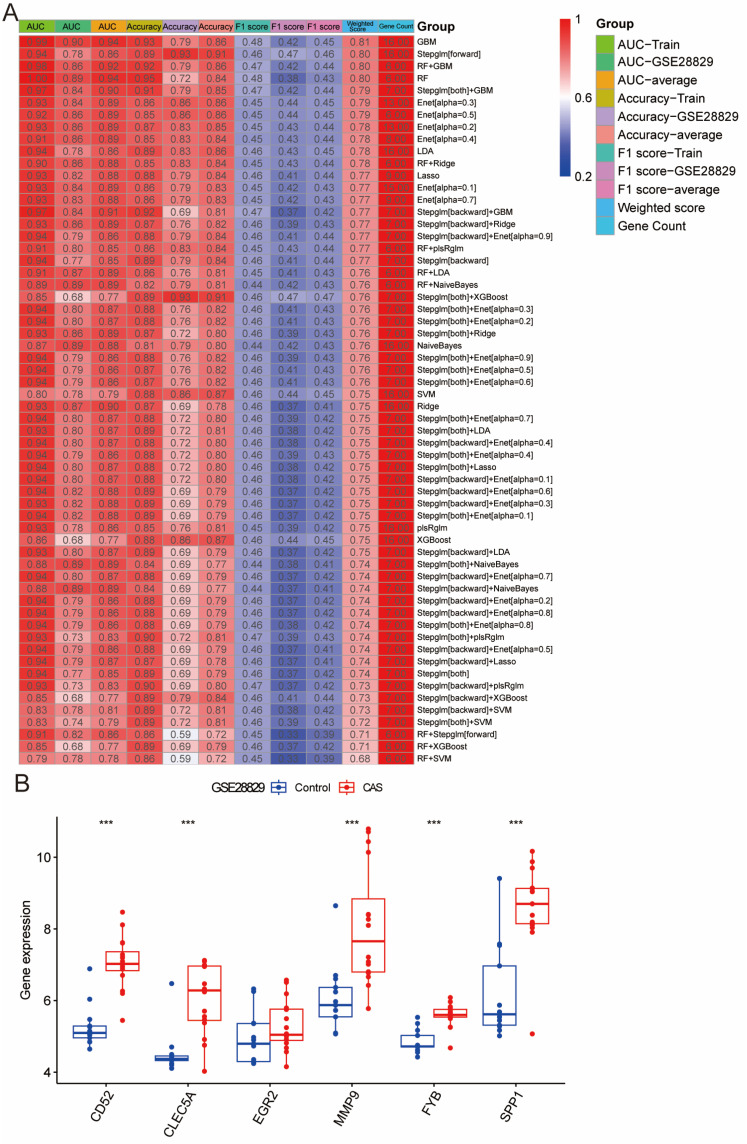
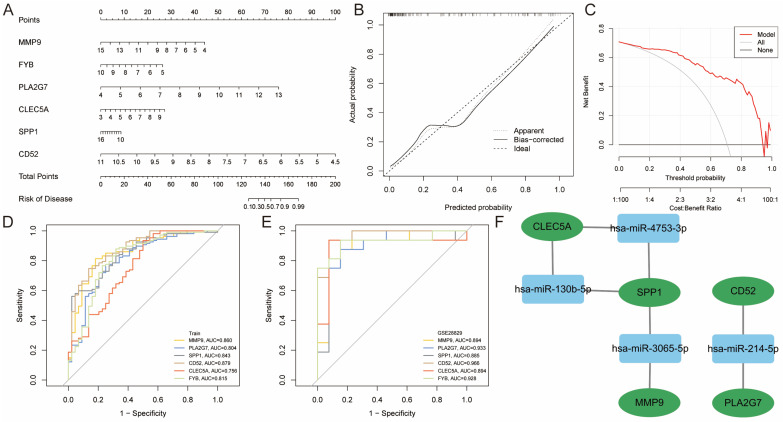
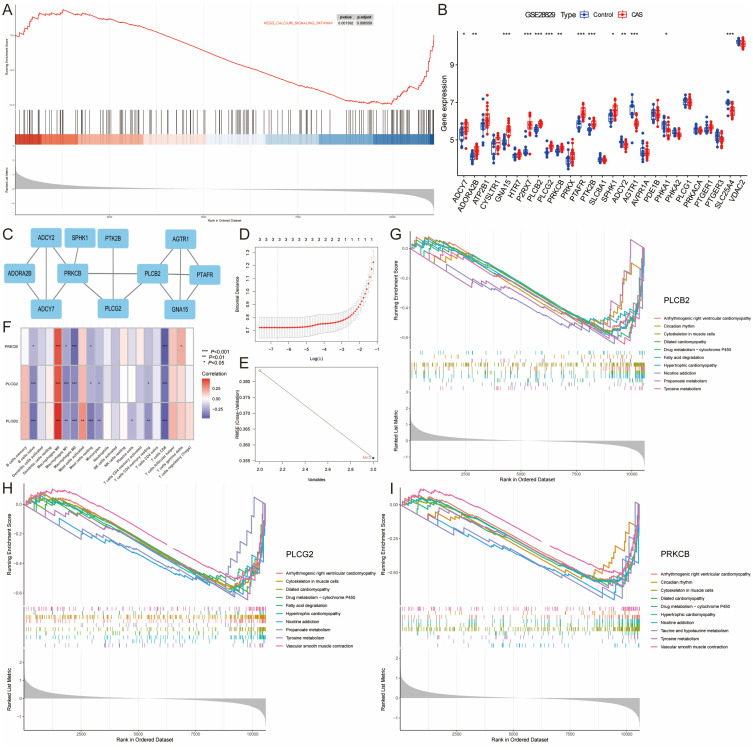
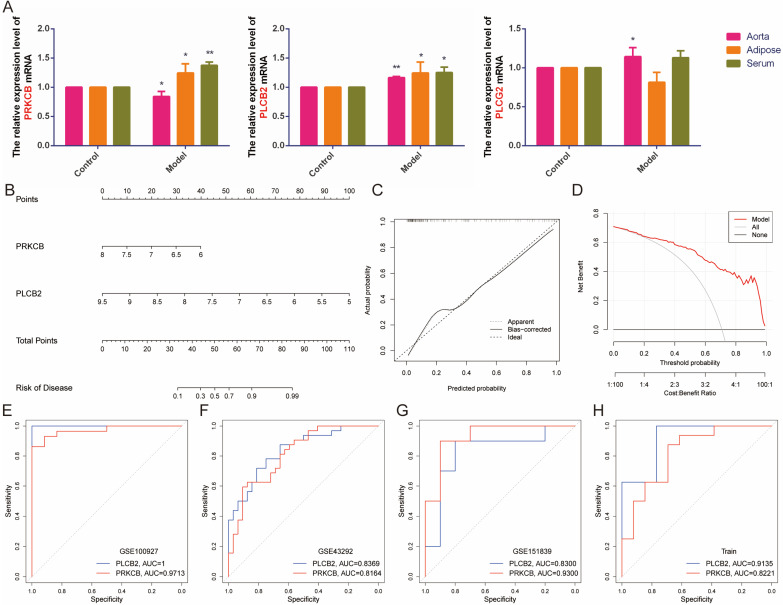
Results: MMP9, PLA2G7, and SPP1 as regulators of the immune infiltration microenvironment in OB patients with CAS, and stratified CAS samples into subtypes with differences in metabolic pathways based on OB classification. Enrichment analysis indicated abnormalities in immune and inflammatory responses, the calcium signaling, and lipid response in obese CAS patients. The RF+GBM model identified CD52, CLEC5A, MMP9, and SPP1 as Hub genes. 15 CaRGs were up-regulated, and 12 were down-regulated in CAS and OB. PLCB2, PRKCB, and PLCG2 were identified as key genes in the calcium signaling pathway associated with immune cell infiltration. In vivo experiments showed that MMP9, PLA2G7, CD52, SPP1, FYB, and PLCB2 mRNA levels were up-regulated in adipose, aortic tissues and serum of OB and AS model mice, CLEC5A was up-regulated in aorta and serum, and PRKCB was up-regulated in adipose and serum.

Conclusion: MMP9, PLA2G7, CD52, CLEC5A, SPP1, and FYB may serve as potential diagnostic biomarkers for CAS in obese populations. PLCB2 and PRKCB are key genes in the calcium signaling pathway in OB and CAS. These findings offer new insights into clinical management and therapeutic strategies for CAS in obese individuals.

Keywords: bioinformatics; calcium signaling pathway; carotid atherosclerosis; machine learning model; obesity; unsupervised clustering analysis.


Conflict of interest statement

The authors report no conflicts of interest in this work.

Figures

Figure 1
Figure 1
Flow chart of this study.
Figure 2
Figure 2
Identification of CAS differentially expressed genes (DEGs) by differential expression analysis. (A). The principal component analysis (PCA) of the four datasets and clinical characteristics. (B). The PCA of the combined dataset and clinical characteristics. (C). Venn diagram showing 17 common DEGs of CAS and OB. (D). Venn diagram showing 3 CAS and OB co-related DEGs (CORGs). (E). Boxplot showing the differential expression of CORGs in CAS. (F). Correlation analysis between CORGs. (G and H). The GSEA for CAS (G) and control (H) samples. (I). Boxplot showing differences in immune infiltration between CAS and control groups. (J). Correlation analysis of the CORGs with infiltrating immune cells. *P<0.05, **P<0.01, ***P<0.001.
Figure 3
Figure 3
Identification of obesity-related molecular clusters in CAS patients. (A-B). Representative (A) cumulative distribution function (CDF) curves and (B) delta area curves. (C). Consensus clustering matrix when k=2, 3, and 4. (D). cluster-consensus plot. (E). The item-consensus plot when k=2, 3, and 4. (F). The PCA showing subtype distribution when k=2 and 3. (G). The boxplot of expression levels of the 3 CORGs between the two and three obesity molecular clusters. (H). Comparison of immune cell infiltration between two clusters. (I). The GSVA analysis of C1 and C2 clusters. *P<0.05, **P<0.01, ***P<0.001.
Figure 4
Figure 4
Identification and enrichment analysis of candidate Hub genes. (A). The sample clustering plot of all samples after removing outlier samples. (B). Soft threshold selection 15. (C). Module genes related to CAS traits. (D). Venn diagram showing 16 candidate Hub genes. (E and F). PPI network of candidate Hub genes. (G). The pathway, biological process, cellular component, and molecular function enrichment analysis of candidate Hub genes.
Figure 5
Figure 5
Construction and assessment of machine learning models. (A). Construction of 61 machine learning models to screen for hub genes. The best models were screened based on AUC values, accuracy, F1 scores, and gene counts. (B). Single-gene differential analysis was performed in the validation set GSE28829 to screen for Hub genes. ***P<0.001.
Figure 6
Figure 6
In vivo experiments to verify Hub gene expression. (A). HE and ORO pathological staining of aorta (n=6, bar=100μm). (B). The relative expression level of MMP9, PLA2G7, CD52, CLEC5A, SPP1, and FYB genes (n=6). *P<0.05 vs the Control group, **P<0.01 vs the Control group.
Figure 7
Figure 7
Construction and validation of nomogram to predict the risk of developing CAS in obese population. (A). Construction of a nomogram based on the Hub gene’s RF+GBM model. (B and C). Construction of a (B) calibration curve and (C) decision curve analysis for assessing the predictive efficiency of the nomogram model. (D and E). The (D) internal and (E) external validation of ROC curves for diagnostic efficacy of Hub genes. (F). “miRNA-mRNA (Hub genes)” network.
Figure 8
Figure 8
Identification and enrichment analysis of CaRGs. (A). GSEA analysis of the calcium signaling pathways. (B). CAS-related external dataset GSE28829 validates the expression of CaRGs. (C). PPI network of CARGs. (D). LASSO regression screening for characterized genes. (E). SVM-REF algorithm to screen the most suitable key genes. (F). Correlation analysis of the CaRGs with infiltrating immune cells. (G-I). Single-gene GESA for the PLCB2-high, PRKCB-high, and PLCG2-high subgroups. *P<0.05, **P<0.01, ***P<0.001.
Figure 9
Figure 9
Construction of nomogram based on CaRGs to predict the risk of developing OB and CAS. (A). The relative expression level of PRKCB, PLCB2, and PLCG2 genes (n=6). *P<0.05 vs the Control group, **P<0.01 vs the Control group. (B). Construction of a nomogram for predicting the risk of OB and CAS based on CaRGs. (C and D). Construction of a (C) calibration curve and (D) decision curve analysis for assessing the predictive efficiency of the nomogram model. (E-H). ROC curves were used for internal validation on CAS-related datasets (E) GSE100927 and (F) GSE43292 and OB-related dataset (G) GSE151839 and for external validation on CAS-related dataset (H) GSE28829.

Similar articles

References

    1. Jastreboff AM, Kotz CM, Kahan S, Kelly AS, Heymsfield SB. Obesity as a disease: the obesity society 2018 position statement. Obesity. 2019;27(1):7–9. doi:10.1002/oby.22378 - DOI - PubMed
    1. The National Health Commission’s bureau of disease prevention and control. Report on the Nutrition and Chronic Disease Status of Chinese Residents. Acta Nutrimenta Sinica. 2020;42(6):521.
    1. Bray GA, Heisel WE, Afshin A, et al. The science of obesity management: an endocrine society scientific statement. Endocr Rev. 2018;39(2):79–132. doi:10.1210/er.2017-00253 - DOI - PMC - PubMed
    1. Libby P. The changing landscape of atherosclerosis. Nature. 2021;592(7855):524–533. doi:10.1038/s41586-021-03392-8 - DOI - PubMed
    1. Marini S, Merino J, Montgomery BE, et al. Mendelian randomization study of obesity and cerebrovascular disease. Ann Neurol. 2020;87(4):516–524. doi:10.1002/ana.25686 - DOI - PMC - PubMed

LinkOut - more resources