

Therapeutic drug monitoring and immunogenetic factors associated with the use of adalimumab in Crohn's disease patients
- PMID: 39959979
- PMCID: PMC11831650
- DOI: 10.1177/03946320251319379
Therapeutic drug monitoring and immunogenetic factors associated with the use of adalimumab in Crohn's disease patients
Abstract
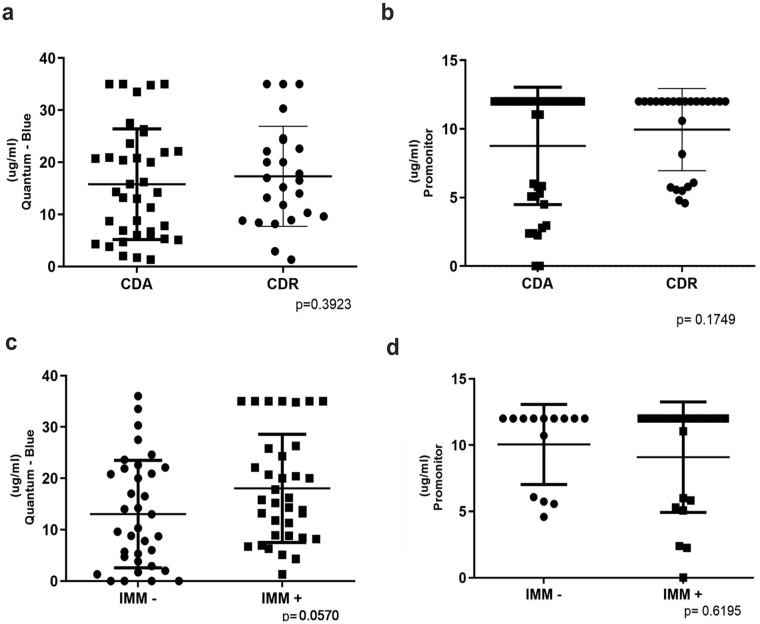
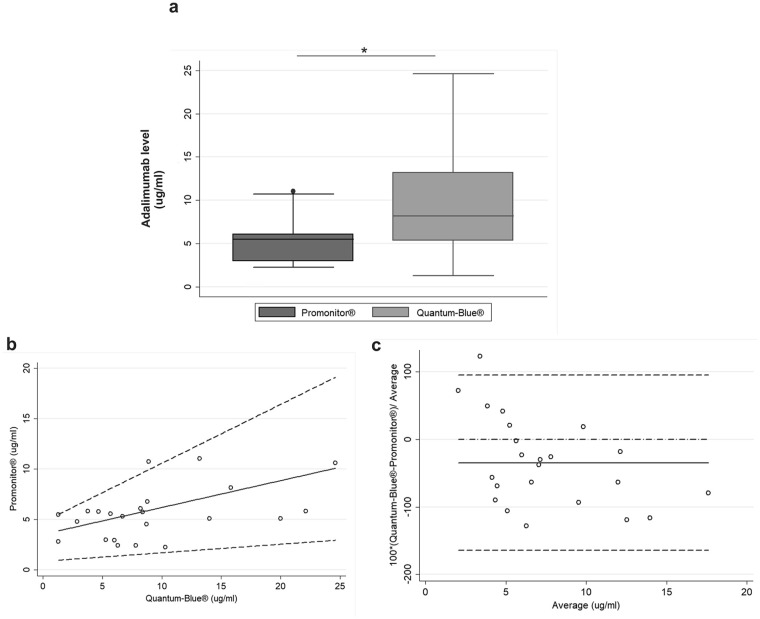
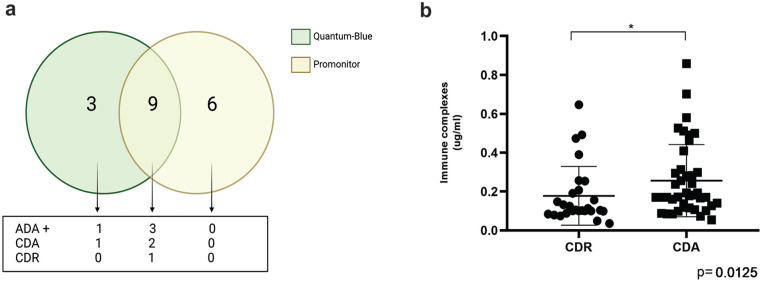
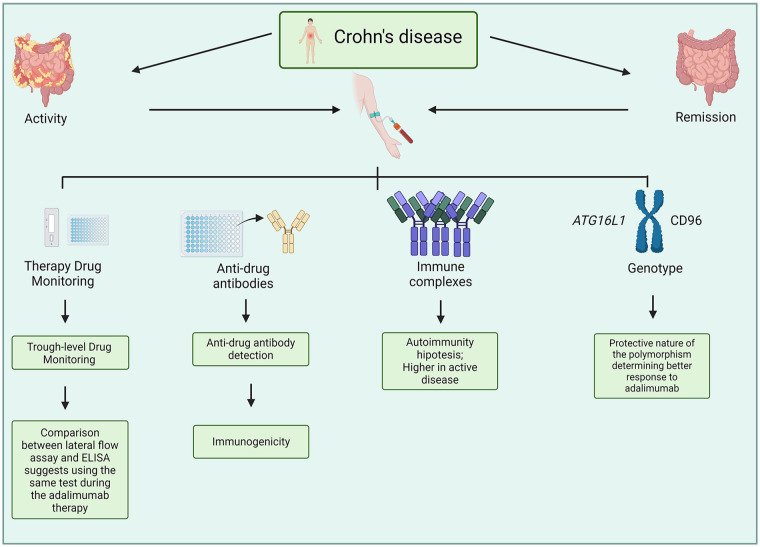
Crohn's disease (CD) involves immune system interactions with intestinal tissue, driven by pro-inflammatory cytokines like Tumor Necrosis Factor (TNF-α). Adalimumab, targeting TNF-α, regulates associated inflammatory responses. Despite being humanized, it may induce immunogenic processes, affecting treatment effectiveness. Thus, monitoring serum adalimumab and anti-drug antibody (ADA) levels can optimize therapy. Understanding genetic factors influencing adalimumab response can enhance personalized treatment and improve patient quality of life. We aimed to quantify adalimumab serum levels, assess test interchangeability, detect ADA, examine immune complex formation, and investigate genetic phenotypes related to immunogenicity in CD patients. Seventy CD patients in the maintenance phase with adalimumab were classified into active (CDA) and remission (CDR) groups. Adalimumab concentration was determined via enzyme-linked immunosorbent assay (ELISA-Promonitor) and lateral flow assay (Quantum Blue), with assay interchangeability assessed statistically. ADA and immune complex formation were quantified using ELISA assays. DNA was genotyped for the genes ATG16L1, CD96, and CD155. No significant differences in adalimumab serum concentrations were observed between groups, regardless of the assay. However, a statistical difference between the tests indicated measurement disparity (P = 0.003), with moderate agreement (Lin's correlation of 0.247). ADA was detected in 4 of 27 of the patients with infratherapeutic levels, 3 in the CDA group and 1 in the CDR group. Analysis of immune complexes revealed significantly higher concentrations in the CDA group (P = 0.0125). The genotypic evaluation revealed significant associations for the CD96 CC (wild-type) genotype with higher CRP levels, colonic involvement, and infratherapeutic levels of adalimumab. ATG16L1 CC genotype was associated with higher CDEIS and fecal calprotectin values, while the variant (TT) genotype had lower platelet counts. The effectiveness of treatment with adalimumab was not directly related to higher medication levels in this cohort. The disparity between tests indicates the need to use only one test in patient follow-up to ensure accuracy in therapeutic monitoring. Genotypic differences highlight the correlation between the wild genotype for CD96 and ATG16L1 with unfavorable laboratory and endoscopic response to adalimumab. Finally, the more significant levels of immune complexes in the CDA group indicate an association with a worse response to adalimumab.
Keywords: Crohn’s disease; drug monitoring; immunogenetics; serum levels.
Conflict of interest statement
Declaration of conflicting interestsThe author(s) declared no potential conflicts of interest with respect to the research, authorship, and/or publication of this article.
Figures
Similar articles
-
Anti-TNF Therapeutic Drug Monitoring in Postoperative Crohn's Disease.J Crohns Colitis. 2018 May 25;12(6):653-661. doi: 10.1093/ecco-jcc/jjy003. J Crohns Colitis. 2018. PMID: 29385469
-
Adalimumab trough serum levels and anti-adalimumab antibodies in the long-term clinical outcome of patients with Crohn's disease.Scand J Gastroenterol. 2016 Sep;51(9):1081-6. doi: 10.3109/00365521.2016.1157894. Epub 2016 May 20. Scand J Gastroenterol. 2016. PMID: 27207330
-
Proactive Monitoring of Adalimumab Trough Concentration Associated With Increased Clinical Remission in Children With Crohn's Disease Compared With Reactive Monitoring.Gastroenterology. 2019 Oct;157(4):985-996.e2. doi: 10.1053/j.gastro.2019.06.003. Epub 2019 Jun 10. Gastroenterology. 2019. PMID: 31194979 Clinical Trial.
-
Clinical effectiveness and cost-effectiveness of use of therapeutic monitoring of tumour necrosis factor alpha (TNF-α) inhibitors [LISA-TRACKER® enzyme-linked immunosorbent assay (ELISA) kits, TNF-α-Blocker ELISA kits and Promonitor® ELISA kits] versus standard care in patients with Crohn's disease: systematic reviews and economic modelling.Health Technol Assess. 2016 Nov;20(83):1-288. doi: 10.3310/hta20830. Health Technol Assess. 2016. PMID: 27845027 Free PMC article. Review.
-
Adalimumab for maintenance of remission in Crohn's disease.Cochrane Database Syst Rev. 2020 May 16;5(5):CD012877. doi: 10.1002/14651858.CD012877.pub2. Cochrane Database Syst Rev. 2020. PMID: 32413933 Free PMC article.
References
-
- Xavier RJ, Podolsky DK. (2007) Unravelling the pathogenesis of inflammatory bowel disease. Nature 448: 427–434. - PubMed
-
- Esaki M, Sakata Y. (2023) Clinical impact of endoscopic evaluation of the small bowel in Crohn’s disease. Digestion 104: 51–57. - PubMed
-
- Neurath MF, Vieth M. (2023) Different levels of healing in inflammatory bowel diseases: Mucosal, histological, transmural, barrier and complete healing. Gut 72: 2164–2183. - PubMed
-
- Turner D, Ricciuto A, Lewis A, et al.. (2021) STRIDE-II: An update on the selecting therapeutic targets in inflammatory bowel disease (STRIDE) initiative of the international organization for the study of IBD (IOIBD): Determining therapeutic goals for treat-to-target strategies in IBD. Gastroenterology 160: 1570–1583. - PubMed
MeSH terms
Substances
LinkOut - more resources
Full Text Sources
Medical
Research Materials
Miscellaneous
