. 2025 Apr 2;15(4):702-716.
doi: 10.1158/2159-8290.CD-23-1319.

High Glucose Contribution to the TCA Cycle Is a Feature of Aggressive Non-Small Cell Lung Cancer in Patients

Affiliations

High Glucose Contribution to the TCA Cycle Is a Feature of Aggressive Non-Small Cell Lung Cancer in Patients

Ling Cai et al. Cancer Discov. .

Abstract

Intraoperative 13C-glucose infusions in patients with NSCLC show that tumors with high labeling of TCA cycle intermediates progress rapidly, resulting in metastasis and early death. Blocking this pathway suppresses metastasis of human NSCLC cells in mice.


Conflict of interest statement

N.G. Hammond reports grants from the NCI during the conduct of the study. R.B. Cameron reports personal fees from MJH Life Sciences outside the submitted work. A. Kaushik reports other support from Pfizer outside the submitted work. A.D. Rao reports other support from MSD outside the submitted work. J.D. Minna reports grants from the NCI during the conduct of the study and personal fees from the NIH and the University of Texas Southwestern Medical Center outside the submitted work. J. Waters reports personal fees from AstraZeneca outside the submitted work, and his wife is a paid consultant for Gore Medical and leads an industry-sponsored clinical trial in peripheral arterial disease. B. Faubert reports grants from the NCI and the Cancer Research Foundation during the conduct of the study. R.J. DeBerardinis reports personal fees from Agios Pharmaceuticals, Atavistik Bio, and Vida Ventures outside the submitted work. No disclosures were reported by the other authors.

Figures

Figure 1.
Figure 1.
13C enrichment in the TCA cycle distinguishes tumors but not benign pulmonary lesions from the adjacent lung. A, Summary of patients with pulmonary lesions. B, Schematic of labeling from [U-13C]glucose, including glycolysis and multiple turns of the TCA cycle. C–E,13C enrichment comparisons between each lesion type and the adjacent lung. The sum of isotopologues of each metabolite is normalized to the corresponding metabolite enrichment in the adjacent lung. Each dot represents one patient. (C) Primary NSCLC tissues (n = 64; two additional patients with NSCLC provided tumor but not adjacent lung tissue and are not included in this analysis), (D) benign lesions (n = 7), and (E) metastatic tumors (n = 10). F, Spearman correlation analysis of 13C enrichment values between TCA cycle metabolites in each tissue type. Values from each sample (blue: lung; red: NSCLC tumor) are plotted to compare labeling between each pair of metabolites. G, Correlations between M+1 and M+2 isotopologues in NSCLC tumors (red) and adjacent lungs (blue). Data are mean ± SD. Statistical significance was assessed using t tests to compare tissue types. Significance in CE was calculated with the Wilcoxon signed-rank test. Multiple comparisons were adjusted using the Holm-Sidak method. 3PG, 3-phosphoglycerate; AcCoA, acetyl-CoA; CS, citrate synthase; Lac, lactate; OAA, oxaloacetate; PDH, pyruvate dehydrogenase; PEP, phosphoenolpyruvate; Pyr, pyruvate. *,P<0.05; **,P<0.01; ***, P<0.001; ****, P<0.0001.
Figure 2.
Figure 2.
Cancer cells drive an OXPHOS expression signature in tumors. A, Heatmap of TCA cycle and ETC transcript differences between primary NSCLC and adjacent lung samples. B, RNA scores comparing matched tumor and adjacent lung for the pathways indicated. C, Single-cell RNA-seq data from GSE131907. OXPHOS scores were calculated as the mean expression of OXPHOS genes for each cell type, derived from tumor samples (red) or adjacent lung samples (blue). D, Single-cell RNA-seq data from GSE123902. OXPHOS scores were calculated as in C for each cell type, derived from nonmalignant lung tissue (blue), primary NSCLC tumors (red), or metastatic lesions (orange). E, Distribution of OXPHOS expression scores among epithelial cells from each sample type. F, Relative SDs of OXPHOS scores among epithelial cells from each sample type. Patient-matched normal lung (nLung) and NSCLC tumors (tLung) are connected by lines. Other sample types in E and F are tumors from late-stage biopsy (tL/B), metastatic lymph node (mLN), and brain metastases (mBrain). Breg, Regulatory B cell; MDSC, myeloid-derived suppressor cell; Prolif. mesen. prog., proliferating mesenchymal progenitor cell; Treg, regulatory T cell; Th, helper T cell; Tm, memory T cell; NK, natural killer cell; NKT, natural killer T cell.
Figure 3.
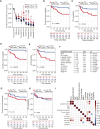
Figure 3.
Increased 13C enrichment in the TCA cycle predicts reduced survival. A,13C enrichment in the adjacent lung and tumors with high or low TCA cycle labeling. Fractional enrichments of glycolytic (M+3) and TCA cycle (M+2) metabolites are normalized to enrichment of glucose (M+6) within the tissue. B and C, Overall (B) and recurrence-free (C) survival in patients whose tumors have high or low TCA cycle labeling. The groups include tumors above or below the median for total 13C enrichment in citrate, glutamate, and malate. D and E, Overall (D) and recurrence-free (E) survival in patients whose tumors have high or low M+2 enrichment. F,13C labeling and clinical factors and relationship to overall survival. G and H, TCA cycle labeling fractions in the adjacent lung (calculated and grouped as in B and C) do not correlate with overall (G) or recurrence-free (H) survival. I, Spearman correlation analysis of labeling features (M+2 and labeled fraction) with clinical metrics. Differences in 13C enrichment (A) were determined using a Kruskal–Wallis test with Dunn’s test. Survival differences were assessed by the log-rank (Mantel–Cox) test. BMI, body mass index; MIB-1, Mindbomb Homolog-1; SUVmax, maximum FDG-PET standardized uptake value; TLG 40%, total lesion glycolysis, 40% threshold; AUC120, total area under the curve at 120 seconds, calculated from dynamic contrast-enhanced MRI; N positive, lymph node positive. *,P<0.05; **,P<0.01; ****, P<0.0001. (High TCA vs Adj. Lung), #, P<0.05; ##, P<0.01.; ###, P<0.001) (Low TCA vs. Adj. Lung)
Figure 4.
Figure 4.
PDXs derived from primary NSCLC retain histological, molecular, and metabolic characteristics. A and B, Summary of histological and molecular characterization of donor tumors (A) and PDX models (B). C, H&E staining of NSCLC PDXs. D, Engraftment success of primary NSCLCs and lung metastases considering the metabolic phenotype of the patient’s tumor. “High” and “low” TCA cycle enrichment was defined in Fig. 3B and C. E, Patient samples (lung, n = 64; primary NSCLC, n = 66) are plotted from Fig. 1C. Mice bearing NSCLC PDXs (mx57, n = 8; mx73, n = 6; mx95, n = 3; mx148, n = 3) were infused with [U-13C]glucose. Average TCA cycle enrichment was calculated and compared with primary NSCLC and adjacent lung tissue. Differences in enrichment were determined by a Kruskal–Wallis test with Dunn’s test. Data are expressed as average and SD. ADC, adenocarcinoma; NS, not statistically significant; Pleo, pleomorphic; SQCC, squamous cell carcinoma. Scale bar, 200 μm. ****, P<0.0001. NS, not significant.
Figure 5.
Figure 5.
PDXs generated from primary NSCLCs spontaneously metastasize in NSG mice. A, Flow cytometry analysis of lung tissue from a mouse engrafted with mx73. Cells were stained with mouse lineage markers (CD45, CD31, and TER119) and HLA. B, Bioluminescence of mouse lungs bearing metastases from mx73. C, IHC staining for Ki67-positive cells in lung metastasis from mx148. D, Percentage of HLA-ABC–expressing cells detected in the lungs of mice bearing NSCLC PDXs. Each dot represents one mouse. Data are expressed as average and SD. The numerator and denominator reflect the number of mice with detectable HLA-ABC–expressing cells in the lung and the number of PDX-bearing mice analyzed, respectively. E, CT scans of brain metastases in patients 73 and 148. Yellow arrowheads indicate metastatic lesions. F, Flow cytometry analysis of mouse brains with metastatic cells from PDX mx73 (left) and PDX mx148 (right). G, H&E staining and IHC for CK7 in subcutaneous tumors and brains of mice bearing PDX mx73 (left) and PDX mx148 (right). H, Representative bioluminescence images of brains of mice with subcutaneous mx73 and mx148 PDXs. I, Summary of brain metastases observed in NSCLC PDXs. J, Representative bioluminescence images of liver metastases. K, Summary of liver metastasis in NSCLC PDXs. All data are expressed as average and SD. NT, not tested; SQ, subcutaneous.
Figure 6.
Figure 6.
Inhibition of complex I with IACS-010759 limits metastasis in NSCLC PDXs. A and B, Tumor-bearing mice were treated daily with DMSO or IACS-010759 (5 mg/kg) by oral gavage for 3–4 weeks and then infused with [U-13C]glucose for 3 hours. Overall TCA cycle enrichment was calculated as the sum of isotopologues of citrate, malate, and glutamate and compared between DMSO- and IACS-010759–treated groups. C and D, Subcutaneous tumor volume calculated as (L × W2)/2. Each line represents the growth pattern of an individual tumor. E, Flow cytometry analysis of circulating tumor cells in the blood of mice engrafted with mx148. Cells were assessed for hCD45 and HLA. F and G, Lung and brain metastases from mx148 were evaluated by flow cytometry for mouse lineage markers and hCD45 and HLA. H, Metastatic burden in the lung from mx73 was assessed by flow cytometry, as above. I, Bioluminescence measurements of lung metastases. Representative BLI image (left) and quantitation (right) are displayed. J, Metastatic burden in the brain from mx73 was measured by flow cytometry. K, Schematic of the survival surgery approach to assess the impact of IACS-010759 on established metastases. L, Measurement of axillary lymph nodes containing macrometastases. M, Representative bioluminescence images of axillary lymph nodes. N and O, Metastatic burden in the lung (N) and brain (O) at the time of resection of the subcutaneous tumor (baseline) and after 2.5 weeks of treatment with DMSO or IACS-010759 subsequent to tumor resection. All data are expressed as average and SD. Statistical significance was assessed using Mann–Whitney or t tests to compare treatment groups. The number of mice tested and the number of mice with measurable metastases are indicated in each graph. CTCs, circulating tumor cells; LN, lymph node. *, P<0.05; **, P<0.01. NS, not significant.

References

    1. Pavlova NN, Zhu J, Thompson CB. The hallmarks of cancer metabolism: still emerging. Cell Metab 2022;34:355–77. - PMC - PubMed
    1. DeBerardinis RJ, Chandel NS. Fundamentals of cancer metabolism. Sci Adv 2016;2:e1600200. - PMC - PubMed
    1. Elia I, Doglioni G, Fendt SM. Metabolic hallmarks of metastasis formation. Trends Cell Biol 2018;28:673–84. - PubMed
    1. Faubert B, Solmonson A, DeBerardinis RJ. Metabolic reprogramming and cancer progression. Science 2020;368:eaaw5473. - PMC - PubMed
    1. Martínez-Reyes I, Chandel NS. Mitochondrial TCA cycle metabolites control physiology and disease. Nat Commun 2020;11:102. - PMC - PubMed