. 2025 Feb 17:12:RP87930.
doi: 10.7554/eLife.87930.

De novo identification of universal cell mechanics gene signatures

Affiliations

De novo identification of universal cell mechanics gene signatures

Marta Urbanska et al. Elife. .

Abstract

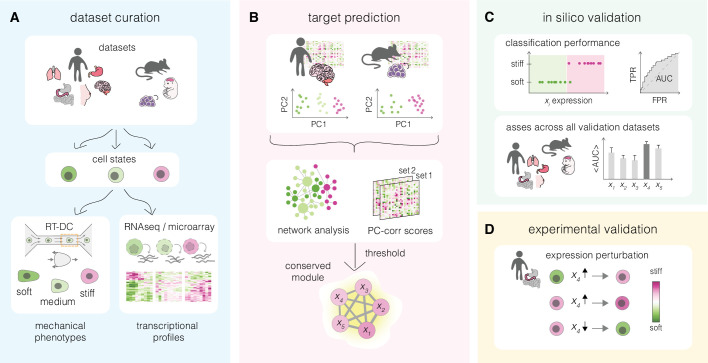
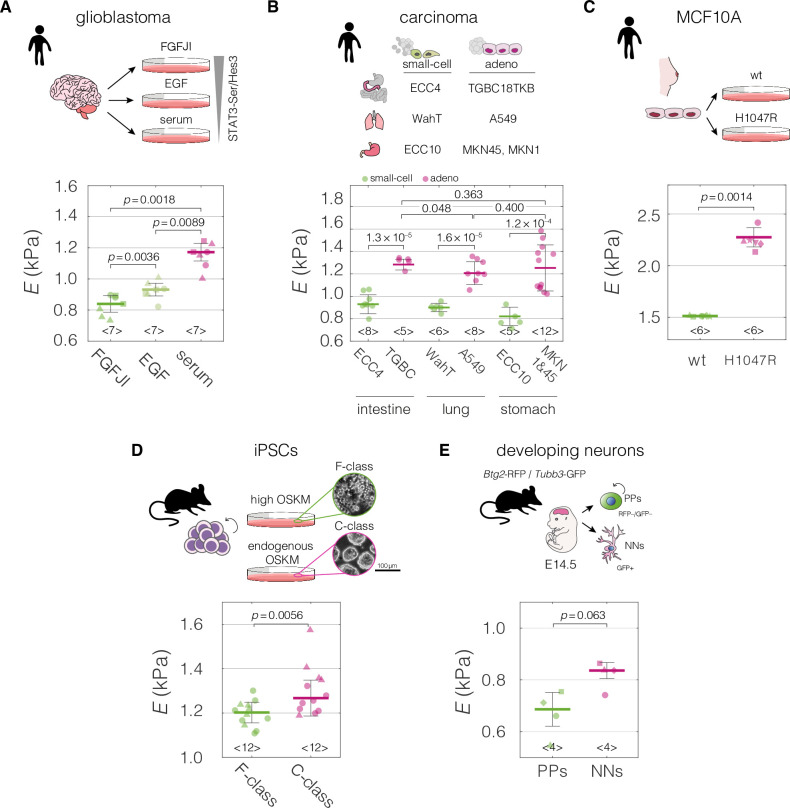
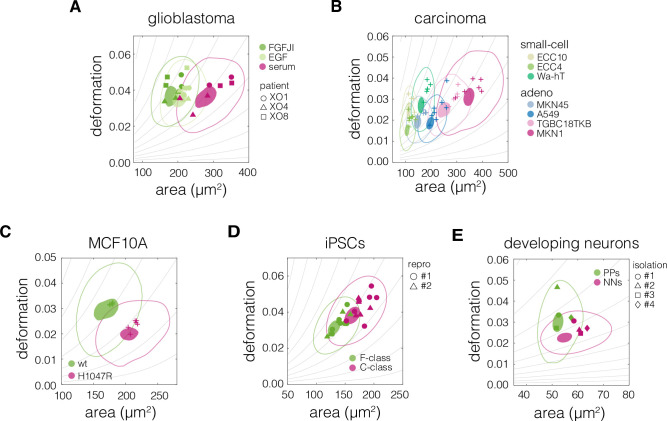
Cell mechanical properties determine many physiological functions, such as cell fate specification, migration, or circulation through vasculature. Identifying factors that govern the mechanical properties is therefore a subject of great interest. Here, we present a mechanomics approach for establishing links between single-cell mechanical phenotype changes and the genes involved in driving them. We combine mechanical characterization of cells across a variety of mouse and human systems with machine learning-based discriminative network analysis of associated transcriptomic profiles to infer a conserved network module of five genes with putative roles in cell mechanics regulation. We validate in silico that the identified gene markers are universal, trustworthy, and specific to the mechanical phenotype across the studied mouse and human systems, and demonstrate experimentally that a selected target, CAV1, changes the mechanical phenotype of cells accordingly when silenced or overexpressed. Our data-driven approach paves the way toward engineering cell mechanical properties on demand to explore their impact on physiological and pathological cell functions.

Keywords: cell biology; deformability cytometry; discriminative network analysis; human; mechanical phenotype; mechanomics; mouse; physics of living systems; transcriptomics; unsupervised machine learning.


Conflict of interest statement

MU, YG, MW, SA, MH, NT, JD, OF, MD, FC, FL, MÁP, AT, CC No competing interests declared, SA, MK, JG Co-founder and shareholder of the company Rivercyte GmbH that is commercializing deformability cytometry technology

Figures

Figure 1.
Figure 1.. Overview of a mechanomics approach for de novo identification of genes involved in cell mechanics regulation.
(A) Data curation. Datasets originating from different biological systems encompassing cell states with distinct mechanical phenotypes, as characterized by real-time deformability cytometry (RT-DC), and associated transcriptomics profiles are collected. (B) Target prediction. A subset of collected datasets is used to perform machine learning-based network analysis on transcriptomic data and identify conserved module of genes associated with cell mechanics changes. PC – principal component. (C) In silico validation. The classification performance of individual genes from module identified in (B) is evaluated in silico on remaining datasets. TPR – true positive rate, FPR – false positive rate, AUC – area under the curve. (D) Experimental validation. Targets with highest classification performance in silico are verified experimentally in perturbation experiments.
Figure 1—figure supplement 1.
Figure 1—figure supplement 1.. Characterization of mechanical cell properties using real-time deformability cytometry (RT-DC).
(A) Schematic overview of the RT-DC setup. Computer-operated syringe pumps flow the cell-containing sample as well as the sheath fluid into the microfluidic chip. Imaging of the cells deformed in the microfluidic channel is performed at 2000 frames per second using an LED-based stroboscopic illumination and a CMOS camera. (B) 3D illustration of the microfluidic chip used for the RT-DC measurements, close-up depicts the constriction of the channel in which cells are deformed, the imaged region of interest is indicated by an orange dashed line. At the bottom an exemplary image of a cell is shown. A contour is fitted to the cell in real time (marked in red), based on which cell area and deformation are calculated. (C) An exemplary plot of deformation vs area of three different cell populations. The gray isoelasticity lines in the background indicate regions of the same apparent Young’s moduli. (D) Box plot of apparent Young’s modulus, E, estimated based on deformation and area in (C). The cell population with same area but higher deformation has lower E (bright green compared to magenta). For cells with similar deformation, the one of smaller area has lower E (dark green compared to bright green). The exemplary data in (C) and (D) corresponds to exemplary measurements of Wa-hT (dark green), EBC1 (bright green), and A549 (magenta) cell lines. The box plots in (D) spread from 25th to 75th percentiles with a line at the median, whiskers span 1.5 × interquartile range (IQR).
Figure 2.
Figure 2.. Mechanical properties of divergent cell states in five biological systems.
Schematic overviews of the systems used in our study, alongside with the cell stiffness of individual cell states parametrized by Young’s moduli E. (A) Human patient-derived glioblastoma cells with three distinct signaling states maintained by indicated culture conditions. (B) Human small-cell carcinoma and adenocarcinoma cell lines originating from intestine, lung, and stomach. (C) Human breast epithelium MCF10A cell line bearing single-allele H1047R mutation in the PIK3CA with parental wild type (wt) as a control. (D) Murine F- and C-class induced pluripotent stem cells (iPSCs) cultured in the presence (F-class) or absence (C-class) of doxycycline (dox) activating ectopic expression of OSKM factors (Oct4, Sox2, Klf4, and cMyc). (E) Proliferating progenitors (PPs) and newborn neurons (NNs) isolated from brains of mouse embryos. Horizontal lines delineate medians with mean absolute deviation (MAD) as error, datapoints represent medians of the individual measurement replicates, the number of independent biological replicates is indicated below each box. Statistical analysis was performed using generalized linear mixed effects model. The symbol shapes represent cell lines derived from three different patients (A), matched experimental replicates (C), two different reprogramming series (D), and four different cell isolations (E). Data presented in (A) and (D) were previously published in Poser et al., 2019 and Urbanska et al., 2017, respectively. Cell areas and deformations used for Young’s modulus extraction for all datasets are visualized in Figure 2—figure supplement 1.
Figure 2—figure supplement 1.
Figure 2—figure supplement 1.. Plots of area vs deformation for different cell states in the characterized systems.
Panels correspond to the following systems: (A) glioblastoma, (B) carcinoma, (C) non-tumorigenic breast epithelia MCF10A, (D) induced pluripotent stem cells (iPSCs), and (E) developing neurons. 95% and 50% density contours of data pooled from all measurements of given cell state are indicated by shaded areas and continuous lines, respectively. Datapoints indicate medians of individual measurements. The symbol shapes represent cell lines derived from three different patients (A), two different reprogramming series (D), and three different cell isolations (E), as indicated in the respective panels. The isoelasticity lines in the background (gray) indicate regions of the same apparent Young’s moduli. PPs – proliferating progenitors, NNs – newborn neurons.
Figure 3.
Figure 3.. Identification of putative targets involved in cell mechanics regulation.
(A) Glioblastoma and induced pluripotent stem cell (iPSC) transcriptomes used for the target prediction intersect at 9452 genes. (B, C) Principal component analysis (PCA) separation along two first principal components of the mechanically distinct cell states in the glioblastoma (B) and iPSC (C) datasets. The analysis was performed using the gene expression data from the intersection presented in (A). The symbol shapes in (B) represent cell lines derived from three different patients. (D) Schematic representation of PC-corr analysis and the combination of the PC-corr results for two systems. (E–G) Gene networks based on filtering gene pairs by the combined PC-corr score. The presented networks were obtained by setting the cut-off value to 0.75, when using the mean PC-corr approach (E), and to 0.70 (F) and 0.75 (G), when using the minimum value approach. In (E–G), edge thicknesses represent the |PC-corrcomb| and the colors of the nodes represent the average processed PC loadings, both listed in Figure 3—source data 2.
Figure 3—figure supplement 1.
Figure 3—figure supplement 1.. Gene ontology (GO) enrichment analysis of obtained target genes.
Enriched GO terms of biological processes are summarized for: (A) Nine genes corresponding to the results from Figure 3G and (B) 34 genes corresponding to all nodes presented in Figure 3E-G. The analysis was performed using DAVID 6.8 functional annotation tool online, with Homo sapiens as background dataset, ENSMBL gene IDs as input, and focused on direct GO terms for biological processes. Color code of the blocks corresponds to the level of expression in stiff states with green corresponding to low expression and magenta corresponding to high expression. The reported p values are the Fisher’s exact p values obtained using a two-tailed two sample t-test.
Figure 4.
Figure 4.. Expression of identified target genes in the prediction and validation datasets.
Panels show unsupervised clustering heatmaps of expression data from transcriptomic datasets corresponding to the following systems: (A) glioblastoma, (B) induced pluripotent stem cells (iPSCs), (C) carcinoma, cell lines from intestine, lung, and stomach used for positive hypothesis I (see Table 3) are highlighted in pink, green, and orange, respectively; *mechanically tested cell lines (here the FANTOM5 dataset is presented as it contains all the cell lines that were tested mechanically in our study, for the remaining carcinoma datasets see Figure 4—figure supplements 1–3), (D) non-tumorigenic breast epithelia (MCF10A), and (E) developing neurons (dev. neurons). Comb – combinatorial marker, wt – wild type, PPs – proliferating progenitors, NNs – newborn neurons. Clustering was performed using clustergram function in MATLAB (R2020a,, MathWorks) on log-normalized expression data (Figure 4—source data 1).
Figure 4—figure supplement 1.
Figure 4—figure supplement 1.. Expression of identified target genes in the CCLE microarray dataset used for validation.
Panels show unsupervised clustering heatmaps of expression data from the CCLE microarray dataset and include: (A) adeno and small-cell carcinoma samples across all tissues present in the dataset, (B) adeno and small-cell carcinoma samples corresponding to lung tissue (used for testing of the positive hypothesis II, see Table 3 in the main text), (C) adenocarcinoma samples corresponding to lung and stomach (used for testing of negative hypothesis, see Table 3 in the main text), and (D) adenocarcinoma samples corresponding to large intestine and stomach (used for testing of the negative hypothesis, see Table 3 in the main text). Clustering was performed using clustergram function in MATLAB (R2020a, MathWorks) on log-normalized expression data. The bars under each heatmap are color-coded for the carcinoma type and tissue of origin (top and bottom bars, respectively) as specified in panel legends. Sample IDs corresponding to each class are listed in Supplementary file 3.
Figure 4—figure supplement 2.
Figure 4—figure supplement 2.. Expression of identified target genes in the CCLE RNA sequencing (RNA-Seq) dataset used for validation.
Panels show unsupervised clustering heatmaps of expression data from the CCLE RNA-Seq dataset and include: (A) adeno and small-cell carcinoma samples across all tissues present in the dataset and (B) adeno and small-cell carcinoma samples corresponding to lung tissue (used for testing of the positive hypothesis II, see Table 3 in the main text). Clustering was performed using clustergram function in MATLAB (R2020a, MathWorks) on log-normalized expression data. The bars under each heatmap are color-coded for the carcinoma type and tissue of origin (top and bottom bars, respectively) as specified in panel legends. Sample IDs corresponding to each class are listed in Supplementary file 3.
Figure 4—figure supplement 3.
Figure 4—figure supplement 3.. Expression of identified target genes in the Genentech dataset used for validation.
Panels show unsupervised clustering heatmaps of expression data from the Genentech dataset and include: (A) adeno and small-cell carcinoma samples across all tissues present in the dataset, (B) adeno and small-cell carcinoma samples corresponding to lung tissue (used for testing of the positive hypothesis II, see Table 3 in the main text), and (C) adenocarcinoma samples corresponding to lung and stomach (used for testing of the negative hypothesis, see Table 3 in the main text). Clustering was performed using clustergram function in MATLAB (R2020a, MathWorks) on log-normalized expression data. The bars under each heatmap are color-coded for the carcinoma type and tissue of origin (top and bottom bars, respectively) as specified in panel legends. Sample IDs corresponding to each class are listed in Supplementary file 3.
Figure 4—figure supplement 4.
Figure 4—figure supplement 4.. Relation between the magnitude of apparent Young’s modulus change and the absolute change in the expression levels of target genes.
Plots of normalized change in apparent Young’s modulus ΔE~ vs absolute value of change in expression for the target genes from conserved module: (A) CAV1, (B) FHL2, (C) IGFBP7, (D) TAGLN, and (E) THBS1. Every soft–stiff state pair from the respective datasets is presented as an individual point. E~=Estiff-EsoftEstiff, where Estiff and Esoft correspond to the apparent Young’s moduli (mean of all measurements) of the stiff and soft states within the given pairs, respectively. The dotted lines correspond to linear fits to all (gray), similar lineage (glioblastoma, developing neurons, and induced pluripotent stem cell [iPSC]; purple) and glioblastoma only (pink) datapoints. Shaded areas represent 95% confidence intervals (displayed for all and similar lineage fits only). The slope of the respective linear fits and the adjusted R2, Radj2, are reported in the plots. For the linage-selected data, the fitted slopes become higher and the quality of the fits better (higher Radj2).
Figure 4—figure supplement 5.
Figure 4—figure supplement 5.. Receiver-operator characteristics (ROC) curves characterizing classification performance of the five genes from the conserved module.
True positive rate was plotted against the false positive rate at different classification thresholds for each soft–stiff phenotype pair from the validation datasets for: (A) CAV1, (B) FHL2, (C) IGFBP7, (D) TAGLN, and (E) THBS1. The insets in the upper left corners of the plot show the colors of all overlying curves with AUC = 1. The ROC curves were constructed using perfcurve function in MATLAB (R2020a,, MathWorks). adeno – adenocarcinoma, sc – small cell carcinoma, WT – wild type, PPs – proliferating progenitors, NNs – newborn neurons.
Figure 5.
Figure 5.. Perturbing levels of CAV1 affects the mechanical phenotype of intestine carcinoma cells.
(A) CAV1 levels in small-cell (ECC4) and adenocarcinoma (TGBC) cell lines from intestine. Mechanical phenotype of ECC4 and TGBC cells measured with real-time deformability cytometry (RT-DC) (B, as in Figure 2B), atomic force microscopy (AFM) indentation (C), and AFM microrheology (D). (E) Protein-level verification of CAV1 knock-down in TGBC cells using two knock-down system: three esiRNA constructs (esiCAV1-1. esiCAV1-1, and esiCAV1-3 with rLuc as a control), and pooled siRNA mixture (CAV1-pool with non-targeting mixture nonT as a control). Mechanical phenotype change of TGBC cells upon CAV1 knock-down as measured by RT-DC (F), AFM indentation (G), and AFM microrheology (H). (I) Protein-level verification of transient CAV1 overexpression in ECC4 and TGBC cells. (J) Mechanical phenotype change of ECC4 and TGBC cells upon CAV1 overexpression as measured by real-time fluorescence and deformability cytometry (RT-FDC). Gating for fluorescence-positive and -negative cells based on dTomato expression in ECC4 (top) and TGBC (bottom) cells (left-hand side). Fluorescence-positive cells correspond to cells expressing CAV1-IRES-dTomato (CAV1iT). For comparison, mock transfection sample is shown in the background (mock). Apparent Young’s modulus changes of ECC4 and TGBC cells upon CAV1 overexpression (right-hand side). CAV1iT− and CAV1T+ are dTomato negative and positive cells, respectively. For protein quantification in (A, E, and I), representative western blots (top) as well as quantification of specified replicate numbers N (bottom) are shown. In (B, F, and J), horizontal lines delineate medians with mean absolute deviation (MAD) as error, datapoints represent medians of N experiment replicates, statistical analysis was performed using generalized linear mixed effects model. In (C) and (G), box plots spread from 25th to 75th percentiles with a line at the median, whiskers span 1.5 × interquartile range (IQR), individual datapoints correspond to values obtained for n individual cells, statistical analysis was performed using two sample two-sided Wilcoxon rank sum test. In (D) and (H), datapoints correspond to means ± standard deviation of all measurements at given oscillation frequencies for n cells. Lines connecting datapoints serve as guides for the eye. E – apparent Young’s modulus, G* – complex shear modulus, ΔE – apparent Young’s modulus change relative to respective control measurements. In (E, F, I, and J), the symbol shapes represent matching experiment replicates.
Figure 5—figure supplement 1.
Figure 5—figure supplement 1.. CAV1 knock-out mouse embryonic fibroblasts (CAV1KO) have lower stiffness compared to the wild-type (WT) cells.
(A) Western blot analysis of CAV1 expression levels in CAV1KO compared to WT cells. (B) Plots of area vs deformation for CAV1KO and WT cells characterized with real-time deformability cytometry (RT-DC). Contour plots delineate 95% and 50% density areas (solid lines and filled area, respectively) of data from individual measurement replicates (n = 3). The isoelasticity lines in the background (gray) indicate regions of the same apparent Young’s moduli. (C) Apparent Young’s modulus values estimated for WT and CAV1KO cells using area-deformation data in (B). The symbol shapes represent experimental replicates. Horizontal lines delineate medians with mean absolute deviation (MAD) as error, datapoints represent medians of the individual replicates. Statistical analysis was performed using generalized linear mixed effects model.
Figure 5—figure supplement 2.
Figure 5—figure supplement 2.. Absolute Young’s modulus values across the probing frequencies characteristic for the three measurement methods.
(A) Graphical representation of measurement frequencies (the inverse of the time within which strain is induced) in the three methods for characterizing mechanical properties used in this study. For real-time deformability cytometry (RT-DC), the frequency at which deformation is induced was deduced based on the time it takes to pass a 300-μm long square channel with an average velocity based on a range of flow rates typically used for 20 and 30 μm channels (see also Table 6 and Supplementary file 1). Apparent Young’s moduli derived from RT-DC as well as atomic force microscopy (AFM) indentation and microrheology measurements plotted against probing frequency for ECC4 and TGBC cell lines (B), and CAV1 knock-down in TGBC cells (C). For RT-DC, datapoints for measurements at 0.16, 0.24, and 0.32 μl s−1 flowrates are included for which the estimated frequencies, based on the time that it takes for the cell to pass through the channel, are equal to 593, 889, and 1119 Hz, respectively. For AFM microrheology, storage Young’s moduli E′ were obtained from storage shear moduli (G`) according to the following equation: E`=21+νG`, assuming a Poisson’s ratio, ν, of 0.5. Datapoints correspond to means ± SD of individual cells (AFM microrheology) or medians ± MAD (of individual cells or measurement replicates in the case of AFM and RT-DC, respectively). Data corresponds to Figure 5B–D (B) and Figure 5F, H (C).
Figure 5—figure supplement 3.
Figure 5—figure supplement 3.. Plots of area vs deformation from real-time deformability cytometry (RT-DC) measurements of cells with perturbed CAV1 levels.
Panels correspond to the following experiments: CAV1 knock-down in TGBC cells using esiRNA (A) and ONTarget siRNA (B), and transient CAV1 overexpression in ECC4 cells (C) and TGBC cells (D). Datapoints indicate medians of individual measurement replicates. The isoelasticity lines in the background (gray) indicate regions of same apparent Young’s moduli. The symbol shapes represent experimental replicates.
Figure 6.
Figure 6.. Perturbations of CAV1 levels in MCF10A-ER-Src cells result in cell stiffness changes.
(A) Inducing transformation of MCF10A- ER-Src cells by tamoxifen (TAM) treatment, as opposed to vehicle control (ethanol, EtOH), causes a decrease of CAV1 expression over time, as captured by microarray analysis (GEO accession number: GSE17941, data previously published in Hirsch et al., 2010). Datapoints with error bars represent means ± standard deviation (N = 2, unless indicated otherwise). (B) Western blot analysis shows the decrease of CAV1 at protein level 72 hr post induction. (C) MCF10A-ER-Src cells show decreased apparent Young’s moduli 72 hr post TAM induction. (D) CAV1 knock-down in uninduced MCF10A-ER-Src cells results in lowering of the apparent Young’s modulus. (E) Overexpression of CAV1 in TAM-induced MCF10A-ER-Src cells causes increase in the apparent Young’s modulus and effectively reverts the softening caused by TAM induction (compare to panel C). Box plots in (C–E) spread from 25th to 75th percentiles with a line at the median, whiskers span 1.5 × interquartile range (IQR), individual datapoints correspond to values obtained for individual cells, the number of measured cells per conditions, pooled from N = 3 independent experiments, is indicated below each box. Statistical analysis was performed using a two-sided Wilcoxon rank sum test. In the bar graphs in (B, D, and E), the symbol shapes represent experiment replicates.
Author response image 1.
Author response image 2.
Author response image 3.
Author response image 4.
Author response image 5.
Author response image 6.
Author response image 7.
Author response image 8.
Author response image 9.
Author response image 9.. Cell volumes for the divergent cell states in the five characterized biological systems.
(A) Glioblastoma. (B) Carcinoma. (C) MCF10A. (D) iPSCs. (E) Developing neurons. Data corresponds to Figure 2. Cell volumes were estimated using Shape-Out 1.0.10 by rotation of the cell contours.
Author response image 10.
Author response image 10.. Cell volumes for CAV1 perturbation experiments.
(A) CAV1 knock down performed in TGBC cells. (B) CAV1 overexpression in ECC4 and TGBC cells. Data corresponds to Figure 5. Cell volumes were estimated using Shape-Out 1.0.10 by rotation of the cell contours.
Author response image 11.
Author response image 11.. Cell volumes for WT and CAV1KO MEFs.
Data corresponds to Figure S9. Cell volumes were estimated using Shape-Out 1.0.10 by rotation of the cell contours.
Author response image 12.
Author response image 12.. Visualisation of interactions between the nodes in the identified module using functional protein association networks tool STRING.
(A) Connections obtained using multiple proteins search and entering the five network nodes. (B) Extended network that includes further genes to increase indirect connectivity. The genes are added automatically by STRING. Online version of STRING v12.0 was used with Homo sapiens as species of interest.
Author response image 13.
Author response image 13.. Co-occurrence of genes from the network module across the evolutionary tree.
Mammals are indicated with the green frame, glires (include mouse), as well as primates (include human) are indicated with yellow frames. The view was generated using online version of STRING 12.0.
Author response image 14.
Author response image 14.. Expression of genes from the identified module across various organ and organ systems in mouse.
The expression matrices for organs (A) and organ systems (B) were generated using Tissue x Gene Matrix tool of Gene eXpression Database (https://www.informatics.jax.org/gxd/, accessed on 22nd September 2024). No pre-selection of stage (age) and assay type (includes RNA and protein-based assays) was applied. The colors in the grid (blues for expression detected and reds for expression not detected) get progressively darker when there are more supporting annotations. The darker colors do not denote higher or lower levels of expression, just more evidence.
Author response image 15.
Author response image 15.. Expression of genes from the identified module across various mouse tissue structures.
The expression matrices for age-selected mouse marked as adult (A) or young individuals (collected ages labelled P42-84 / P w6-w12 / P m1.5-3.0) (B) are presented and were generated using RNASeq Heatmap tool of Gene eXpression Database (https://www.informatics.jax.org/gxd/, accessed on 2nd October 2024).
Author response image 16.
Author response image 16.. Expression of genes from the identified module across various cell types and organs in t-SNE embedding of Tabula Muris dataset.
(A) t-SNE clustering color-coded by organ. (B-F) t-SNE clustering colorcoded for expression of CAV1 (B), IGFBP7 (C), FHL2 (D), TAGLN (E), and THBS1 (F). The plots were generated using FACS-collected cells data through the visualisation tool available at https://tabulamuris.sf.czbiohub.org/ (accessed on 22nd September 2024).
Author response image 17.
Author response image 17.. Expression of genes from the identified module at the mRNA level across various human tissues.
(A-E) Expression levels of CAV1 (A), IGFBP7 (B), FHL2 (C), TAGLN (D), and THBS1 (E). The plots were generated using consensus dataset from Human Protein Atlas v23 https://www.proteinatlas.org/ (accessed on 22nd September 2024).
Author response image 18.
Author response image 18.. Protein levels of genes from the identified module across various human tissues.
(A-E) Protein levels of CAV1 (A), IGFBP7 (B), FHL2 (C), TAGLN (D), and THBS1 (E). The plots were generated using Human Protein Atlas v23 https://www.proteinatlas.org/ (accessed on 22nd September 2024).
Author response image 19.
Author response image 19.. The impact of CAV1 knock down on cell counts in TGBC cells.
(A) Absolute cell counts per condition in a 6-well format. Cell counts were performed when harvesting for RT-DC measurements using an automated cell counter (Countess II, Thermo Fisher Scientific). (B) The event rates observed during the RT-DC measurements. The harvested cells are resuspended in a specific volume of measuring buffer standardized per experiment (50-100 μl); thus, the event rates reflect the absolute cell numbers in the respective samples. Horizontal lines delineate medians with mean absolute deviation (MAD) as error, datapoints represent individual measurement replicates, with symbols corresponding to matching measurement days. Statistical analysis was performed using two sample two-sided Wilcoxon rank sum test.
Author response image 20.
Author response image 21.
Author response image 21.. Visualization of different axis scaling strategies applied to the five datasets presented in Figure 2 of the manuscript.

Update of

  • doi: 10.1101/2021.04.26.441418
  • doi: 10.7554/eLife.87930.1
  • doi: 10.7554/eLife.87930.2

References

    1. Acevedo A, Duran C, Kuo MJ, Ciucci S, Schroeder M, Cannistraci CV. Measuring group separability in geometrical space for evaluation of pattern recognition and dimension reduction algorithms. IEEE Access. 2022;10:22441–22471. doi: 10.1109/ACCESS.2022.3152789. - DOI
    1. Adams JC, Lawler J. The thrombospondins. Cold Spring Harbor Perspectives in Biology. 2011;3:a009712. doi: 10.1101/cshperspect.a009712. - DOI - PMC - PubMed
    1. Alcaraz J, Buscemi L, Puig-de-Morales M, Colchero J, Baró A, Navajas D. Correction of microrheological measurements of soft samples with atomic force microscopy for the hydrodynamic drag on the cantilever. Langmuir. 2002;18:716–721. doi: 10.1021/la0110850. - DOI
    1. Alcaraz J, Buscemi L, Grabulosa M, Trepat X, Fabry B, Farré R, Navajas D. Microrheology of human lung epithelial cells measured by atomic force microscopy. Biophysical Journal. 2003;84:2071–2079. doi: 10.1016/S0006-3495(03)75014-0. - DOI - PMC - PubMed
    1. Aprea J, Prenninger S, Dori M, Ghosh T, Monasor LS, Wessendorf E, Zocher S, Massalini S, Alexopoulou D, Lesche M, Dahl A, Groszer M, Hiller M, Calegari F. Transcriptome sequencing during mouse brain development identifies long non-coding RNAs functionally involved in neurogenic commitment. The EMBO Journal. 2013;32:3145–3160. doi: 10.1038/emboj.2013.245. - DOI - PMC - PubMed

LinkOut - more resources