. 2025 May;45(5):608-631.
doi: 10.1002/cac2.70004. Epub 2025 Feb 17.

Helicobacter pylori CagA elevates FTO to induce gastric cancer progression via a "hit-and-run" paradigm

Affiliations

Helicobacter pylori CagA elevates FTO to induce gastric cancer progression via a "hit-and-run" paradigm

Bing He et al. Cancer Commun (Lond). 2025 May.

Abstract

Background: Helicobacter pylori (H. pylori) infection contributes significantly to gastric cancer (GC) progression. The intrinsic mechanisms of H. pylori-host interactions and their role in promoting GC progression need further investigation. In this study, we explored the potential role of fat mass and obesity-associated protein (FTO) in mediating Cytotoxin-associated gene A (CagA)-induced GC progression.

Methods: The effects of H. pylori infection on N6-methyladenosine (m6A) modification were evaluated in both human samples and GC cell lines. The function of FTO in the progression of GC was elucidated through in vitro and in vivo studies. A series of techniques, including methylated RNA immunoprecipitation sequencing, RNA sequencing, RNA binding protein immunoprecipitation, and chromatin immunoprecipitation assays, were utilized to investigate the mechanism by which FTO mediates the capacity of cagA-positive H. pylori to promote GC progression. Furthermore, the therapeutic potential of the FTO inhibitor meclofenamic acid (MA) in impeding GC progression was evaluated across GC cells, animal models, and human GC organoids.

Results: Infection with cagA-positive H. pylori upregulated the expression of FTO, which was essential for CagA-mediated GC metastasis and significantly associated with a poor prognosis in GC patients. Mechanistically, CagA delivered by H. pylori enhanced FTO transcription via Jun proto-oncogene. Elevated FTO induced demethylation of m6A and inhibited the degradation of heparin-binding EGF-like growth factor (HBEGF), thereby facilitating the epithelial-mesenchymal transition (EMT) process in GC cells. Interestingly, eradication of H. pylori did not fully reverse the increases in FTO and HBEGF levels induced by cagA-positive H. pylori. However, treatment with a combination of antibiotics and MA substantially inhibited cagA-positive H. pylori-induced EMT and prevented GC metastasis.

Conclusion: Our study revealed that FTO mediates the "hit-and-run" mechanism of CagA-induced GC progression, which suggests that the therapeutic targeting of FTO could offer a promising approach to the prevention of CagA-induced cancer progression.

Keywords: Epithelial‐Mesenchymal transition; FTO; Gastric cancer; Helicobacter pylori; m6A modification.


Conflict of interest statement

The authors declare that they have no competing interests.

Figures
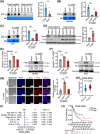
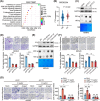
FIGURE 1
FIGURE 1
cagA + H. pylori mediates m6A modification and induces FTO expression. (A) Representative image of dot‐blotting assay to measure total m6A levels in mRNA of GC tissues. The RNA sample loading amount was 200 ng. MB was used as a control. The relative quantification result is shown on the right. Data represented as mean ± SD. CagA+, n = 8; CagA, n = 7. (B‐C) Dot‐blotting assay to measure total m6A levels in mRNA of MKN45 (B) and AGS (C) cells after infection with cagA + or ΔcagA H. pylori for 24 hours. Mock, uninfected group, n = 3. (D) Representative image of western blotting results showed protein levels of FTO and CagA in GC samples. Quantification of the band intensities is shown on the right. (E‐F) qRT‐PCR and western blotting analysis on both mRNA and protein levels of FTO in MKN45 (E) and AGS (F) cells after cagA + or ΔcagA H. pylori infection. Mock, uninfected group, n = 3 for qRT‐PCR. The numbers below the bands in the western blotting results represented the relative gray values of FTO quantification. (G) Representative images of immunofluorescence staining of DAPI, CagA and FTO in human GC organoids of the indicated group. Quantification of the fluorescence intensity was shown on the right. Scale bar, 100 µm. n = 3. (H) qRT‐PCR result of FTO mRNA levels in GC (n = 408) tumor and normal tissues (n = 211) from the TCGA‐STAD cohort. (I) Correlation analysis of FTO expression with clinicopathological features of GC patients in the TCGA‐STAD cohort (n = 408). (J) Log‐rank test indicating the OS of individuals with high or low FTO expression in the TCGA‐STAD cohort. Samples were stratified into high and low expression groups based on the median expression levels of FTO. P < 0.05, ∗∗ P < 0.01, and ∗∗∗ P < 0.001 according to the unpaired t‐test (A, D and H), one‐way ANOVA (B, C, E, F and G), Pearson chi‐square test (I) and log‐rank test (J). Abbreviations: CagA, cytotoxin‐associated gene A; CagA, CagA‐negative; CagA+, CagA‐positive; cagA+ H. pylori, H. pylori cagA + strain; CI, confidence interval; DAPI, 4',6‐diamidine‐2‐phenylindole; FTO, fat mass and obesity‐associated protein; GAPDH, glyceraldehyde 3‐phosphate dehydrogenase; GC, gastric cancer; M, metastasis; m6A, N6‐methyladenosine; MB, methylene blue stain; N, node; OS, overall survival; qRT‐PCR, quantitative real‐time PCR; RR, risk ratio; SD, standard deviation; STAD, stomach adenocarcinoma; T, tumor; TCGA, the Cancer Genome Atlas; ΔcagA H. pylori, H. pylori isogenic mutant strain.
FIGURE 2
FIGURE 2
FTO is needed for CagA‐induced GC metastasis. (A) ​KEGG enrichment analysis of gene altered in response to FTO knockdown in the GSE178697 dataset. (B) mRNA level of FTO in M0 (n = 248) and M1 (n = 52) group of GC tissues from the GSE62254 dataset. Data represented as mean ± SD. (C) Western blotting and dot‐blotting assay to validate the FTO knockdown efficiency in MKN45 cells. The RNA sample loading amounts were 200 ng and 100 ng. MB was used as a control. (D) Representative image of migration and invasion assay with or without FTO knockdown in MKN45 cells. Quantification results are shown below. n = 3. Scale bar, 200 µm. (E) Western blotting and dot‐blotting assay to validate overexpression of FTO in the FTO‐WT‐oe, FTO‐mut1‐oe, and FTO‐mut2‐oe groups in MKN45 cell. The RNA sample loading amounts were 200 ng and 100 ng. MB was used as a control in dot‐blotting assay. (F) Representative images of migration and invasion assay of overexpressing FTOWT, FTOmut1 or FTOmut2 in MKN45 cells. Quantification results were shown below. n = 3. Scale bar, 200 µm. (G) Representative images of migration and invasion assay of FTO knockdown in cagA + and ΔcagA H. pylori‐infected MKN45 cells (left). Quantification results were shown on the right, n = 3. Scale bar, 200 µm. ns, not significant, P < 0.05, ∗∗ P < 0.01, ∗∗∗ P < 0.001 and ∗∗∗∗ P < 0.0001 according to unpaired t‐ tests (B and D) and one‐way ANOVA (F and G). Abbreviations: cagA+ H. pylori, H. pylori cagA + strain; FDR, false discovery rate; FTO, fat mass and obesity‐associated protein; FTO‐mut, mutant FTO; GAPDH, Glyceraldehyde 3‐phosphate dehydrogenase; M0, no distant metastasis; M1, distant metastasis; MB, methylene blue stain; NC, negative control; SD, standard deviation; shFTO, short hairpin RNA against FTO; shNC, short hairpin RNA negative control; ΔcagA H. pylori, H. pylori isogenic mutant strain.
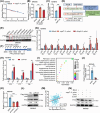
FIGURE 3
FIGURE 3
CagA promotes the binding of JUN to the promoter region of FTO to facilitate the expression of FTO. (A) mRNA stability of FTO after cagA + H. pylori infection in MKN45 cell. (B) Luciferase assay to measure FTO promoter activity in Mock, ΔcagA H. pylori infection, and cagA + H. pylori infection group of MKN45 cell. (C) Luciferase assay to measure FTO promoter activity in MKN45 cells with either NC or cagA overexpression. (D) Workflow for screening possible candidate TFs which can target FTO promoter. (E) Western blotting showed the protein level of FTO with the knockdown of seven candidate TFs in MKN45 cells. The numbers below the bands represented the relative gray values of FTO quantification. (F) Schematic showing the location of the predicted JUN‐binding region in the FTO promoter. (G‐H) ChIP assay showed enrichment of DNA fragments in the binding region within cagA + or ΔcagA H. pylori‐infected (G) or JUN‐overexpressed (H) MKN45 cells. (I) ​KEGG analysis of gene altered in response to cagA + H. pylori infection in MKN45 cells. (J) Luciferase assay to measure FTO promoter activity when JUN was knockdown in MKN45 cells. (K) qRT‐PCR analysis of FTO mRNA level after knockdown of JUN in MKN45 cells. (L) Western blotting showed protein levels of FTO with or without JUN overexpression in MKN45 cells. The numbers below the bands represented the relative gray values of FTO quantification. (M) Correlation between FTO and JUN expression in GC tissues from the TCGA‐STAD cohort (n = 408). (N) Western blotting to detect the expression level of FTO with JUN knockdown and exposure to cagA + H. pylori in MKN45 cells. The numbers below the bands represented the relative gray values of FTO quantification. P < 0.05, ∗∗ P < 0.01, and ∗∗∗ P < 0.001 were determined through one‐way ANOVA (B and G), unpaired t‐tests (C, H, J and K) and Pearson correlation analysis (N). Abbreviations: BARX1, Basic region leucine zipper 1; BCL6, B‐cell lymphoma 6; CHIP, chromatin immunoprecipitation; EGR1, Early growth response 1, SIN3A, SIN3 homolog A, histone deacetylase complex subunit; EP300, E1A binding protein p300; FTO, fat mass and obesity‐associated protein; GAPDH, Glyceraldehyde 3‐phosphate dehydrogenase; IgG, Immunoglobulin G; JUN, Jun Proto‐Oncogene; MITF, Microphthalmia‐associated transcription factor; P1‐P9, JUN binding sites within the FTO promoter; TFDB, the Animal Transcription Factor DataBase; TFs, transcription factors; TSS, transcription start site.
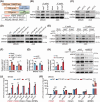
FIGURE 4
FIGURE 4
HBEGF serves as the primary downstream target of the CagA‐FTO axis. (A) Workflow showed the screening strategy for candidate targets of the CagA‐FTO axis. (B) Western blotting to detect the protein level of FTO and HBEGF in GC cells after exposed to cagA + or ΔcagA H. pylori. (C) Western blotting to detect the protein level of FTO and HBEGF in GC cells with or without FTO knockdown. (D) Western blotting is used to detect the protein levels of FTO and HBEGF in GC cells overexpressing wild‐type FTO‐WT, FTOmut1, or FTOmut2. (E) Western blotting showed protein levels of FTO and HBEGF in NC and FTO knockdown GC cells exposed to cagA + or ΔcagA H. pylori. (F‐H) ELISA assay showed secretion level of HBEGF in the culture supernatants of H. pylori‐infected (F), FTO knockdown (G) and FTO overexpressing (H) GC cells. (I) Western blotting to detect the expression levels of EMT markers in GC cells with HBEGF knockdown and cagA + H. pylori exposure. (J‐K) MeRIP‐qPCR showed enrichment of m6A modification on HBEGF mRNA after FTO knockdown (J) and FTO overexpression (wild‐type FTO or mutated FTO, K). HECBPA was used as a positive control. ns, not significant, P < 0.05, ∗∗ P < 0.01, and ∗∗∗ P < 0.001 were determined through one‐way ANOVA (F and K) and unpaired t‐tests (G, H and J). Abbreviations: E‐Ca, E‐cadherin; EMT, epithelial‐mesenchymal transition; FTO mut, mutant FTO; FTO, fat mass and obesity‐associated protein; GAPDH, Glyceraldehyde 3‐phosphate dehydrogenase; MeRIP‐seq, Methylated RNA immunoprecipitation sequencing; HBEGF, heparin‐binding EGF like growth factor; HECBPA, 2’‐O‐methyladenosine‐3’‐phosphate‐5’‐phosphate; IgG, Immunoglobulin G; m6A‐IP, Methylated RNA immunoprecipitation; N‐Ca, N‐cadherin; Vim, Vimentin.
FIGURE 5
FIGURE 5
FTO increases the stability of HBEGF mRNA via YTHDF2. (A) Venn diagram showing 135 common genes among three times of repetition from MS results. (B) RIP‐qPCR verified the enrichment of HBEGF mRNA on YTHDF2 protein in MKN45 cells. (C) RNA pull‐down showing the binding of HBEGF mRNA to YTHDF2. (D) Western blotting showed an upregulated protein level of HBEGF with YTHDF2 knockdown in MKN45 cells. (E‐G) qRT‐PCR analysis of HBEGF mRNA in the indicated group when MKN45 cells were exposed to actinomycin D, with or without YTHDF2 knockdown (E), with or without FTO knockdown (F) and with or without FTO overexpression (G). (H) Expression correlation between HBEGF and YTHDF2 levels in GC tissues from the TCGA‐STAD cohort (n = 408). (I) Log‐rank test indicating the OS of individuals with high (n = 257) or low (n = 618) YTHDF2 expression in the GSE62254. (J) Western blotting showed protein level of HBEGF in MKN45 cells with FTO knockdown or YTHDF2 knockdown. (K) Schematic showing the construction of Flag‐tagged wild‐type or m6A modification site‐mutant HBEGF probes. (L‐N) Western blotting showed protein level of Flag‐tagged HBEGF in MKN45 cells among indicated groups, with or without FTO knockdown (L), with or without FTO overexpression (M) and with or without YTHDF2 knockdown (N). P < 0.05 and ∗∗∗ P < 0.001 according to the unpaired t‐test (B), two‐way ANOVA (E to G), Pearson correlation tests (H) and log‐rank test (I). Abbreviations: 3’UTR, 3’untranslation region; 5’UTR, 5’untranslation region; CDS, Coding DNA Sequence; Flag‐mut, Flag‐labeled mutant HBEGF; Flag‐WT, Flag‐labeled wild‐type HBEGF; FTO mut, mutant FTO; FTO, fat mass and obesity‐associated protein; GAPDH, Glyceraldehyde 3‐phosphate dehydrogenase; HBEGF, heparin‐binding EGF like growth factor; MS, mass spectrometry; NC, negative control; YTHDF2, YTH N(6)‐methyladenosine RNA binding protein 2.
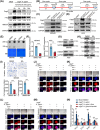
FIGURE 6
FIGURE 6
MA treatment impeded the progression of GC following H. pylori eradication. (A) Western blotting showed protein levels of FTO and HBEGF after cagA + H. pylori infection and kanamycin therapy in MKN45 cells. The numbers below the bands represented the relative gray values of quantification. (B) Schematic showing construction of the CagA‐tet‐on system for the cycling CagA induction process. (C‐D) Western blotting showed protein levels of FTO and HBEGF in MKN45 (C) and AGS (D) cells after 20 cycles of CagA induction and withdrawal of DOX for 48 hours. (E) Dot‐blotting assay showed m6A levels in MKN45 (left) and AGS (right) cells treated with MA or DMSO. (F‐G) qRT‐PCR (F) and western blotting (G) showed the expression level of HBEGF when GC cells were treated with MA or DMSO. (H) Western blotting showed protein levels of EMT markers in response to MA treatment. The numbers below the bands represented the relative gray values of quantification. (I) Migration and invasion assay showed the suppressive effect of MA on MKN45 cells. Quantification results are shown below. n = 3. Scale bar, 200 µm. (J‐M) Representative image of immunofluorescence staining in GC organoids exposed to indicated groups, N‐ca (J), E‐ca (K), Snail (L) and Vim (M). Scale bar, 200 µm. (N) Quantification results of fluorescence intensity among EMT markers using ImageJ software. P < 0.05, ∗∗ P < 0.01, and ∗∗∗ P < 0.001 according to unpaired t‐tests (F and I) and one‐way ANOVA (N). Abbreviations: CagA, CagA uninduced; CagA+, CagA induced; DAPI, 4',6‐diamidine‐2‐phenylindole; DMSO, Dimethyl sulfoxide; DOX, doxycycline; E‐Ca, E‐cadherin; EMT, epithelial‐mesenchymal transition; FTO, fat mass and obesity‐associated protein; GAPDH, Glyceraldehyde 3‐phosphate dehydrogenase; HBEGF, heparin‐binding EGF like growth factor; Kna, kanamycin; MA, meclofenamic acid; MB, Methylene blue stain; N‐Ca, N‐cadherin; Vim, Vimentin.
FIGURE 7
FIGURE 7
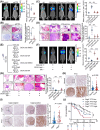
CagA promotes GC metastasis via FTO in vivo. (A) Bioluminescence imaging of the lung metastasis burden after inoculation of MKN45 cells with or without FTO knockdown (left). Quantification results were shown on the right, n = 5. (B) Representative images of HE staining of lung sections from the NC and FTO knockdown groups (left). The number of metastatic nodules was calculated (right). The scale bar was 200 µm (upper panels) or 50 µm (lower panels). n = 5. (C) Bioluminescence imaging of the lung metastasis burden after inoculation of MKN45 cells with FTO‐WT, FTOmut1 or FTOmut2 overexpression (left). Quantification results were shown on the right. n = 5. (D) Representative images of HE staining of lung sections from the FTO‐WT, FTOmut1or FTOmut2 overexpressing groups. The scale bar was 200 µm (upper panels) or 50 µm (lower panels). n = 5. (E) Experimental design of the lung metastasis assay with MKN45 cells treated with DOX‐induced CagA and MA. (F) Bioluminescence imaging of the lung metastasis burden after inoculation of MKN45 cells with DOX‐induced CagA expression and MA treatment. Quantification results were shown on the right. n = 5. (G) Representative images of HE staining of lung sections from the indicated group. Quantification results about the number of lung metastases were shown on the right. The scale bar was 200 µm (upper panel) or 50 µm (lower panel). n = 5. (H) Representative images of FTO IHC staining in GC TMAs (left) and mean optical density statistics of FTO staining (right). The scale bar was 200 µm (left panel) or 50 µm (right panel). normal, n = 83; tumor, n = 83. (I) Representative IHC staining of FTO in CagA‐positive and CagA‐negative GC tissues from TMAs. The scale bar was 200 µm (left panel) or 50 µm (right panel). CagA‐positive, n = 29; CagA‐negative, n = 68. (J) Kaplan‐Meier curves indicate the OS of individuals of the indicated groups in TMAs. ∗∗ P < 0.01 and ∗∗∗ P < 0.001 were determined through unpaired t‐tests (A, B, H and I), one‐way ANOVA (C, D, F and G), and log‐rank tests (J). Abbreviations: CagA, CagA‐negative; CagA+, CagA‐positive; DMSO, Dimethyl sulfoxide; DOX, doxycycline; DOX‐CagA, DOX‐induced cagA expression; FTO, fat mass and obesity‐associated protein; FTOmut, mutant FTO; GC, gastric cancer; HE, hematoxylin and eosin stain; IHC, immunohistochemical; MA, meclofenamic acid; NC, negative control; TMA, tissue microarray.
FIGURE 8
FIGURE 8
Graph illustration. CagA‐positive H. pylori increases FTO expression, which results in “hit‐and‐run” GC progression. However, the synergism of the FTO inhibitor MA with H. pylori eradication prevents GC development. Abbreviations: CagA, cytotoxin‐associated gene A; CEA, carcinoembryonic antigen; CK20, cytokeratin 20; CK7, cytokeratin 7; EpCAM, epithelial cell adhesion molecule; FTO, fat mass and obesity‐associated protein; FTO, fat mass and obesity‐associated protein; GAPDH, Glyceraldehyde 3‐phosphate dehydrogenase; HBEGF, heparin‐binding EGF like growth factor; JUN, Jun Proto‐Oncogene; m6A, N6‐methyladenosine; MA, meclofenamic acid; T4SS, the type IV secretion system; YTHDF2, YTH N(6)‐methyladenosine RNA binding protein 2.

Similar articles

Cited by

References

    1. Morgan E, Arnold M, Camargo MC, Gini A, Kunzmann AT, Matsuda T, et al. The current and future incidence and mortality of gastric cancer in 185 countries, 2020‐40: A population‐based modelling study. EClinicalMedicine. 2022;47:101404. - PMC - PubMed
    1. Huang J, Lucero‐Prisno DE, Zhang L, Xu W, Wong SH, Ng SC, et al. Updated epidemiology of gastrointestinal cancers in East Asia. Nat Rev Gastroenterol Hepatol. 2023;20(5):271‐287. - PubMed
    1. Sharafutdinov I, Tegtmeyer N, Linz B, Rohde M, Vieth M, Tay AC‐Y, et al. A single‐nucleotide polymorphism in Helicobacter pylori promotes gastric cancer development. Cell Host Microbe. 2023;31(8):1345‐1358. - PubMed
    1. Usui Y, Taniyama Y, Endo M, Koyanagi YN, Kasugai Y, Oze I, et al. Helicobacter pylori, Homologous‐Recombination Genes, and Gastric Cancer. N Engl J Med. 2023;388(13):1181‐1190. - PubMed
    1. Noto JM, Piazuelo MB, Shah SC, Romero‐Gallo J, Hart JL, Di C, et al. Iron deficiency linked to altered bile acid metabolism promotes Helicobacter pylori‐induced inflammation‐driven gastric carcinogenesis. J Clin Invest. 2022;132(10):e147822. - PMC - PubMed

MeSH terms