. 2025 Jul:318:123177.
doi: 10.1016/j.biomaterials.2025.123177. Epub 2025 Feb 11.

Profiling of the macrophage response to polypropylene mesh burden in vivo

Affiliations

Profiling of the macrophage response to polypropylene mesh burden in vivo

Marrisa A Therriault et al. Biomaterials. 2025 Jul.

Abstract

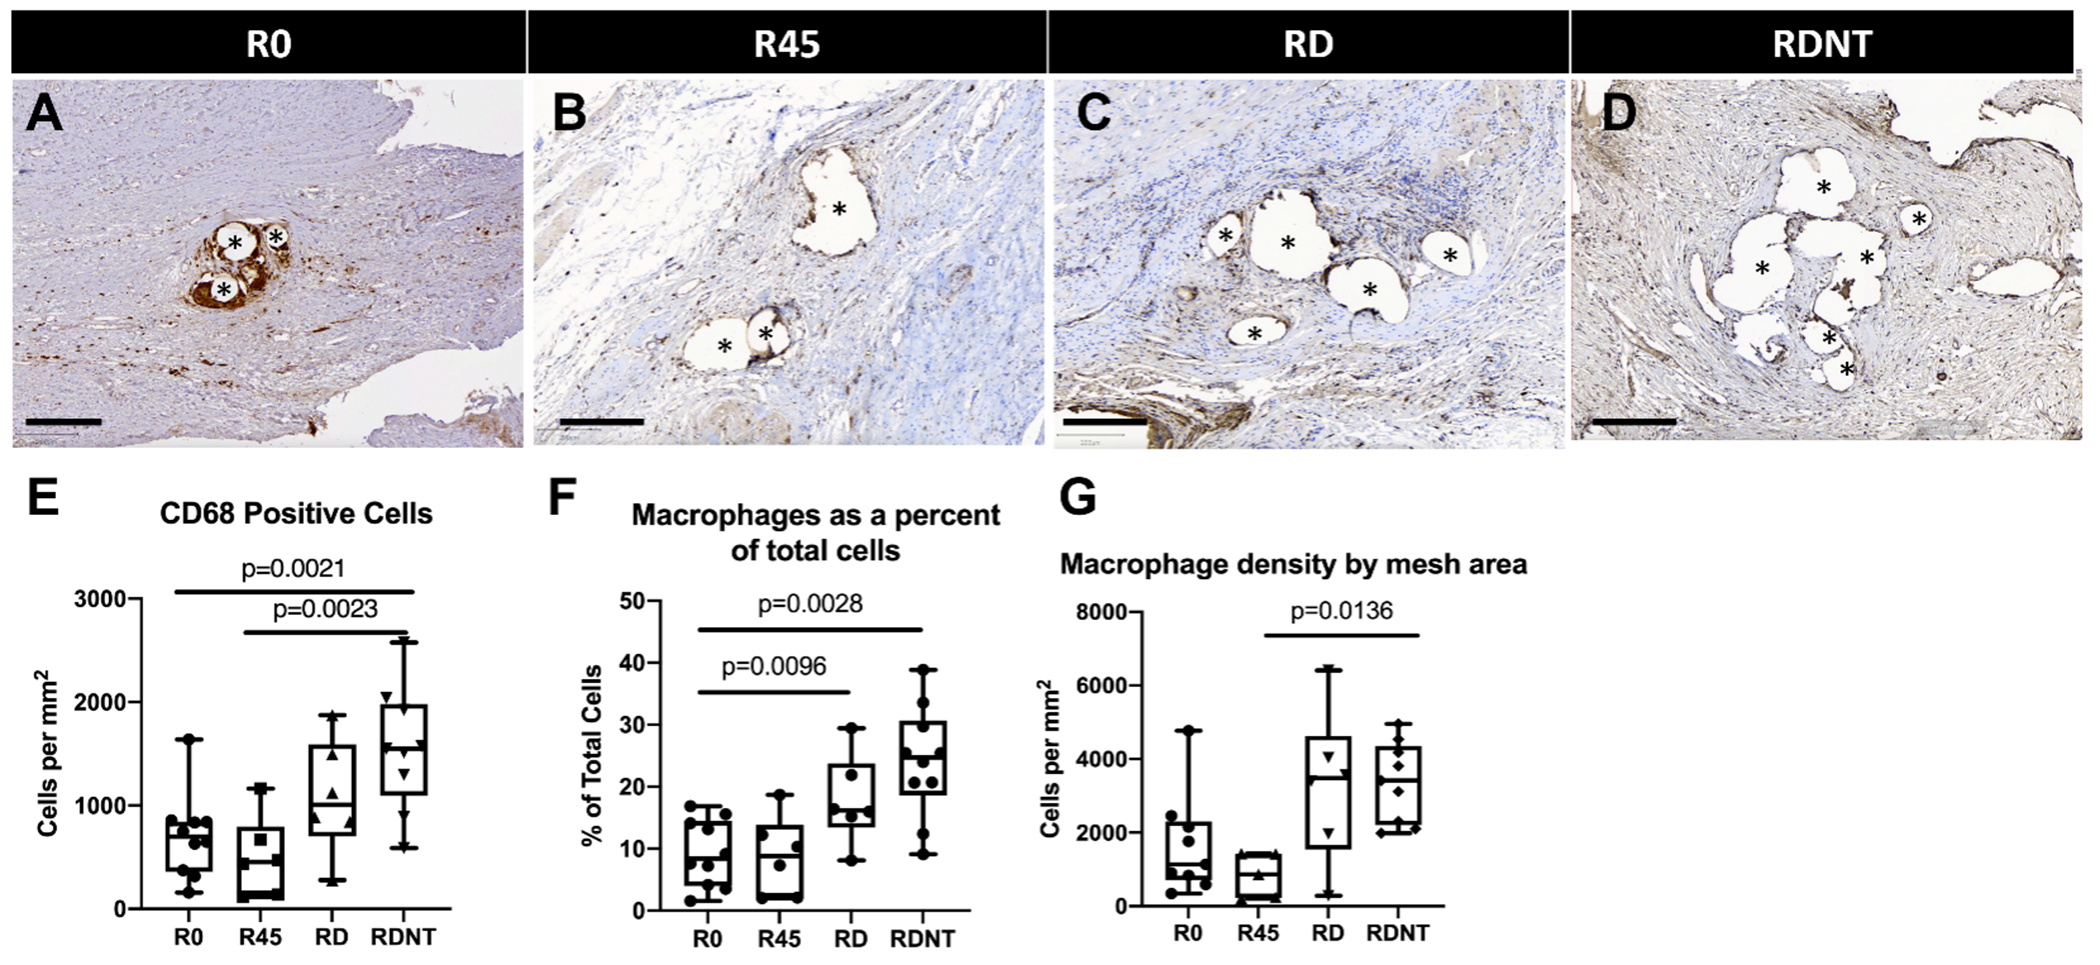
Pelvic organ prolapse (POP) surgical repair with polypropylene mesh (PPM) offers improved anatomical outcomes compared to reconstruction using native tissue. However, PPM repair is hampered by complications, most commonly pain or mesh exposure, occurring in over 10 % of cases. This maladaptive response is, in part, attributed to the host response to a foreign material. Previous studies have demonstrated that mesh properties, such as weight, pore size, and porosity, influence downstream outcomes. In addition, computational models and in vivo mechanistic studies demonstrate that mesh deforms after tensioning in prolapse surgery resulting in collapsed pores and wrinkles. To further investigate the role of pore collapse in mesh complications, PPM was implanted flat, or in configurations that would deform upon tensioning in a POP repair surgery using a non-human primate model. After twelve weeks, we analyzed mesh-tissue complexes to characterize the overall host response, profile the macrophage response, and observe the influence of macrophages in downstream healing outcomes that may lead to complications. The results confirm that mesh deformations reproduce mesh exposure and thinning of vagina. In the PPM configurations with the greatest deformation, mesh burden was the highest, which resulted in an overall decrease in the number of cells within the implantation site. Among the cells that were present, we observed a predominance of M1 pro-inflammatory macrophages. While flat mesh was associated with an organized cellular response, deformed mesh led to an increasingly disorganized response as mesh burden increased. Nearly half of the responding macrophages expressed markers associated both with M1 and M2 phenotypes concurrently, suggesting the possibility of newly recruited macrophages responding even 12 weeks after implantation and/or a repetitive microinjury in which macrophages are continuously recruited and polarized without resolution of the host response. Biochemically, we observed a predominantly M1 pro-inflammatory signaling environment and decreased collagen content as a response to implanted mesh. This study evidences the importance of PPM mesh properties, which may alter mesh burden upon tensioning and impact downstream healing outcomes and emphasizes the need for devices that maintain their geometry following implantation in POP surgical repair.

Keywords: Host response; Macrophage; Mesh burden; Pelvic organ prolapse; Polypropylene mesh; Stress shielding.


Conflict of interest statement

Declaration of competing interest The authors declare the following financial interests/personal relationships which may be considered as potential competing interests:Pamela Moalli reports financial support was provided by National Institutes of Health. Bryan Brown reports financial support was provided by National Institutes of Health. Pamela Moalli reports equipment, drugs, or supplies was provided by Coloplast Corp. Marrisa Therriault reports financial support was provided by National Center for Advancing Translational Sciences. Pamela Moalli reports a relationship with Hologic Inc that includes: consulting or advisory. If there are other authors, they declare that they have no known competing financial interests or personal relationships that could have appeared to influence the work reported in this paper.

Figures

Figure 1:
Figure 1:. Deformations introduced at time of implantation results in clinically relevant complications evidenced at explantation.
Sacrocolpopexy performed on non-human primates shown here implanting a square pored mesh (Restorelle) in 4 different configurations. Restorelle implanted on the square (R0) maintains an open configuration with tensioning (10N) to the sacrum. B. Restorelle rotated 45 degrees (R45) such that the pores are implanted in a diamond configuration which leads to collapse (planar deformation) with 10N of tension, C. Restorelle implanted predeformed (RD) via the introduction of collapsed pores (planar deformation) and wrinkles (nonplanar deformation) prior to implantation and then tensioning at 10N. D. The mesh is implanted with similar deformations to RD but is not tensioned to the sacrum; thus, comprising a “no tension” group (RDNT). E-H. Shows a schematic of the planar deformations of the implanted mesh illustrating the E. Square open-pores in R0, F. Diamond open pores in R45 G and H. Collapsed pores and increased material in RD and RDNT. I-L. Illustrates the non-planar deformations in relation to the vagina, simplifying that I. R0 and J. R45 have no introduced non-planar deformations while K. RD and L. RDNT have introduced wrinkles which provide non-planar deformations. Mesh tissue complexes removed after 12 weeks. M. R0, the optimal outcome, with maintenance of native vaginal structures such as rugae and absence of thinning. N. R45 showing vaginal thinning likely due to stress shielding and regional loss of rugae (circled) and resulting exposures (N=3). O. RD demonstrating that the introduction of deformations reproduces mesh exposures (blue arrows, N=3) through the epithelium in RD (a clinical outcome) with large areas of thinning and loss of rugae (circled). P. RDNT showing severe thinning of the vagina, loss of rugae (circled) exemplifying a loss of the native layers of the vagina to comply to the amount of mesh implanted (N=1 exposure).
Figure 2:
Figure 2:. Cellular density shows trends directly dependent to the local response to mesh.
Identification of the cellular response to implanted mesh was visualized using H and E staining. Samples taken from R0 (A) R45 (B) RD (C) RDNT (D) were brightfield image at 40X and representative images are shown (Scale bar=50um). Histomorphologic experience of cells around the fiber in R0 (A) show an increased density with an organization of collagen seen around the mesh fiber. Loss of this organization is seen from R45 (B) to RD (C) to RDNT (D) where the cells are seen to be disorganized with a loss of tissue between the fibers. Images show the increase in mesh fiber (star) density with increased deformation (R0
Figure 3.
Figure 3.. Macrophage response is reciprocal of the cellular response.
IHC DAB-labelling of CD68 showed pan-macrophage localization to the mesh fibers with nuclei labelled purple using a hematoxylin counterstain imaged using brightfield. Scale bar is 200um. (A) R0 shows a highly localized pan-macrophage response to the mesh knot shown. (B) R45 has a farther spread pan-macrophage response with a layer of CD68+ cells immediately surrounding the mesh. (C) RD shows a localized pan-macrophage response, specifically in between the mesh fibers likely due to the decrease in porosity. (D) RDNT shows a widespread pan-macrophage response that is not immediately correlated to the mesh fibers. (E) Macrophage density, as measured by dividing the amount of CD68+ cells divided by the adventitia area subtracting the area held by mesh shows an increase in the density of CD68+ cells with increasing mesh burden (p=0.0013). This shows that pan-macrophage density is related to mesh burden. (F) As a percentage of total cells in the adventitia, an increase in percentage of macrophages is shown with increased mesh burden, with over a fourth of the cells in the adventitia labeling as macrophages in RDNT (p=0.028). G. Measuring macrophage density normalized to the amount of mesh present in the sample, showed an increase density of macrophages in groups with increasing mesh burden, indicating a relationship between mesh burden and macrophage presence. (p=0.0136).
Figure 4.
Figure 4.. Phenotypically non-traditional macrophages dominate the macrophage response to implanted mesh, independent of mesh burden.
Sections were labelled using an OPAL 4-plex kit labelling CD68 (green), CD206 (yellow), CD86 (red), and DAPI (blue). Scale bars are 200um. A. R0 shows a predominant CD68 response. R45 has a large macrophage response showing CD68+ and CD86+ cells localized to the mesh, with CD206 being more widespread. RD has a significantly larger presence of cells of macrophages, showing a significant and widespread presence of CD86+ cells not only localized to the mesh but throughout the tissue connecting the mesh fibers. RDNT shows an overwhelming presence of macrophages in the adventitia that is predominately M1 (CD86+) with a very small population of CD206+ cells. B. In quantifying the amount of macrophages (CD68+ only) out of all DAPI-labelled cells in the adventitia, showed an increase in macrophages with increasing mesh burden, though not significant (p=0.21). C. First the macrophages were split into phenotypically M1 macrophages (CD68+CD86+) and D. Phenotypically M2 macrophages (CD68+CD206+) this resulted in no significant difference between groups for either analyte (p=0.6, and 0.8, respectively). E. Then, the macrophages were divided into any macrophage that was CD86− to isolate out the macrophages that are traditionally pro-inflammatory. This resulted no significant difference between groups (p=0.5). F. In further phenotyping the macrophages present based on CD68+ (pan-macrophage), CD86+ (M1), and CD206+ (M2) as markers, the percentage of single, double, and triple labelling was expressed as a percent of total macrophages (CD68+). In this, all groups were seen to have a predominately M1 (CD68+CD86+CD206−) response, with a much smaller percentage being M2 (CD68+CD86−CD206+) (p=0.0138). Surprisingly there was a large number of macrophages that expressed both M1 and M2 markers, non-traditionally co-expressing macrophage phenotypic markers (CD68+CD86+CD206+), though not significantly different between groups (p=0.6773). Also, a sizable percentage of the macrophages remained not phenotypically differentiated (CD68+CD86−CD206−) (p=0.5695).
Figure 5.
Figure 5.. Meso-scale discovery shows a significant increase in expression of signaling associated with an M1 phenotype.
A ten-plex meso-scale discovery immuno-assay was performed on excised post-mortem tissue for all groups, included a non-mesh implanted sham. The results shown here are the macrophage related biomarkers performed in the assay. A. Granulocyte-macrophage colony stimulating factor (GM-CSF) was not shown to significantly increase from sham, but exemplified non-zero concentration, indicating that the performance of a surgery promotes GM-CSF, but no amount of mesh burden significantly increases the stimulation of macrophages or premature cells in their lineage (p=0.1094). B. Monocyte chemoattractant protein-1 (MCP-1) was shown to significantly increase from the levels observed in sham with mesh burden (p=0.0281), particularly with RD (p=0.0324). This indicates ongoing recruitment of monocytes to the site of implantation, evidencing an on-going host response to the mesh even 12 weeks after implantation. C. Macrophage inflammatory protein-1a (MIP-1a) was shown to increase with mesh burden (p=0.0126), with a significant increase seen between sham and RDNT (p=0.0212). This indicates mesh burden is associated with pro-inflammatory biomarkers even 12 weeks after introduction of the mesh. D. Interleukin-4 and E. Interleukin-10 are biomarkers associated with an M2 phenotype. Neither biomarker showed a significant increase from sham (p=0.6464, p=0.8780, respectively), however the concentration of these are significantly lower than the concentration of pro-inflammatory markers (MIP-1a). This indicates an overwhelmingly M1-pro-inflammatory response to mesh burden at 12 weeks post implantation.
Figure 6.
Figure 6.. Extracellular matrix components evidence stress shielding as a result of mesh burden.
A-D. Sections were cut and stained to visualize collagen using Massons trichrome. Scale bar is 250um. A. R0 shows highly organized collagen (blue) and organized cells (purple) and vascularization (pink) around predominately single mesh fibers (star). B. The introduction of mesh burden in R45 shows a less organized response to the mesh with collagen beginning to decrease, showing more area of white. C. RD shows an increase in regional mesh fibers, as well as further disorganized collagen surrounding the mesh. D. RDNT shows a large amount of regional mesh fibers, with significantly less/more disorganized collagen in response to the mesh fibers. E. This is shown quantitatively by measuring the percentage of collagen in the adventitia. This showed a significant decrease with the most severe mesh burden from the other groups (p<0.0001). F. Biochemical analysis of the excised post-mortem tissue showed a decrease in collagen content relative to R0 (p=0.0001). G. Picrosirius red staining of the embedded tissue samples were imaged with polarized light to visualize fiber size as expressed by color: red and orange are thicker more mature fibers, and yellow and green are thinner more recently deposited fibers. This analysis showed an overall prevalence of mature or resident collagen in the mesh groups, with yellow and green being a much smaller percentage of the collagen present (p<0.0001). H. Elastin was visualized using a van Geisson staining kit showed no significant difference between groups, but showed a range of 12-18% of the adventitia being elastin (p=0.7849). I. Glycosaminoglycan (GAG) content, determined biochemically from post-mortem tissue, showed a significant increase in GAG content with the most severe mesh burden, RDNT (p=0.0134). These ECM properties show an overall difference remodeling response as demonstrated by ECM deposition increasing mesh burden, supporting the overwhelming response to the mesh being that of stress shielding.

References

    1. DeLancey JO, The anatomy of the pelvic floor. Curr Opin Obstet Gynecol, 6(4): p. 313–6 (1994) - PubMed
    1. Wood LN, Anger JT, Urinary incontinence in women. BMJ 349, g4531 (2014). - PubMed
    1. Zargham M, Alizadeh F, Moayendnia A, Haghdani S, & Nouri-Mahdavi K, The role of pelvic organ prolapse in the etiology of urinary incontinence in women. Adv Biomed Res 2:22, (2013). - PMC - PubMed
    1. Wu JM, Vaughan CP, Goode PS, Redden DT, Burgio KL, Richter HE, & Marklan AD Prevalence and trends of symptomatic pelvic floor disorders in U.S. women. Obstet Gynecol 123, 141–148 (2014). - PMC - PubMed
    1. Olsen AL, Smith VJ, Bergstrom JO, Colling JC, & Clark AL, Epidemiology of surgically managed pelvic organ prolapse and urinary incontinence. Obstet Gynecol 89, 501–506 (1997). - PubMed

LinkOut - more resources