. 2025 Apr;640(8060):1042-1051.
doi: 10.1038/s41586-025-08735-3. Epub 2025 Feb 17.

Characterization of single neurons reprogrammed by pancreatic cancer

Affiliations

Characterization of single neurons reprogrammed by pancreatic cancer

Vera Thiel et al. Nature. 2025 Apr.

Abstract

The peripheral nervous system (PNS) orchestrates organ function in health and disease. Most cancers, including pancreatic ductal adenocarcinoma (PDAC), are infiltrated by PNS neurons, and this contributes to the complex tumour microenvironment (TME)1,2. However, neuronal cell bodies reside in various PNS ganglia, far from the tumour mass. Thus, cancer-innervating or healthy-organ-innervating neurons are lacking in current tissue-sequencing datasets. To molecularly characterize pancreas- and PDAC-innervating neurons at single-cell resolution, we developed Trace-n-Seq. This method uses retrograde tracing of axons from tissues to their respective ganglia, followed by single-cell isolation and transcriptomic analysis. By characterizing more than 5,000 individual sympathetic and sensory neurons, with about 4,000 innervating PDAC or healthy pancreas, we reveal novel neuronal cell types and molecular networks that are distinct to the pancreas, pancreatitis, PDAC or melanoma metastasis. We integrate single-cell datasets of innervating neurons and the TME to establish a neuron-cancer-microenvironment interactome, delineate cancer-driven neuronal reprogramming and generate a pancreatic-cancer nerve signature. Pharmacological denervation induces a pro-inflammatory TME and increases the effectiveness of immune-checkpoint inhibitors. The taxane nab-paclitaxel causes intratumoral neuropathy, which attenuates PDAC growth and, in combination with sympathetic denervation, results in synergistic tumour regression. Our multi-dimensional data provide insights into the networks and functions of PDAC-innervating neurons, and support the inclusion of denervation in future therapies.


Conflict of interest statement

Competing interests: The authors declare no competing interests.

Figures

Fig. 1
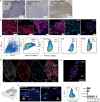
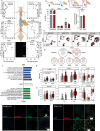
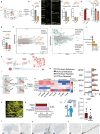
Fig. 1. Characterization of pancreas-innervating neurons through Trace-n-Seq.
a, Schematic of pancreatic neuroanatomy, b, Representative LSFM images of an iDISCO-cleared pancreas stained with a pan-neuronal marker (PRPH). Scale bar, 1,000 μm. c, Trace-n-Seq workflow. Scale bar, 100 μm. d, FACS (n = 6) and microscopy (n = 3) based quantification of FB+ neurons per DRG from thoracic (Th) 5 to lumbar (L) 2 ganglia after intrapancreatic injection of FB. Cell nuclei were visualized with propidium iodide (PI; red). Scale bars, 100 μm. e, Projection of Trace-n-Seq of pancreas-innervating neurons onto the PNS atlas of the mouse nervous system. NEFM, peripheral sensory neurofilament neurons; NPEP, peripheral sensory non-peptidergic neurons; PEP, peripheral sensory peptidergic neurons; NAergic, sympathetic noradrenergic neurons; ChAT, cholinergic neurons. f,g, t-SNE plot from Trace-n-Seq of pancreas CG and DRG neurons (f) and relative expression of marker genes enriched in subclusters (g). Box plots show median and 25% and 75% quantiles, whiskers are 1.5× interquartile ranges, n = 633 cells. h, Schematic: Trace-n-Seq of peritoneum and pancreas. i, t-SNE plot of pancreas DRG neurons and peritoneum DRG neurons. j, Proportions of neuronal subtypes annotated on the basis of a previously published atlas within pancreas- or peritoneum-innervating neurons. Bar plots represent data from 151 cells (pancreas) and 181 cells (peritoneum). Source Data
Fig. 2
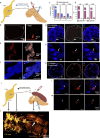
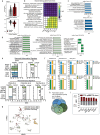
Fig. 2. PDAC induces a tumour-specific neuronal expression profile.
a, Representative images of PRPH-stained pancreas and tumour innervation obtained using LSFM, Scale bars, 1,000 μm. b, Neuronal sprouting quantified in PCP-transformed LSFM images: total nerve area/tissue area in full pancreas (n = 3 mice) and full PDAC (n = 3 mice). Two-tailed unpaired t-test. Mean ± s.d. c, Schematic: Trace-n-Seq in PDAC. d, t-SNE plot of pancreas versus PDAC neurons. e,f, Volcano plots showing number of and exemplary DEGs between pancreas and PDAC in all CG neurons and subclusters (e) and in all DRG neurons and subclusters (f). Genes are considered to be significantly differentially expressed at an adjusted P value of less than 0.1 (DESeq Wald test, Benjamini–Hochberg correction for multiple testing). Ctrl, control. g, Schematic description of PCN-up and PCN-down signatures. h,i, Enrichment analysis of PCN-up and PCN-down signatures for DEGs between pancreas and PDAC in CG and DRG neurons (h) and for DEGs between pancreas and PDAC (PDX) JNG neurons (i). NES, normalized enrichment score. j, Experimental outline: Trace-n-Seq of neurons traced from healthy mice (spleen and peritoneum) or PDX mice (spleen and peritoneum: tumour-adjacent and tumour-distant). k,l, Enrichment analysis of PCN-up and PCN-down signatures comparing CG neurons traced from pancreas versus PDAC, or spleens of healthy versus PDAC (PDX) mice (k), and DRF neurons from pancreas versus PDAC, or peritoneum (healthy versus tumour-adjacent or tumour-distant) (l). m, ROBO2 intensity (gene from PCN-up signature) in nerves innervating the healthy human pancreas or PDAC (n = 11 and n = 9 patients). Two-tailed unpaired t-test. Mean + s.d. Source Data
Fig. 3
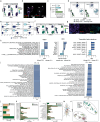
Fig. 3. PDAC alters neuronal interactions and attracts specific subtypes in the TME.
a, Schematic: intrapancreatic melanoma. b, Percentage of FB+ cells per ganglion in CG, DRG and JNG in healthy pancreas (n = 6 mice), PDAC (n = 7 mice) and a model of intrapancreatic melanoma (n = 5 mice). Two-tailed unpaired t-test of PDAC versus melanoma. Mean ± s.d. c, t-SNE of pancreas, KPC and intrapancreatic melanoma neurons. d, Enrichment analysis of PCN-up and PCN-down signatures of DRG neurons in the intrapancreatic melanoma model. e, Number of genes with a fold change of > 0.75 compared with controls, between KPC, melanoma and pancreatitis models in relation to PDX and EPO. f, Heat map of upregulated and downregulated genes in KPC, melanoma and pancreatitis compared with their respective healthy controls. g, Relative gene expression of Slit2 and Calca in pancreas and PDAC (PDX and EPO) DRG neurons. Box plots show median, 25% and 75% quantiles, whiskers are 1.5× interquartile ranges (n = 333 pancreas and 605 tumour neurons). h, Representative original LSFM images of whole pancreas and PDAC specimen stained with CGRP and transformation. Scale bars, 3,000 μm. i, Quantification of CGRP+ nerve fibres per tissue area between pancreas (n = 3) and PDAC (PDX n = 3) specimens. Two-tailed unpaired t-test. Mean ± s.d. j, DRG subtype composition of pancreas and tumour (PDX, EPO, KPC, PDX Barcode-seq, melanoma) and pancreatitis-innervating neurons. k, t-SNE plot of 10X Genomics-based scRNA-seq of pancreas (n = 5,700 cells, 3 replicates) or PDX PDAC tumours (n = 9,151 cells, 4 replicates), coloured by cell type. CAFs are separated into myofibroblast CAFs (myCAFs) and inflammatory CAFs (iCAFs). l, Schematic of receptor–ligand prediction. m, Predicted interaction potential. Red, interaction of TME cells (n = 16,450 cells, 4 replicates) with PDAC neurons; grey, pancreatic cells (n = 20,964 cells, 3 replicates) with pancreas neurons. Multiple unpaired t-test. Mean ± s.d. n,o, Interaction scores of the ten most-changed receptor–ligand interactions between healthy pancreas CG (n) or DRG (o) neurons and cell types in the healthy pancreas (epithelial and fibroblast) and PDAC CG (n) or DRG (o) neurons and cell types in the TME (PDAC and CAFs). Source Data
Fig. 4
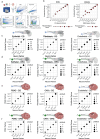
Fig. 4. Denervation slows PDAC growth and induces pro-inflammatory changes in CAFs, sensitizing PDAC to ICIs.
a, Schematic of sympathetic denervation in orthotopic and subcutaneous tumour. b, Tumour weight of orthotopic PDX mice; control (n = 10 mice) versus different denervation conditions (n = 5 mice each). Two-tailed unpaired-test. Mean ± s.d. c, Tumour weight of orthotopic KPC-allograft mice; control versus the 6-OHDA denervation condition (n = 5 mice). Two-tailed unpaired t-test. Mean ± s.d. d, Tumour weights of subcutaneously transplanted PDAC PDX mice; control versus the 6-OHDA denervation condition (n = 5 mice). Two-tailed unpaired t-test. Mean ± s.d. e, Representative PRPH-stained LSFM imaging of control PDAC or denervated tumours. Scale bars, 1,000 μm. f, t-SNE plot of 10X Genomics-based scRNA-seq of PDX PDAC tumours (n = 9,151 cells, 4 replicates) or denervated PDX PDAC tumours (n = 9,607 cells, 3 replicates), coloured by cell type. g, GSEA of PDAC cells for control versus denervated PDX tumours. h, GSEA of G2M checkpoint for control versus denervated tumours. i, Relative percentage of stromal cells in control and denervated PDX tumours, analysed by flow cytometry. Two-tailed unpaired t-test. Mean ± s.d. j, GSEA of fibroblasts from control versus denervated PDX tumours. k, Predicted interaction potential by fibroblast and ganglion type (grey, healthy pancreas fibroblasts with pancreas neurons (n = 3 mice); red, PDAC fibroblasts with PDAC neurons (n = 4 mice); yellow, denervated PDAC fibroblasts with PDAC neurons (n = 3 mice)). Two-tailed unpaired t-test. Mean ± s.d. l, Percentage of CD45+ cells in control (n = 4 mice) and denervated KPC tumours (n = 5 mice) analysed by flow cytometry. Two-tailed unpaired t-test. Mean ± s.d. m, Schematic of treatment regimen. n, Tumour weight of KPC-allograft mice; control versus nivolumab, 6-OHDA and combinational treatment (nivolumab + 6-OHDA) (n = 5 mice). Two-tailed unpaired t-test. Mean ± s.d. Source Data
Fig. 5
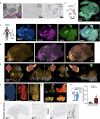
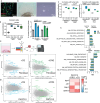
Fig. 5. Nab-paclitaxel reduces tumour growth by depleting tumour-infiltrating neurons.
a, Experimental set-up. b, Tumour weight of primary orthotopic (1) untreated (n = 5), (2) 6-OHDA denervated (n = 4), sham-operated (partial pancreatomy) and (3) secondary untreated (n = 5) or (4) 6-OHDA denervated, (primary tumour resected) PDX mice (n = 5). Two-tailed unpaired t-test. Mean ± s.e.m. c, Experimental set-up: Trace-n-Seq and PDAC resection. d, Enrichment analysis of PCN-up and PCN-down signatures of CG and DRG neurons 28 days after tumour resection (tumour-free) or sham operation (partial pancreatomy) in a comparison of pancreas and PDAC neurons. e, Representative images and tumour weight of mice treated with nab-paclitaxel (10 mg kg−1) compared with untreated controls after two cycles (early) and four cycles (late) (n = 5). Two-tailed unpaired t-test. Mean ± s.d. f, Representative LSFM images of PDAC control versus nab-paclitaxel-treated mice. Scale bars, 1,000 μm. g, Quantification of nerve volume per tumour area between PDAC control (n = 3) and nab-paclitaxel-treated (n = 3) specimens. Two-tailed unpaired t-test. Mean ± s.d. h, FB+ CG and DRG cells after retrograde tracing of pancreas (grey), PDX control (red), or after treatment with nab-paclitaxel (pink) for two or four cycles. Two-tailed unpaired t-test, n = 4 mice per condition. i, Tumour weight of control mice or mice treated with oxaliplatin, after two cycles (n = 5). Two-tailed unpaired t-test. Mean ± s.d. j, Relative reduction of FB+ cells in CG and DRG after retrograde tracing of PDX; control or after treatment with nab-paclitaxel or oxaliplatin (n = 4). k, Quantification of nerves per tissue area of human PDAC (naive or after neoadjuvant FOLFIRINOX or nab-paclitaxel and gemcitabine treatment) from neurofilament-stained IHC slides (n = 10 patients each). Mann–Whitney test. Mean ± s.e.m. l, Representative LSFM images after treatment with nab-paclitaxel and 6-OHDA. Scale bar, 1,000 μm. m, Tumour weight of orthotopic PDX mice (control or treated with 6-OHDA, nab-paclitaxel (10 mg kg−1) or both) (n = 5). Two-tailed unpaired t-test. Mean ± s.d. n, Tumour weight of subcutaneous PDX mice (control or treated with 6-OHDA, nab-paclitaxel (10 mg kg−1) or both) (n = 5). Two-tailed unpaired t-test. Mean ± s.d. o, Relative reduction in tumour weight after various treatments in the orthotopic and subcutaneous models. Source Data
Extended Data Fig. 1
Extended Data Fig. 1. Three-dimensional landscape of pancreatic innervation.
a, Representative images of nerve axons in whole pancreata obtained using LSFM stained by pan-neuronal marker PRPH (blue), sympathetic marker TH (red), sensory marker CGRP (green). b, Quantification of neuronal innervation using machine-learning algorithm. PRPH (violet), TH (red), CGRP (green) positive staining was quantified in a 3D to 2D algorithm and neuronal content was predicted (PCP yellow). Tissue area was predicted based on the autofluorescence of the tissue (dark blue). c, PCP based quantification of PRPH+, TH+, CGRP+ nerve /pancreas area (n = 7 mice). d, Images of the spine including DRG ganglia containing neuronal cells/axon stained with pan-neuronal marker PRPH obtained using LSFM. Spine is projected (blue) and nerve area (orange and yellow), LSFM image of the CG area, pancreas and spleen. Areas are marked in orange (ganglion area), pancreas (light red) and spleen (dark red). e, Representative quantification of neuronal innervation using machine-learning algorithm of sympathetic and sensory axons in the pancreas. Positive staining was quantified in a 3D to 2D algorithm and neuronal content was predicted (PCP yellow). Source Data
Extended Data Fig. 2
Extended Data Fig. 2. Validation of Trace-n-Seq labelling.
a, H&E of DRG and CG section and IHC of CG stained with TH. b, Representative IF staining of CG stained either for PRPH, TUBB3 or TH, and DRG stained either for PRPH, CGRP or TH. DAPI serves as a nuclear staining. c, FACS scheme of retrogradely labelled neurons. Neurons are enriched with the probe NeuO before gating on FB+ cells. d, Retrogradely labelled cells in a CG 7 days after FB (blue) injection in the pancreas co-stained with DRAQ5 (nuclear dye, white) and TUBB3 (pan-neuro marker, red), scale bar 100 µm. e, Retrogradely labelled cells in the dorsal root ganglion 7 days after FB injection in the pancreas co-stained with PI, scale bar 100 µm. f, Schematic of pancreatic neuroanatomy of the jugular nodose ganglion (JNG) as part of the vagus nerve. g, Retrogradely labelled cells in the jugular nodose ganglion 10 days after FB injection in the pancreas of both sites. Arrows mark positive cells. h, FB+ tracing efficiency in the JNG after injection in the pancreas analysed by FACS. i, FB+ tracing efficiency per CG after injection in the pancreas, peritoneum colon and spleen analysed by FACS, n = 3. Source Data
Extended Data Fig. 3
Extended Data Fig. 3. Comparison of retrograde tracer efficiency.
a, Schematic of intrapancreatic labelling using FB and AAV6. b, retrogradely labelled cells in a CG 7 days after AAV6 (mCherry, red) injection in the pancreas, scale bar 50 µm, and zoom-in on mCherry-positive cell, scale bar 10 µm. c, FACS based analysis of AAV6 and FB positive cells per CG after 28 days of tracing. Shown are % of labelled cells per dye; n = 1. d, FACS based analysis of AAV6 double (also FB) and single positive cells per total number of AAV positive cells after 28 days of co-tracing. e, Image of full pancreas section 10 days after AAV6 injection shows distribution of the tracer throughout the pancreas, mostly positivity is observed at the injection sites. f, Image of full pancreas section 10 days after FB injection shows distribution of the tracer throughout the pancreas, universal positivity is observed in the entire organ. g, Retrogradely labelled cells in a CGs 7 days after co-injection of FB (blue) and FluoroRuby (FR, red) in the pancreas. h, and zoom-in on double-positive (FB+/FR+) cell, marked by white arrow. i, Schematic of intrapancreatic and intrasplenic labelling using FB (pancreas) and FR (spleen) with shared nerve axons. j, LSMF image of CG-pancreas-spleen area stained with peripherin. Different areas marked as indicated, white arrow points to nerve axon sprouting through pancreas and spleen. k, Retrogradely labelled cells in a CG 7 days after injection of FB (blue) in the pancreas and FluoroRuby (FR, red) into the spleen, scale bar 50 µm. l, and zoom-in on double-positive (FB+/FR+) cell, sprouting through pancreas and spleen, marked by white arrow, scale bar 20 µm. m, and zoom-in on single-positive (FR+) cell, traced from spleen, not projecting through pancreas, marked by white arrow, scale bar 20 µm.
Extended Data Fig. 4
Extended Data Fig. 4. Quality control of scRNA-seq data generated by Trace-n-Seq.
Smart-seq quality was assessed among different sequencing lanes by. a, Number of obtained reads/ lane. b, Number of detected genes/cell. c, Proportion of mitochondrial reads. d, Proportion of exonic reads of total mapped genes, e, Identifying events that are cells. f, Annotation efficiency. g, Annotation confidence according to a previous report. h, Annotation of broad cell types. Barcode-seq quality was assessed among sequencing lanes by. i, Proportion of mitochondrial reads. j, Number of detected genes/cell. k, Number of sequenced reads. l, Proportion of exonic reads of total mapped genes, m, Identifying events that are cells. n, Annotation efficiency. o, Annotation confidence according to a previous report. p, Annotation of broad cell types.
Extended Data Fig. 5
Extended Data Fig. 5. Atlas-based cell-type annotation of Trace-n-Seq data.
a, t-SNE plots comparing relative expression of Prph in Smart-seq and Barcode-seq-based scRNA-seq of pancreas-innervating CG and DRG and t-SNE plots of Smart-seq-based scRNA-seq of pancreas-innervating CG, JNG and DRG neurons. b, Projection of our dataset of pancreas-innervating neurons onto the PNS atlas of the mouse nervous system separated for the Smart-seq and Barcode-seq dataset. c, Neuronal subtype abundance of pancreatic sympathetic (CG) and sensory (DRG, JNG) neurons compared to a reference atlas. d, In-depth neuronal subtype proportion of sympathetic and sensory neurons in the pancreas (BL6, NSG, Smart-seq and Barcode-seq) compared to the full PNS reference. e, PC plot from Trace-n-Seq of NSG and BL6 DRG neurons with clusters annotated based on a previous report. f, Projection of our dataset of pancreas-innervating DRG neurons onto a previously published DRG atlas. g, t-SNE plot from Trace-n-Seq of pancreas CG and DRG neurons with clusters annotated based on previous reports,. h, t-SNE of DRG and JNG sensory neurons in the pancreas annotated in a previous report. i, Neurotransmitter status of pancreas CG, JNG and DRG neurons, j, Overlay of DRG subtypes between broad annotation in previous studies.
Extended Data Fig. 6
Extended Data Fig. 6. Identification of neuronal subtypes in peripheral ganglia.
a, Relative expression of Slit2 and Calca defining DRG clusters. b, IF staining of DRG ganglia for SLIT2 (yellow) and CGRP (green) scale bar 200 µm. c, Quantification of FB+, SLIT2 or CGRP labelled neurons in DRG n = 3 mice. d, t-SNE plot from Trace-n-Seq of pancreas CG and DRG neurons (BL6/ NSG). e, Relative expression marker genes enriched in CG subclusters. The box plots show median and 25%- and 75%-quantiles, the whiskers 1.5 interquartile ranges. f, Relative expression of Th, Shox2 and Socs2 defining CG subclusters. g, IF staining of CG section with TH, SHOX2, SOCS2; scale bar 100 µm. h, GSEA, differential expression and transcription factor analysis between clusters NAergic CG1 and NAergic CG2. i, GSEA between CG Cluster 1 and Cluster 2 (shown as CG1 up/down, down in CG1 means up in CG2). j, Broad subtype proportion of sensory pancreas neurons compared to sensory peritoneum neurons annotated in a previous study, k, In-depth subtype proportion of sensory pancreas neurons compared to sensory peritoneum neurons annotated in a previous study. l, Subtype proportion of sensory pancreas neurons compared to sensory peritoneum neurons annotated in a previous report. m, Schematic of retrograde labelling of spleen- pancreas- colon- and peritoneum neurons. n, t-SNE of scRNA-seq (Smart-seq, NSG) of 102 pancreas, 181 peritoneum, 76 spleen and 128 colon innervating neurons. Source Data
Extended Data Fig. 7
Extended Data Fig. 7. Imaging of neuronal infiltration in PDAC.
a, H&E of PDAC (PDX- PACO10) specimen, IHC of PDX and EPO specimen stained for pan-neuronal marker PRPH. b, EPO model schematic and image by LSFM. c, Schematic of intrapancreatic PDX model and representative images of tumour innervation obtained using LSFM. PRPH (blue), TH (violet), CGRP (green). d, Representative images of tumour innervation obtained using LSFM. TH (violet), VAChT (yellow). e, Representative images of tumour innervation obtained using LSFM from four different angles of the tumour. f, Representative images of quantification of neuronal innervation using PCP. Tumour area was predicted using autofluorescence. Positive staining (red) was quantified in a 3D algorithm and neuronal content was predicted (Yellow). g, PCP prediction of nerves (yellow) in pancreas specimen imaged by LSFM with (red) and without tissue prediction (upper part) and PCP prediction of nerves (yellow) in PDAC specimen imaged by LSFM with (red) and without tissue prediction (lower part). h, Quantification of nerve/tissue area of matched human pancreas (grey) and treatment naive PDAC in (red) NF stained IHC slides (n = 10). Mann–Whitney test. Mean +/− SEM. i, Images of stained tissues of NF1 stained IHC slides. Source Data
Extended Data Fig. 8
Extended Data Fig. 8. Neuronal reprogramming in PDAC neurons.
a, FACS and microscopy based quantification of FB+ DRG neurons. Pancreas/PDAC innervation after retrograde labelling of DRG (single) analysed by FACS (left and right) and IF confocal microscopy (n = 3). b, FACS based quantification of FB+ DRG, JNG and CG neurons. Pancreas/PDAC innervation after retrograde labelling of DRG (Th5-L1 combined) analysed by FACS microscopy (n = 3). Two-tailed unpaired t-test PDAC vs healthy traced neurons: ns for all comparisons. c, Proportion of total number of neurons (mean of NeuO+ cells per CG) pancreas/PDAC (n = 3). d, t-SNE plot of pancreas vs. PDAC neurons in by Smart-seq (BL6 and PDX) and Barcode-seq. e, GSEA analysis of transcription factor signatures deregulated in pancreas/PDAC subclusters. f, GSEA analysis of top upregulated gene sets in PDAC in detected CG or DRG. g, Gene expression of selected DEGs: Lin28b between pancreas and PDX CG and DRG neurons in total or for the separate neuronal subtypes. All box plots in this figure show median, 25%- and 75%-quantiles, whiskers 1.5 interquartile ranges and represent data from 333 (pancreas) and 605 (tumour) cells. h, Gene expression of selected DEGs Sema5a between pancreas and PDAC CG and DRG neurons in total or for the separate neuronal subtypes. i, Validation of sequencing results by IF staining of healthy CG of LIN28B and SEMA5a. j, Validation of sequencing results by IF staining of PDAC CG of LIN28B and SEMA5a. Source Data
Extended Data Fig. 9
Extended Data Fig. 9. Functional signature in PDAC neurons.
a, Relative gene expression of DEG Robo1 and Tubb5 between pancreas and PDAC CG neurons. b, GSEA analysis: Most commonly shared from top 20 up- and downregulated gene sets between subclusters. c, GSEA between pancreas and PDAC CG neurons specified to CG Cluster 1 and Cluster 2. d, GSEA between pancreas and PDAC DRG neurons specified to different neuronal subtypes (NEFM, PEP, NPEP). e, GSEA analysis of signatures of neuronal inflammation and injury on DEG analysis of pancreas/PDAC subclusters. Coloured bar had a FDR < 0.05. f, Display of number of genes that are DEG in the pancreas-PDAC neuron dataset, the number of genes reported in the published injury or inflammation signatures and the overlay of common genes found in both, for sympathetic CG and sensory DRG neurons. g, t-SNE of the injury dataset overlayed with our analysed PDAC-innervating neurons. h, Schematic of shared DEGs between subclusters used for PCN signature. i, Enrichment analysis of PCN-up/down signatures of all DRG/ CG neuron subtypes based on Smart-seq.
Extended Data Fig. 10
Extended Data Fig. 10. Neuronal expression changes in cancer and pancreatitis.
a, List of all genes of the PDAC up and down signatures, + indicates whether the gene was detected as differential in the specific neuronal subtype. b, Enrichment analysis of PCN-up/down signatures of DRG/ CG neurons based on Barcode-seq. c, Enrichment analysis of PCN-up/down signatures of CG neurons in male PDX model. d, t-SNE of pancreas and KPC-allograft innervating neurons. e, Enrichment analysis of PCN-up/down signatures of DRG neurons in KPC-Allograft model. f, Enrichment analysis of PCN-up/down signatures of DRG all, NEFM, PEP, NPEP neurons in KPC-Allograft model. g, Neuronal subtypes within the JNG in healthy pancreas and PDAC (PDX) innervating neurons annotated based on ref. . h, Enrichment analysis of PCN-up/down signatures of DRG all, NEFM, PEP neurons in JNG between healthy pancreas NSG vs PDAC (PDX) model. i, Enrichment analysis of PCN-up/down signatures of sympathetic neurons in the melanoma model. j, GSEA analysis: Most commonly shared up- and downregulated gene sets between subclusters in the melanoma model. k, Schematic of acute pancreatitis model in BL6 mice. l, t-SNE of healthy pancreas control- and pancreatitis-innervating neurons, cell types annotated in a previous study. m, Number of DEGs between healthy pancreas control- and pancreatitis-innervating neurons among the different neuronal subtypes. n, Trpa1 expression in DRG subtypes between healthy control neurons and neurons innervating acute pancreatitis. logFold Change based on control cells and pancreatitis sc- neurons, DESEQ2. o, Enrichment analysis of neuronal inflammation signatures on pancreas vs. pancreatitis-innervating DRG neuron subclusters. p, GSEA analysis of signatures of neuronal injury on DEG analysis of pancreas/pancreatitis DRG subclusters. q, GSEA analysis of signatures of neuronal inflammation and injury on DEG analysis of pancreas/pancreatitis CG neurons. r, Heat map of up- or downregulated genes across the different models of KPC, melanoma and pancreatitis compared to their respective healthy controls. s, Venn diagram of shared up/downregulated genes in KPC-, melanoma- and pancreatitis model. t, Venn diagram of shared upregulated genes in KPC-, melanoma- and pancreatitis model.
Extended Data Fig. 11
Extended Data Fig. 11. SLIT2-expressing NEFM neurons preferentially innervate cancer.
a, Representative LSFM staining of CGRP+ neurons (green) in the pancreas and PDAC and PCP based prediction (yellow) for quantification. b, IF staining of full DRG ganglia section retrogradely labelled (FB, blue) form healthy mice stained with DRAQ5 (red) and antibody for CGRP (Calca protein, green) and retrogradely labelled from PDAC mice including zoom-in. c, IF staining of full DRG ganglia section retrogradely labelled (FB, blue) form healthy mice stained with DRAQ5 (red) and antibody for SLIT (white) and retrogradely labelled from PDAC mice including zoom-in. d, Quantification of FB+, SLIT2 or CGRP labelled neurons in DRG n = 3 mice. Two-way ANOVA test. e, Gene expression of Slit2 and Calca between pancreas and PDAC neuron for the different DRG subtypes. Box plots in this figure show median, 25%- and 75%-quantiles, whiskers 1.5 interquartile ranges and represent data from 333 (pancreas) and 605 (tumour) cells. Wilcoxon test. f, Neuronal subtype proportion of sensory DRG neurons in pancreas versus in PDAC (EPO, PDX, PDX Barcode-seq, KPC) melanoma and in the JNG annotated in a previous report. g, Quantification of nerve/tissue area of human pancreas (grey) and treatment naive PDAC (red) stained with NF (n = 10) and CGRP (n = 9 pancreas, n = 7 PDAC). P value was determined with two-tailed unpaired t-test. Mean +/− SD. h, x-fold increase of NF+ neurons/tissue area or CGRP+ neurons/tissue area from pancreas and PDAC. P value was determined with unpaired t-test. Mean +/− SD. i, Intensity of CGRP expression within nerve structures in human pancreas (grey) and treatment naive PDAC (red) (n = 10) and CGRP. P value was determined with unpaired t-test. Mean +/− SD. j, Schematic summary of induced neuronal changes by PDAC. Source Data
Extended Data Fig. 12
Extended Data Fig. 12. Receptor–ligand pairs overexpressed in PDAC and its TME.
a, FACS scheme used to identify different TME population in pancreas, PDAC and PDAC denervated samples. b, Interaction score of the 10 most-changed receptor/ligand interactions between healthy pancreas CG neurons and endothelial cells in the healthy pancreas (grey) and PDAC CG neurons and endothelial cells in the TME (red). c, Interaction score of the 5 strongest receptor/ligand interactions in healthy pancreas CG neurons and cell types in the healthy pancreas (epithelial, fibroblast, endothelial). d, Interaction score of the 5 strongest receptor/ligand interactions in healthy pancreas DRG neurons and cell types in the healthy pancreas (epithelial, fibroblast, endothelial). e, Interaction score of the 5 strongest receptor/ligand interactions in PDAC CG neurons and cell types in the TME (PDAC, CAFs, endothelial). f, Interaction score of the 5 strongest receptor/ligand interactions in PDAC DRG neurons and cell types in the TME (PDAC, CAFs, endothelial).
Extended Data Fig. 13
Extended Data Fig. 13. In vitro neuronal co-cultures increase PDAC and CAF proliferation.
a, IF labelling using PRPH (green) and SOX10 (red, glia marker) of mouse ganglia in vitro to validate neuronal content in culture (performed for n = 6 CG (mice) and 8 DRG (from 3 mice) in 3 experiments). b, Representative brightfield microscopy image of in vitro cultured ganglia neurons (from n = 6 mice). c, Proliferation of indicated cultured cells in a transwell either alone or with ganglion explants (each ganglion replicate is one mouse): PDAC (PACO10) cells or human fibroblasts alone (ctrl, grey) or cultured in CG (blue)/DRG (green) (n = 8 each, from 2 independent experiments). And KPC cells alone (n = 8) or mouse CAFs alone (n = 4, ctrl, grey) or cultured with CG (blue)/DRG (green) (n = 4 each) analysed by CTB. Ordinary one-way ANOVA. Median +/− SD is shown, d, CTB assays of PDAC (PACO) cells cultured in transwells either alone (Ctrl n = 24) or with CG/DRG cultures of ganglia extracted from either NSG or BL6 mice (n = 12). Derived from 3 experiments. Min-max is shown. P value was determined by multiple t-test. Every condition was compared to control PACO cells. P value < 0.0001 for all conditions; and (2) confluence measurement between control PDAC (PACO43) cells or PDAC cells supplemented with conditioned medium from ganglion explants for 4 days of CG/DRG from NSG and BL6 mice. The increase in confluency was measured with the cytosmart software at day 0 and after 3 days of co-culture (n = 3) Experiment was repeated 3 times. P value was determined by multiple t-test. Mean +/− SD. e, Schematic outline of co-culture of in vitro ganglion with PDAC (PACO10)/Fibroblast cells, FACS separation and bulk RNA-seq approach. f, Volcano Plot of Fibroblasts control vs CG (blue) or DRG (green) co-cultured fibroblast cells (n = 3 replicates/mice). Genes are considered to be significantly differentially expressed at an adjusted P value of <0.1 (DESeq Wald test, Benjamini–Hochberg correction for multiple testing). g, Volcano plot of PDAC cells control vs CG (blue) or DRG (green) co-cultured PDAC cells (n = 3 replicates/mice). Genes are considered to be significantly differentially expressed at an adjusted P value of <0.1 (DESeq Wald test, Benjamini–Hochberg correction for multiple testing). h, GSEA of PDAC cells cultured alone vs. with CG (blue) and DRG (green) cells. i, GSEA of fibroblast cells co-cultured with CG (blue) and DRG (green) cells. j, Heat map of DEGs in vitro in the co-culture of PACO10 cells with CG/DRG cells also found differentially expressed in PDX PDAC cells between control and denervated tumours in vivo. Source Data
Extended Data Fig. 14
Extended Data Fig. 14. Denervation inhibits tumour growth and local relapse in PDAC.
a, Schematic of in vivo denervation approaches. b, Tumour weight of orthotopic PDX mice, control (n = 5) vs. 6-OHDA denervation mice (n = 5) at an early time point (tumour establishment). P value was determined by two-sided unpaired t-test. Mean +/− SD is shown. c, Representative pictures of LSFM imaging of orthotopic and subcutaneous tumours of untreated control PDAC or denervated tumours (surgical or 6-OHDA) stained with an anti-PRPH antibody (yellow). d, PCP based quantification of PRPH+ nerve fibres/tissue area between PDAC controls (n = 2) and denervated PDAC specimen (n = 2) and between subcutaneous PDAC controls (n = 2) and denervated PDAC-s.c. (n = 3). e, Validation of denervation efficacy: % of FB+ cells in the CG traced from untreated PDAC control tumours and 6-OHDA denervated tumours (n = 7/3). P value was determined by two-tailed unpaired t-test. Mean +/− SD is shown. f, Tumour weight of orthotopic PDX mice, control (n = 9) vs. Botox (n = 5) denervation. P value was determined by two-tailed unpaired t-test. Mean +/− SD is shown. g, Relative percentage of stroma cells in control (n = 4) and BOTOX denervated PDX tumours (n = 3) analysed by flow cytometry. Two-tailed unpaired t-test. Mean +/− SD is shown. h, Volcano plot of DEGs from PDAC cells of control (n = 4 mice) vs. denervated (n = 3 mice) PDX tumours. Genes are considered to be significantly differentially expressed at an adjusted P value of <0.1 (DESeq Wald test, Benjamini–Hochberg correction for multiple testing). i, Volcano plot of Fibroblast cells from control (n = 4 mice) vs denervated (n = 3 mice) PDX tumours. Genes are considered to be significantly differentially expressed at an adjusted P value of <0.1 (DESeq Wald test, Benjamini–Hochberg correction for multiple testing). j, X-fold reduction of tumour weight in mice with 1. Control tumours treated with vehicle control, 2. Tumours treated with ICI nivolumab mono, 3. Denervation via 6-OHDA mono, 4. Combination of 6-OHDA based denervation and Nivolumab treatment. k, Schematic of immune phenotype in fibroblast upon denervation and enablement of ICI-based tumour killing. l, Schematic: PDAC/Pancreas resection after FB injection. m, PCN-signature enrichment in neuronal subtypes compared to the PDX mice. n, Heat map of DEGs from the PCN- signature in the resected model. o, Representative image of PCP based quantification of tumours. p, x-fold reduction of total neurons per CG (NeuO+ cells) after nab-paclitaxel (pink) treatment (4 cycles) in comparison to untreated control tumours (red). Changes were ns (two-tailed unpaired t-test, n = 3). q, Quantification of count of nerve structures of human PDAC naive (red), and PDAC after neoadjuvant nab-paclitaxel/Gemcitabine (pink) treatment of neurofilament-stained IHC slides (n = 10). P value was determined by Mann–Whitney test.+/− SD. r, Representative images of NF1 stained IHC slides of human pancreas, s, PDAC naive, t, and PDAC post nab-paclitaxel treatment. Source Data
Extended Data Fig. 15
Extended Data Fig. 15. Denervation synergizes with taxane-based chemotherapy in PDAC.
a, Quantification of TH + nerve/tissue area of human pancreas (grey, n = 10), PDAC naive (red, n = 10), and PDAC after neoadjuvant nab-paclitaxel/Gemcitabine (pink, n = 9) treatment of TH stained IHC slides (n = 10). P value was determined by two-tailed unpaired t-test +/− SD. b, t-SNE of retrogradely labelled CG and DRG neuronal cells traced from healthy pancreas, PDX control and nab-paclitaxel treated PDX mice after 2 and 4 cycles (n = 4 mice per condition). c, t-SNE of retrogradely labelled CG neuronal cells traced from healthy pancreas, PDX control and Oxaliplatin-treated PDX mice (n = 3 mice per condition). d, Number of DEGs in CG and DRG neuronal subtypes between healthy pancreas and PDAC neurons, PDAC control and PDAC neurons of nab-paclitaxel treated mice. e, Number of DEGs in CG neuronal cells between healthy pancreas and PDAC neurons, PDAC control and PDAC neurons of Oxaliplatin-treated mice. f, Heat map of DEGs in CG neuronal cells between deregulated between healthy pancreas and PDAC neurons and PDAC control and PDAC neurons of nab-paclitaxel and Oxaliplatin-treated mice. g, Schematic of in vivo denervation and combinatorial treatment approaches. h, Images of extracted tumours after different denervation and treatments in the orthotopic and subcutaneous PDX model. N = 5. i, Tumour weight of orthotopic control (n = 9), 6-OHDA denervated (n = 4), nab-paclitaxel (10 mg/kg) (n = 4) and the combination of treated PDX mice (n = 4) after reduced cumulative doses. P value was determined by two-tailed unpaired t-test. Mean +/− SD is shown. j, PCP based quantification of PRPH+ nerve fibres/tissue area between PDAC controls (n = 2) and denervated PDAC specimen (n = 2) and between subcutaneous PDAC controls (n = 2) and denervated PDAC-s.c. (n = 3). P value was determined by unpaired t-test. Mean +/− SD is shown. k, Representative images of the PCP based prediction of innervation in orthotopic PDAC specimen of control and after treatment (denervation, nab-paclitaxel, 6-OHDA+nab-paclitaxel) and representative images of the PCP based prediction of innervation in subcutaneous PDAC specimen of control and after denervation. l, Schematic summary of results. m, Schematic and tumour weight of orthotopic control (n = 9), Botox denervated (n = 5), nab-paclitaxel (10 mg/kg) (n = 4) and the combination of treated PDX mice (n = 5). P value was determined by two-tailed unpaired t-test. Mean +/− SD is shown. n, Tumour weight of orthotopic control (n = 8), 6-OHDA denervated (n = 4), Oxaliplatin (n = 5) and the combination of treated PDX mice (n = 5). P value was determined by two-tailed unpaired t-test. Mean +/− SD is shown. o, Relative tumour weight reduction upon different treatments (6-OHDA, Oxaliplatin, Combi) in the orthotopic model in comparison to control mice. p, Relative tumour weight reduction upon different treatments (Botox, nab-paclitaxel, Combi) in the orthotopic model in comparison to control mice. Source Data

References

    1. Demir, I. E. et al. Future directions in preclinical and translational cancer neuroscience research. Nat. Cancer1, 1027–1031 (2020). - PMC - PubMed
    1. Demir, I. E. et al. Clinically actionable strategies for studying neural influences in cancer. Cancer Cell38, 11–14 (2020). - PubMed
    1. Bejarano, L., Jordāo, M. J. & Joyce, J. A. Therapeutic targeting of the tumor microenvironment. Cancer Discov.11, 933–959 (2021). - PubMed
    1. Dominguez, C. X. et al. Single-cell RNA sequencing reveals stromal evolution into LRRC15+ myofibroblasts as a determinant of patient response to cancer immunotherapy. Cancer Discov.10, 232–253 (2020). - PubMed
    1. Iwai, Y. et al. Involvement of PD-L1 on tumor cells in the escape from host immune system and tumor immunotherapy by PD-L1 blockade. Proc. Natl Acad. Sci. USA99, 12293–12297 (2002). - PMC - PubMed

MeSH terms

LinkOut - more resources