

A machine learning model based on preoperative multiparametric quantitative DWI can effectively predict the survival and recurrence risk of pancreatic ductal adenocarcinoma
- PMID: 39962007
- PMCID: PMC11833029
- DOI: 10.1186/s13244-025-01915-9
A machine learning model based on preoperative multiparametric quantitative DWI can effectively predict the survival and recurrence risk of pancreatic ductal adenocarcinoma
Abstract
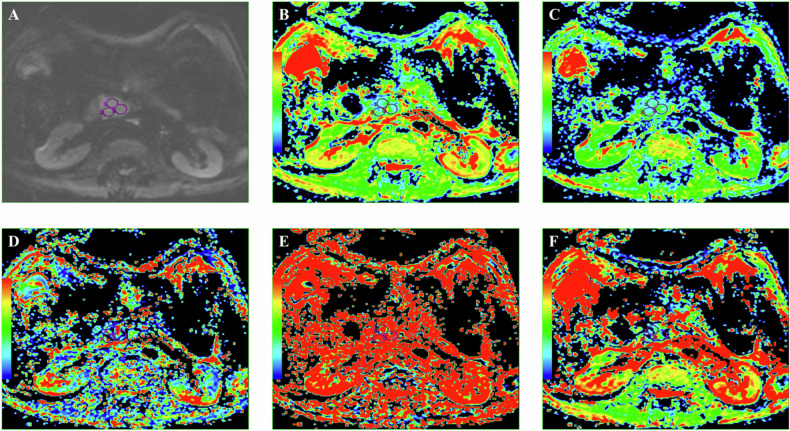
Purpose: To develop a machine learning (ML) model combining preoperative multiparametric diffusion-weighted imaging (DWI) and clinical features to better predict overall survival (OS) and recurrence-free survival (RFS) following radical surgery for pancreatic ductal adenocarcinoma (PDAC).
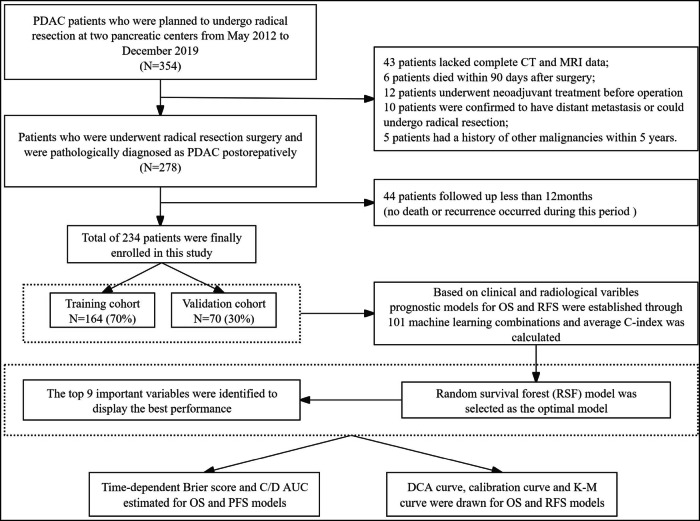
Materials and methods: A retrospective analysis was conducted on 234 PDAC patients who underwent radical resection at two centers. Among 101 ML models tested for predicting postoperative OS and RFS, the best-performing model was identified based on comprehensive evaluation metrics, including C-index, Brier scores, AUC curves, clinical decision curves, and calibration curves. This model's risk stratification capability was further validated using Kaplan-Meier survival analysis.
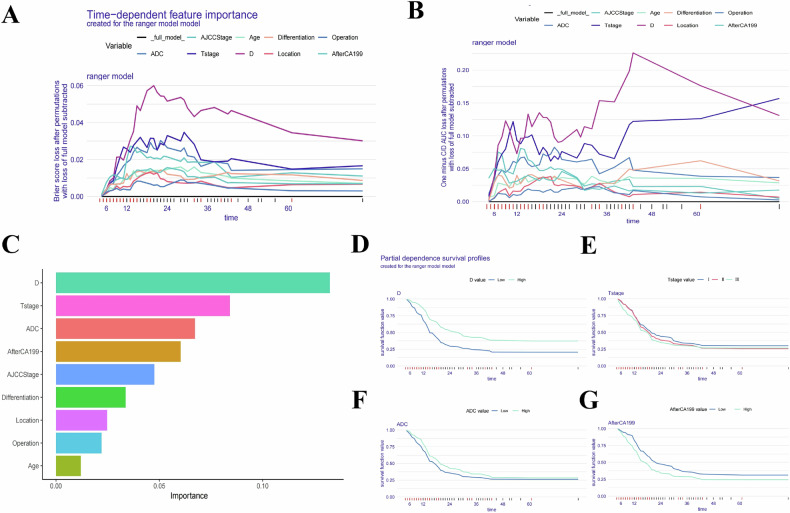
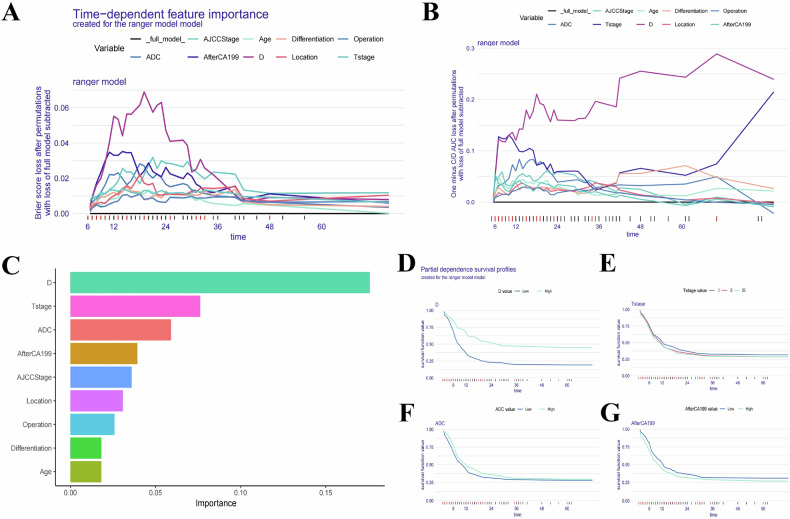
Results: The random survival forest model achieved the highest C-index (0.828/0.723 for OS and 0.781/0.747 for RFS in training/validation cohorts). Incorporating nine key factors-D value, T-stage, ADC-value, postoperative 7th day CA19-9 level, AJCC stage, tumor differentiation, type of operation, tumor location, and age-optimized the model's predictive accuracy. The model had integrated Brier score below 0.13 and C/D AUC values above 0.85 for both OS and RFS predictions. It also outperformed traditional models in predictive ability and clinical benefit, as shown by clinical decision curves. Calibration curves confirmed good predictive consistency. Using cut-off scores of 16.73/29.05 for OS/RFS, Kaplan-Meier analysis revealed significant prognostic differences between risk groups (p < 0.0001), highlighting the model's robust risk prediction and stratification capabilities.
Conclusion: The random survival forest model, combining DWI and clinical features, accurately predicts survival and recurrence risk after radical resection of PDAC and effectively stratifies risk to guide clinical treatment.
Critical relevance statement: The construction of 101 ML models based on multiparametric quantitative DWI combined with clinical variables has enhanced the prediction performance for survival and recurrence risks in patients undergoing radical resection for PDAC.
Key points: This study first develops DWI-based radiological-clinical ML models predicting PDAC prognosis. Among 101 models, RFS is the best and outperforms other traditional models. Multiparametric DWI is the key prognostic predictor, with model interpretations through SurvSHAP.
Keywords: Diffusion-weighted imaging; Machine learning; Pancreatic ductal adenocarcinoma; Prediction model; Prognosis.
© 2025. The Author(s).
Conflict of interest statement
Declarations. Ethics approval and consent to participate: Ethics committee approval was granted by the Peking University Third Hospital Ethics Review Board, and the requirement of written informed consent was waived. All procedures performed in studies involving human participants were in accordance with the ethical standards of the institutional and/or national research committee and with the 1964 Helsinki Declaration and its later amendments or comparable ethical standards. Consent for publication: Not applicable. Competing interests: The authors declare that they have no competing interests.
Figures


Similar articles
-
Preoperative prediction of disease-free survival in pancreatic ductal adenocarcinoma patients after R0 resection using contrast-enhanced CT and CA19-9.Eur Radiol. 2024 Jan;34(1):509-524. doi: 10.1007/s00330-023-09980-8. Epub 2023 Jul 28. Eur Radiol. 2024. PMID: 37507611
-
Preoperative data-based deep learning model for predicting postoperative survival in pancreatic cancer patients.Int J Surg. 2022 Sep;105:106851. doi: 10.1016/j.ijsu.2022.106851. Epub 2022 Aug 29. Int J Surg. 2022. PMID: 36049618
-
Multiparametric quantitative diffusion weighted magnetic resonance imaging can effectively predict the response to neoadjuvant therapy in borderline resectable pancreatic ductal adenocarcinoma.Eur J Radiol. 2025 Feb;183:111893. doi: 10.1016/j.ejrad.2024.111893. Epub 2024 Dec 24. Eur J Radiol. 2025. PMID: 39753006
-
Prognostic models for newly-diagnosed chronic lymphocytic leukaemia in adults: a systematic review and meta-analysis.Cochrane Database Syst Rev. 2020 Jul 31;7(7):CD012022. doi: 10.1002/14651858.CD012022.pub2. Cochrane Database Syst Rev. 2020. PMID: 32735048 Free PMC article.
-
Multiparametric Quantitative Imaging in Risk Prediction: Recommendations for Data Acquisition, Technical Performance Assessment, and Model Development and Validation.Acad Radiol. 2023 Feb;30(2):196-214. doi: 10.1016/j.acra.2022.09.018. Epub 2022 Oct 21. Acad Radiol. 2023. PMID: 36273996 Free PMC article. Review.
References
-
- Siegel RL, Giaquinto AN, Jemal A (2024) Cancer statistics, 2024. CA Cancer J Clin 74:12–49 - PubMed
-
- Groot VP, Rezaee N, Wu W et al (2018) Patterns, timing, and predictors of recurrence following pancreatectomy for pancreatic ductal adenocarcinoma. Ann Surg 267:936–945 - PubMed
-
- Ge JC, Tao M, Li L et al (2021) Nomogram and competing risk model to predict recurrence after curative surgical resection of PDAC. Pancreatology 7:S1424-3903 00149-6 - PubMed
Grants and funding
LinkOut - more resources
Full Text Sources
