

Intersensory attention deficits in schizophrenia relate to ongoing sensorimotor beta oscillations
- PMID: 39962042
- PMCID: PMC11832887
- DOI: 10.1038/s41537-025-00571-8
Intersensory attention deficits in schizophrenia relate to ongoing sensorimotor beta oscillations
Erratum in
-
Author Correction: Intersensory attention deficits in schizophrenia relate to ongoing sensorimotor beta oscillations.Schizophrenia (Heidelb). 2025 Feb 28;11(1):33. doi: 10.1038/s41537-025-00588-z. Schizophrenia (Heidelb). 2025. PMID: 40021670 Free PMC article. No abstract available.
Abstract
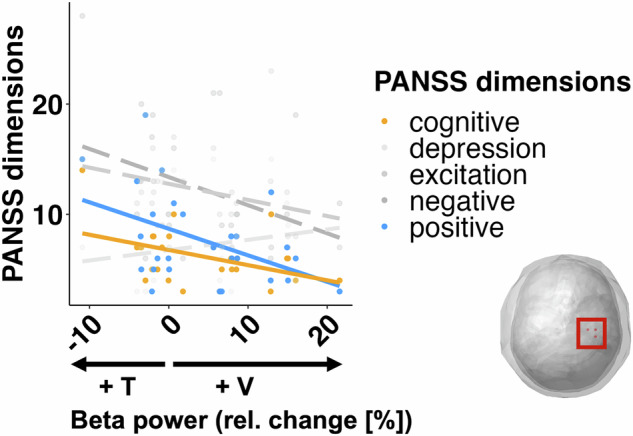
This study tested whether intersensory attention deficits in people with schizophrenia (SZ) relate to aberrant ongoing oscillations in sensory cortices. Electroencephalography (EEG) was recorded while individuals with schizophrenia (N = 27) and healthy controls (HC; N = 27) performed a visual-tactile target detection task. Ongoing alpha (8-12 Hz) and lower beta (13-20 Hz) band oscillations in visual and sensorimotor cortices were examined. Behavioral data suggested an intersensory attention deficit in patients. EEG data revealed stronger alpha-band oscillations for tactile vs. visual attention conditions in the visual cortex of both study groups. In the sensorimotor cortex contralateral to the tactile stimulation site, patients showed an additional intersensory attention effect in ongoing beta-band oscillations, which was negatively related to cognitive and positive symptoms of the PANSS. Our findings extend previous results from unisensory attention research and suggest that deficits in intersensory attention and alterations in sensorimotor beta oscillations are related to schizophrenia symptomatology.
© 2025. The Author(s).
Conflict of interest statement
Competing interests: The authors declare no competing interests.
Figures


Similar articles
-
Intersensory selective attention and temporal orienting operate in parallel and are instantiated in spatially distinct sensory and motor cortices.Hum Brain Mapp. 2015 Aug;36(8):3246-59. doi: 10.1002/hbm.22845. Epub 2015 May 28. Hum Brain Mapp. 2015. PMID: 26032901 Free PMC article.
-
Orienting attention to an upcoming tactile event involves a spatially and temporally specific modulation of sensorimotor alpha- and beta-band oscillations.J Neurosci. 2011 Feb 9;31(6):2016-24. doi: 10.1523/JNEUROSCI.5630-10.2011. J Neurosci. 2011. PMID: 21307240 Free PMC article.
-
Attentional selection of location and modality in vision and touch modulates low-frequency activity in associated sensory cortices.J Neurophysiol. 2012 May;107(9):2342-51. doi: 10.1152/jn.00973.2011. Epub 2012 Feb 8. J Neurophysiol. 2012. PMID: 22323628 Free PMC article.
-
Author Correction: Intersensory attention deficits in schizophrenia relate to ongoing sensorimotor beta oscillations.Schizophrenia (Heidelb). 2025 Feb 28;11(1):33. doi: 10.1038/s41537-025-00588-z. Schizophrenia (Heidelb). 2025. PMID: 40021670 Free PMC article. No abstract available.
-
Multisensory Processing Can Compensate for Top-Down Attention Deficits in Schizophrenia.Cereb Cortex. 2021 Oct 22;31(12):5536-5548. doi: 10.1093/cercor/bhab177. Cereb Cortex. 2021. PMID: 34274967
Cited by
-
Common Genomic and Proteomic Alterations Related to Disturbed Neural Oscillatory Activity in Schizophrenia.Int J Mol Sci. 2025 Aug 4;26(15):7514. doi: 10.3390/ijms26157514. Int J Mol Sci. 2025. PMID: 40806641 Free PMC article. Review.
References
-
- Spence, C. & Driver, J. On measuring selective attention to an expected sensory modality. Percept. Psychophys.59, 389–403 (1997). - PubMed
Grants and funding
LinkOut - more resources
Full Text Sources
