. 2025 Feb 17;16(1):105.
doi: 10.1038/s41419-025-07426-1.

Small molecule-mediated inhibition of the oxidoreductase ERO1A restrains aggressive breast cancer by impairing VEGF and PD-L1 in the tumor microenvironment

Affiliations

Small molecule-mediated inhibition of the oxidoreductase ERO1A restrains aggressive breast cancer by impairing VEGF and PD-L1 in the tumor microenvironment

Ersilia Varone et al. Cell Death Dis. .

Abstract

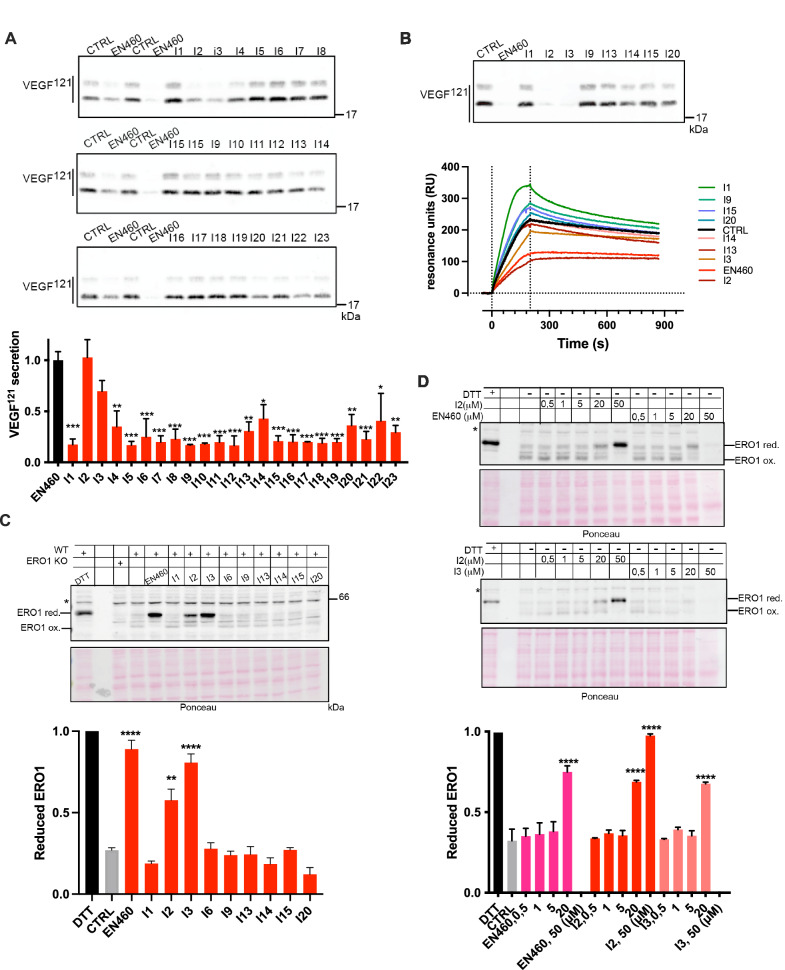
Cancer cells adapt to harsh environmental conditions by inducing the Unfolded Protein Response (UPR), of which ERO1A is a mediator. ERO1A aids protein folding by acting as a protein disulfide oxidase, and under cancer-related hypoxia conditions, it favors the folding of angiogenic VEGFA, leading tumor cells to thrive and spread. The upregulation of ERO1A in cancer cells, oppositely to the dispensability of ERO1A activity in healthy cells, renders ERO1A a perfect target for cancer therapy. Here, we report the upregulation of ERO1A in a cohort of aggressive triple-negative breast cancer (TNBC) patients in which ERO1A levels correlate with a higher risk of breast tumor recurrence and metastatic spread. For ERO1A target validation and therapy in TNBC, we designed new ERO1A inhibitors in a structure-activity campaign of the prototype EN460. Cell-based screenings showed that the presence of the Micheal acceptor in the compound is necessary to engage the cysteine 397 of ERO1A but not sufficient to set out the inhibitory effect on ERO1A. Indeed, the ERO1 inhibitor must adopt a non-coplanar rearrangement within the ERO1A binding site. I2 and I3, two new EN460 analogs with different phenyl-substituted moieties, efficiently inhibited ERO1A, blunting VEGFA secretion. Accordingly, in vitro assays to measure ERO1A engagement and inhibition confirmed that I2 and I3 bind ERO1A and restrain its activity with a IC50 in a low micromolar range. EN460, I2 and I3 triggered breast cancer cytotoxicity while specifically inhibiting ERO1A in a dose-dependent manner. I2 more efficiently impaired cancer-relevant features such as VEGFA secretion and related cell migration. I2 also acted on the tumor microenvironment and viability of xenografts and syngeneic TNBC. Thus, small molecule-mediated ERO1A pharmacological inhibition is feasible and promises to lead to effective therapy for the still incurable TNBC.


Conflict of interest statement

Competing interests: The authors declare no competing interests. Ethics approval and consent to participate: Human studies were approved by the local ethical committee of “Azienda Socio-Sanitaria Territoriale of Cremona” (RaLCTrVs1Ott_2000). All patients participated in this study provided written informed consents in accordance with the Declaration of Helsinki. Mouse studies are reported in compliance with the ARRIVE guidelines and conducted in conformity with the following laws, regulations and policies governing the care and use of laboratory animals: Italian Governing Law (D.lgs 26/2014, authorization 19/2008-A issued 6 March 2008 by Ministry of Health; authorization 896/2023-PR to E. Zito); Mario Negri Institutional Regulations and Policies providing internal authorization for people conducting animal experiments (Quality Management System Certificate—UNI EN ISO9001: 2008—registration number 6121); EU directives and guidelines (EEC Council Directive 2010/63/UE). Consent for publication: Not applicable.

Figures

Scheme 1
Scheme 1
Scheme of mouse treatment with ERO1 inhibitors.
Fig. 1
Fig. 1. ERO1A expression in aggressive human breast cancer.
A A tissue microarray TMA containing breast cancer samples, of which 48 were classified as Luminal A and 52 TNBC, was subjected to immunofluorescence with ERO1A (henceforth, ERO1); nuclei were stained with DAPI. B The same TMA was also subjected to immunofluorescence with Ki67. C Representative zoomed images of ERO1 and Ki67 staining in the indicated Luminal A and TNBC samples. D Dot plots representing the quantification of ERO1 and Ki67 staining (unpaired t-test). E Correlation plot between ERO1 and Ki67, the coefficient of correlation r and the p values were indicated on the graph.
Fig. 2
Fig. 2. Structure of EN460 derivatives.
Chemical structures of EN460. Each modified group in EN460 is boxed with a different color. The chemical substitutions of EN460 analogs (I1–14) are indicated and color- boxed. The phenyl of EN460 is depicted in red; analogs I1, I2, I3, I4 and I6 encompass the substitution of this group and are boxed in red. The phenyl-furan moiety of EN460 is depicted in blue, and the designated analogs with substitution of this group (I8-I15) are boxed in blue. The α, β unsaturated double bond is in green, and the analog with substitution of this group (I15) is also boxed in green. The side chain trifluoromethyl of pyrazolone is in purple and the analogs with substitution of this group (I14 and I10) are boxed in purple. Below, boxed in black, are commercially available analogs of EN460 putatively matching its activity profile while presenting a different chemical structure (I17–I23) and I16, a conjugate of N-acetylcysteine (NAC) and S-acetyl-β-mercaptoethylamine (SMEA).
Fig. 3
Fig. 3. Effects of ERO1A inhibition on VEGF secretion and ERO1 redox state in vivo.
A FLAG Immunoblot on conditioned media of HeLa cells transfected with FLAG-VEGF121 and treated with vehicle or inhibitors at 20 μM. Below is a bar graph representing the inhibition of VEGF secretion mediated by the different compounds when compared to the control; the ratio between the VEGF secreted from CTRL and the benchmark EN460 was arbitrarily set to 1 and calculated relatively to 1 for all the other compounds (N = 2, mean ± SD, One-Way ANOVA). B FLAG Immunoblot on conditioned media of HeLa cells transfected with FLAG-VEGF121 and treated with vehicle or inhibitors at 20 μM. Below, sensorgrams (time course of SPR signal in Resonance Units, RU) of FLAG-VEGF121 signal obtained by flowing the conditioned media over the immobilized FLAG M2 antibody (10 microgram/mL); these sensorgrams show the specific binding, already subtracted of the signal obtained on the reference surface with no antibody immobilized. C Non-reducing Immunoblot of endogenous ERO1A (henceforth, ERO1) in lysates of vehicle-treated HeLa cells or exposed to DTT, EN460 and the different inhibitors (I), as indicated. ERO1 red. stands for ERO1 reduced, ERO1 ox. for oxidized and * indicates a background band. ERO1 KO HeLa cells were loaded to indicate the background band. Ponceau stain indicated the protein loading control. The experiment was reproduced twice. Below is a bar graph representing reduced levels of ERO1A on total ERO1A (oxidized +reduced), which was arbitrarily set to 1 for the DTT-treated cells (mean ± SEM, One-Way ANOVA). D Non-reducing Immunoblot of endogenous ERO1A in lysates of vehicle-treated HeLa cells or exposed to DTT, and the indicated concentrations of EN460, I2 and I3. Representative experiment reproduced twice. Below is a bar graph representing reduced levels of ERO1A on total ERO1A (oxidized + reduced), which was arbitrarily set to 1 for the DTT-treated cells (mean ± SEM, One-Way ANOVA). Ponceau stain indicated the protein loading control.
Fig. 4
Fig. 4. Docking analysis of ERO1A inhibition.
A Predicted conformation of EN460 at the FAD binding pocket. EN460 (green carbon atoms) and the interacting amino acids (grey carbon atoms) are reported in a ball & stick representation. The crystallographic pose of FAD (thin magenta lines) is reported for comparison. The structure of ERO1 is reported in grey ribbons. The green mesh highlights the boundaries of the pocket. B Conformation of the substituted phenyl ring in the predicted bound conformation of EN460 C) in the energy minimum in water of EN460, D) in I1 and E) in I2.
Fig. 5
Fig. 5. Inhibitor-mediated engagement and activity of ERO1A.
A Schematic representation of the recombinant mouse ERO1A construct, indicating the ULP (a Sumo protease) cleavage site. B Coomassie-stained SDS-PAGE representing ERO1A cleaved from the upstream GST_SUMO, GST_SUMO, and BSA as a protein loading control. C Coomassie-stained nonreducing SDS-PAGE of ERO1A (1 μM) reacted with 20 μM of the 23 compounds. Representative experiments reproduced twice with different batches of ERO1A protein. On the right, bar graphs indicating the reduced ERO1A on total ERO1A (reduced ERO1A + oxidized ERO1A); the DTT-treated ERO1A was arbitrarily set to 1 (mean ± SEM, One-Way ANOVA). D Coomassie-stained non-reducing SDS-PAGE indicating ERO1A exposed to DTT or the concentrations indicated of EN460, I2, I3 and I15. Representative experiment reproduced twice. On the right, bar graphs indicating the reduced ERO1A on total ERO1A (mean ± SEM, One-Way ANOVA). E Coomassie-stained SDS-PAGE representing ERO1A, PDI1A1, and BSA as a protein loading control. F Concentration-dependent inhibition of the ERO1A-dependent AUR fluorescence in a kinetic assay employing ERO1A and PDIA1 (raw data in Fig Suppl. 2B). Curves were fitted using the equation: “log(inhibitor) vs. response - Variable slope” in Prism 10, to obtain the IC50 values with corresponding 95% interval of confidence, which were: 6.2 µM (5.1–7.5), 3.5 µM (2.9–4.3) and 8.1 µM (6.7–9.9) for EN640, I3 and I2, respectively.
Fig. 6
Fig. 6. ERO1A inhibition triggers cytotoxicity and restrains VEGF in an ERO1A-dependent manner in TNBC cells.
A MTS assay of MDAMB231 cells treated with different inhibitors (I). The value of the cells challenged with the vehicle alone was arbitrarily set to 100 and the value of the treated cells calculated as percentages (N = 5, mean ± SEM, Two-way ANOVA). B EN460 and I2 intracellular signal revealed by MALDI imaging in MDAMB231 cells from EN460 and I2-treated MDAMB231 cells, compared with the levels of the standard EN460 and I2. Left-over reports for the signal of the residual compound in the media, i.e., that was not taken up (N = 4). C Non-reducing Immunoblot of endogenous ERO1 in lysates of vehicle-treated MDAMB231 cells or exposed to DTT, EN460 and the different inhibitors (I). ERO1 red. stands for ERO1 reduced, ERO1 ox. for oxidized and * indicates a background band. Representative experiment reproduced twice. On the right, bar graph representing reduced levels of ERO1 on total ERO1 (oxidized + reduced), that was arbitrarily set to 1 for the DTT-treated cells (mean ± SEM, One-Way ANOVA). D MTS assay of MDAMB231 cells and ERO1A KO MDAMB231 cells treated with EN460 and I2 as indicated (N = 5, mean ± SEM, Two-way ANOVA). E Analysis of apoptotic cells. WT and ERO1 KO MDAMB231 were treated with EN460 or I2 for 6 (T1) and 14 hours (T2) (shown in the picture) and later analyzed for Annexin V and Propidium Iodide staining by flow cytometry. Based on the positivity to the stainings, cells were divided as live, necrotic, early and late apoptotic. Below, bar graph indicating the percentages of live, necrotic, early and late apoptotic and the significantly higher level of late apoptotic cells in EN460-treated cells (N = 3, t-test). F Dot plots representing the migrated MDAMB231 subjected to a Boyden Chamber motility assay (N = 3, mean ± SEM, One-way ANOVA). G Bar Graph representing VEGF secreted from MDAMB231cells by VEGF ELISA (N = 4, mean ± SEM, One-way ANOVA). H MTS assay of E0771 cells treated with EN460 and I2 (N = 5, mean ± SEM, Two-way ANOVA). I Dot plots representing migrated E0771 cells subjected to a Boyden chamber motility assay (N = 3, mean ± SEM, One-way ANOVA). L Bar graph representing VEGF secreted from E0771 cells by VEGF ELISA (N = 4, mean ± SEM, One-way ANOVA).
Fig. 7
Fig. 7. Anticancer effects of ERO1A inhibition in TNBC syngeneic and xenograft-bearing mice.
A EN460 and I2 signal revealed by MALDI imaging in representative primary MDAMB231 breast tumor sections from CTRL or EN460 and I2-treated MDAMB231 tumor-bearing SCID mice. On the right, signal intensity in Optical density (OD) (N = 4, mean ± SEM, One-way ANOVA). B Bioluminescence signals of primary breast tumors from SCID mice which were injected subcutaneously with MDAMB231 cells. Mice-bearing tumors were treated six times with EN460, I2, or vehicle, and the luminescence in AU was detected at t = 0 (T1) and t = 7 days (T2). Below are the bioluminescence signals of tumors. C The graph shows the percentage in tumor growth compared to day 0 when mice were randomized before the treatment (N = 10, mean ± SEM, Two-way ANOVA). D Graph representing VEGFA levels in primary breast tumors (One-way ANOVA). E Venn diagram showing the results of a differential transcriptomic analysis, comparing two sets of sample treatments: EN460 vs. CTRL-treated and I2 vs. CTRL-treated tumors (N = 5). Each circle contains the upregulated and downregulated pathways identified in the respective comparisons. The pathways are taken from the Hallmark gene sets collection (MSigDB). The analysis focused on significantly regulated pathways (False Discovery Rate, FDR < 0.05). The intersection of the two sets reveals a common downregulation of pathways related to cellular proliferation. F The graph shows tumor growth caliper measurements of each mouse. G The graph shows tumor growth caliper measurements of the mean of the treated mice (N = 8, mean ± SEM, Two-way ANOVA). H Mouse weights during treatment. I Graph representing VEGFA levels in primary breast tumors (One-way ANOVA). L The graph shows the percentage of orthotopic E0071 breast tumor growth compared to day 0 when mice were randomized before treatment (N = 8, mean ± SEM, Two-way ANOVA). M Orthotopic E0071 breast tumors. Representative cytofluorimeter plots of a PD-L1+ subset of monocytic myeloid-derived suppressor cells (M-MDSC) and dot plots of quantification of PD-L1 expression (MFI) in M-MDSC (N = 4, unpaired t-test).

References

    1. Cherubini A, Zito E. ER stress as a trigger of UPR and ER-phagy in cancer growth and spread. Front Oncol 2022;12:997235. - PMC - PubMed
    1. Chen X, Cubillos-Ruiz JR. Endoplasmic reticulum stress signals in the tumour and its microenvironment. Nat Rev Cancer 2021;21:71–88. - PMC - PubMed
    1. Rodvold JJ, Chiu KT, Hiramatsu N, Nussbacher JK, Galimberti V, Mahadevan NR, et al. Intercellular transmission of the unfolded protein response promotes survival and drug resistance in cancer cells. Sci Signal. 2017;10. - PMC - PubMed
    1. Wang Y, Alam GN, Ning Y, Visioli F, Dong Z, Nor JE, et al. The unfolded protein response induces the angiogenic switch in human tumor cells through the PERK/ATF4 pathway. Cancer Res 2012;72:5396–406. - PMC - PubMed
    1. Manuelli V, Pecorari C, Filomeni G, Zito E. Regulation of redox signaling in HIF-1-dependent tumor angiogenesis. FEBS J. 2021. - PubMed

MeSH terms

LinkOut - more resources