. 2025 Feb 17;16(1):1709.
doi: 10.1038/s41467-025-56854-2.

SGK1 drives hippocampal demyelination and diabetes-associated cognitive dysfunction in mice

Affiliations

SGK1 drives hippocampal demyelination and diabetes-associated cognitive dysfunction in mice

Ziying Jiang et al. Nat Commun. .

Abstract

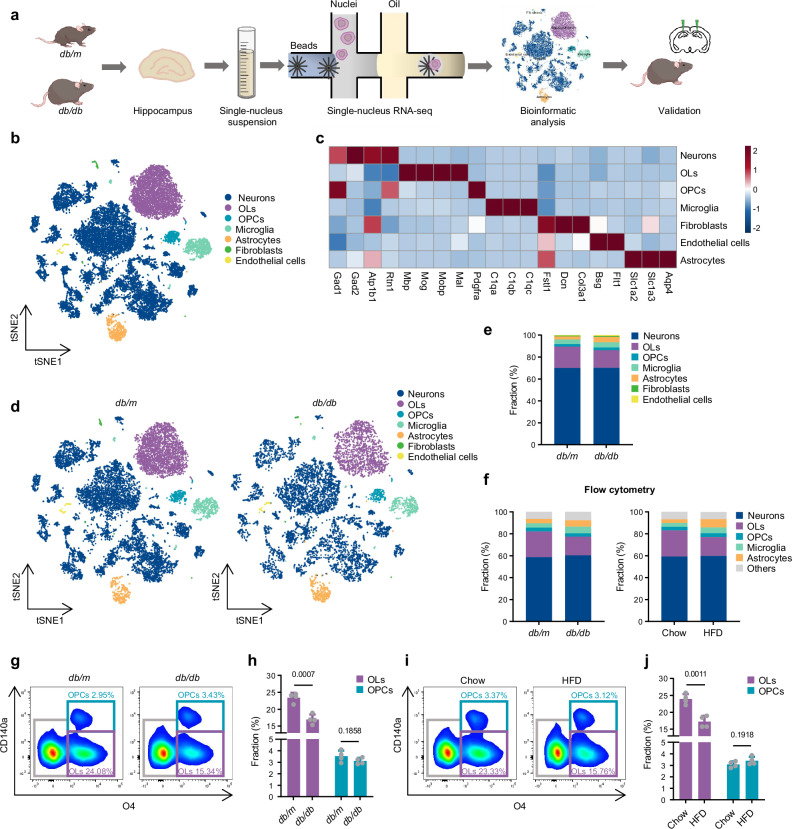
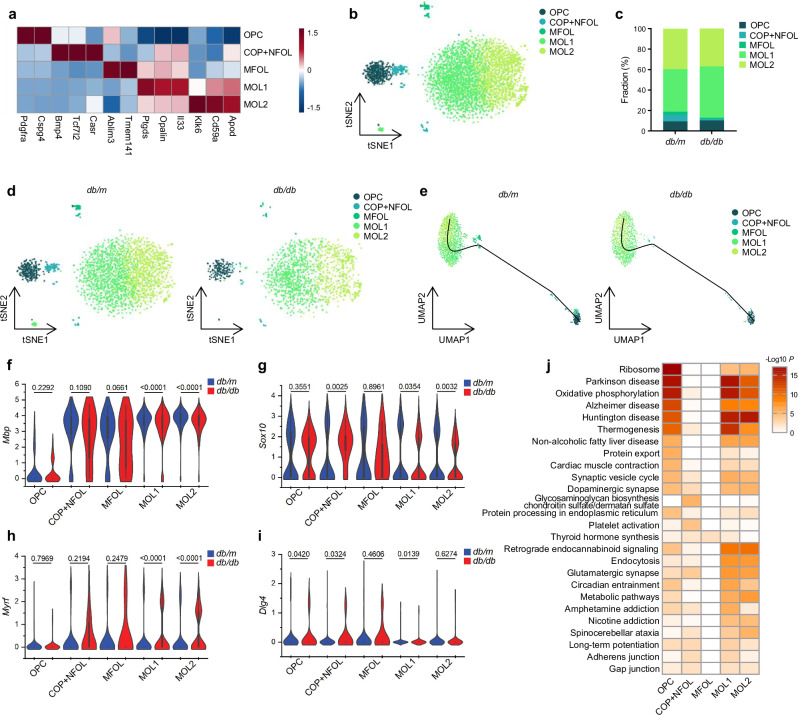
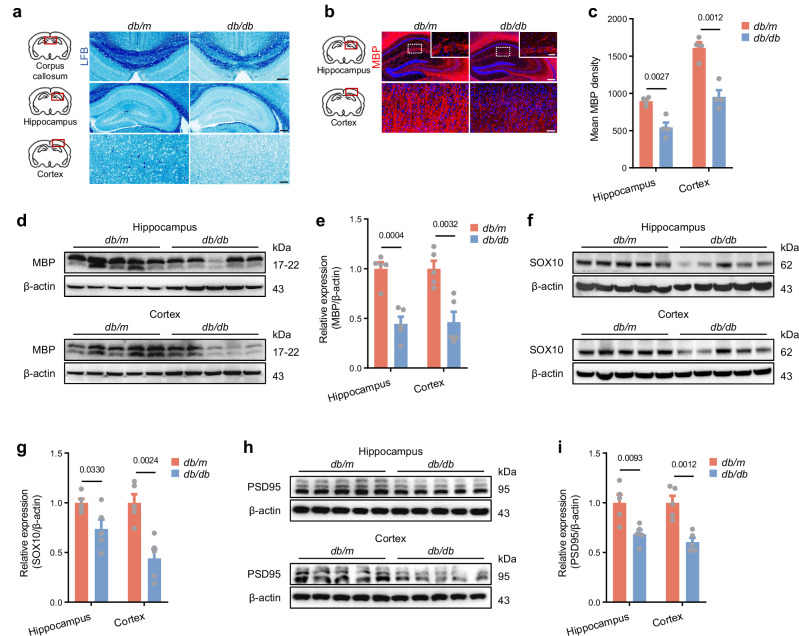
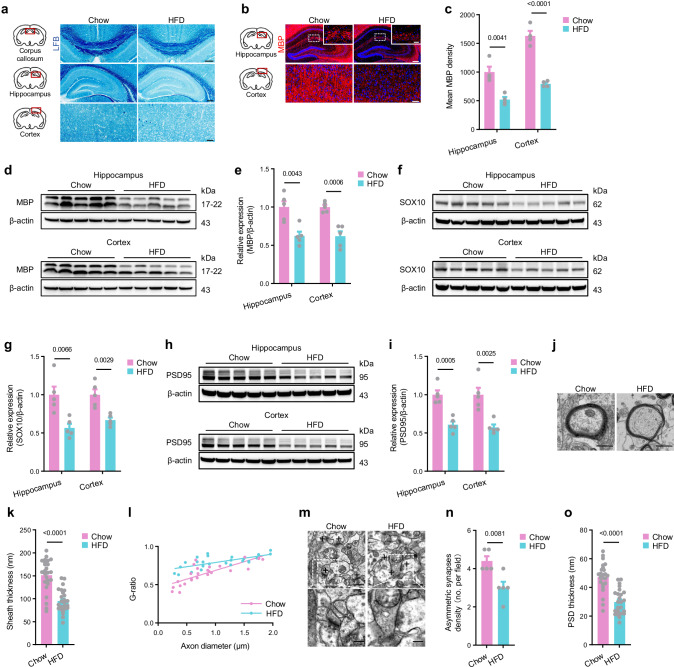
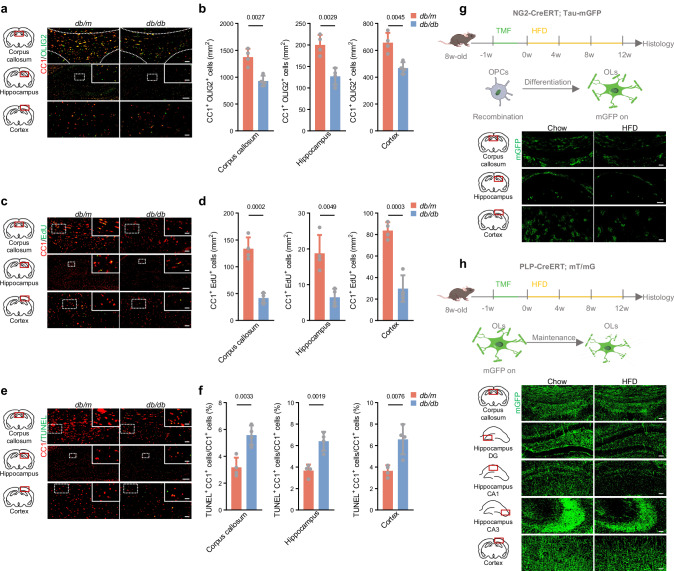
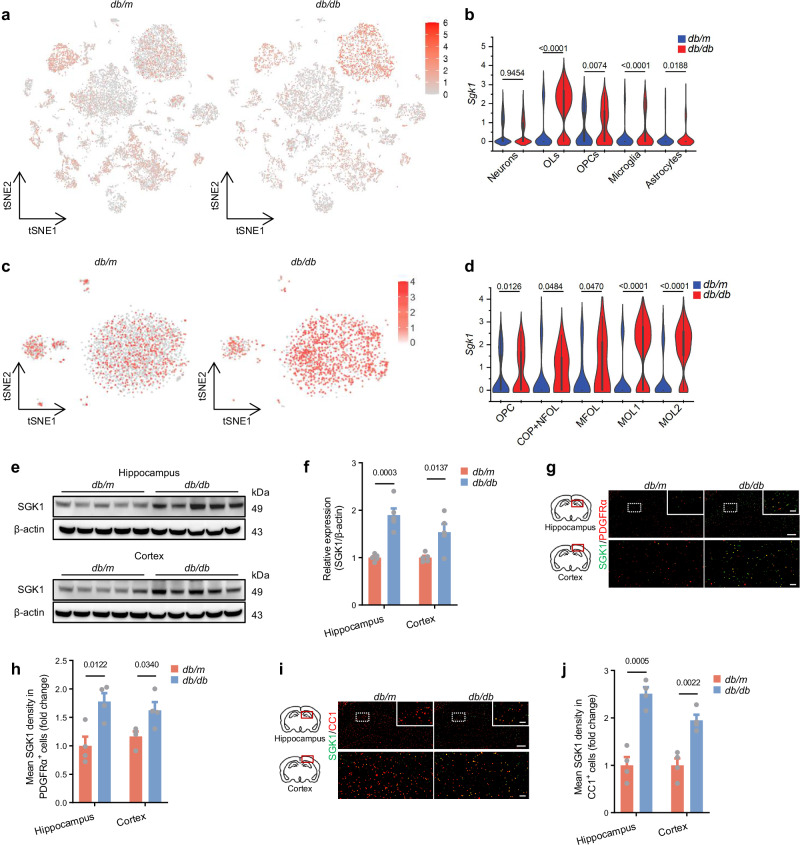
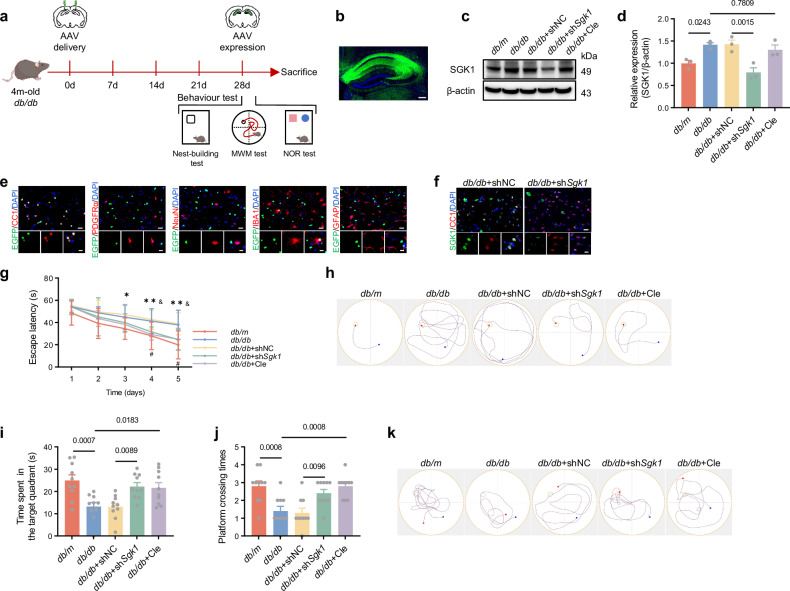
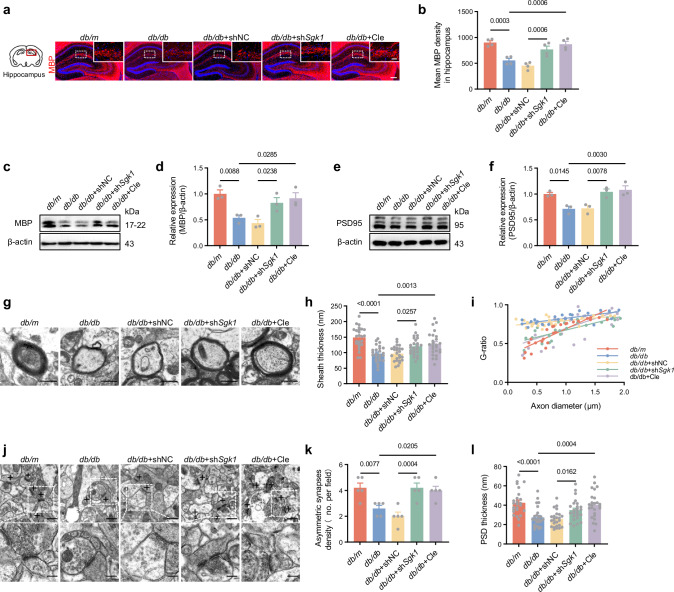
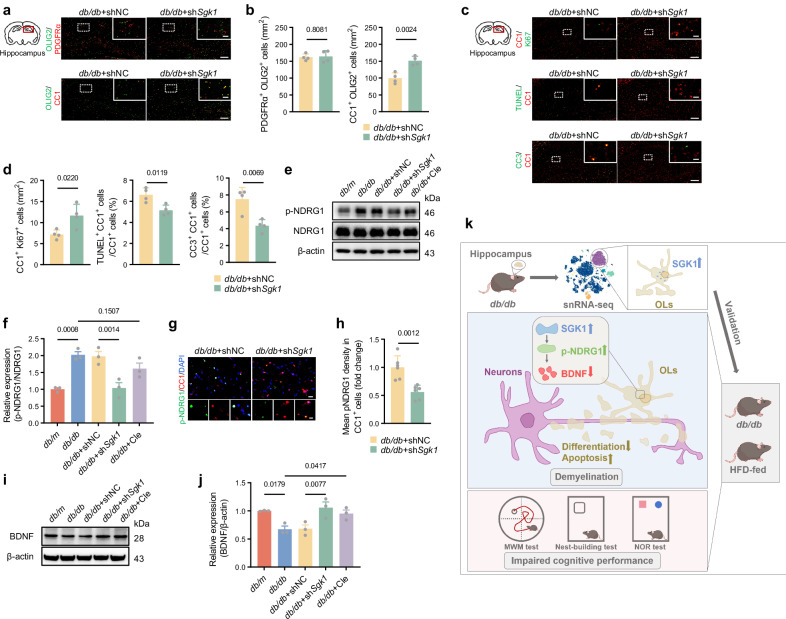
Diabetes-associated cognitive dysfunction (DACD) is increasingly recognized as a critical complication of diabetes. The complex pathology of DACD remains unknown. Here, we performed single-nucleus RNA sequencing (snRNA-seq) to demonstrate unique cellular and molecular patterns of the hippocampus from a mouse model of diabetes. More in-depth analysis of oligodendrocytes (OLs) distinguished five subclusters, indicating different functional states of OLs and transcriptional changes in each subcluster. Based on the results of snRNA-seq and experiments in vivo, we observed demyelination and disharmony of oligodendroglial lineage cell composition in male diabetic mice. Serum/glucocorticoid regulated kinase 1 (SGK1) expression was significantly increased in the hippocampus OLs of male diabetic mice, and SGK1 knockdown in hippocampus reversed demyelination and DACD via N-myc downstream-regulated gene 1 (NDRG1)-mediated pathway. The findings illustrated a transcriptional landscape of hippocampal OLs and substantiated impaired myelination in DACD. Our results provided direct evidence that inhibition of SGK1 or the promotion of myelination might be a potential therapeutic strategy for DACD.


Conflict of interest statement

Competing interests: The authors declare no competing interests.

Figures

Fig. 1
Fig. 1. snRNA-seq analysis revealed the cell composition of the hippocampus in db/db mice.
a Schematic depicting our study design. b t-SNE plot presenting the different cell types of the hippocampus. c Heat map showing well-established gene marker expression to identify cell clusters. d t-SNE plot and e bar chart presenting the relative abundances of different cell types from the db/m and db/db mice. f Bar chart presenting the relative abundances of different cell types from the diabetic and control mice by flow cytometry, n = 4 mice per group. g Representative FACS plots of OLs and OPCs in hippocampus from db/m and db/db mice. h Quantification of FACS analysis from (g), n = 4 mice per group. i Representative FACS plots of OLs and OPCs in hippocampus from HFD or Chow-fed mice. j Quantification of FACS analysis from (i), n = 4 mice per group. Data are presented as mean ± SEM, and analyzed by unpaired two-tailed Student’s t-tests. Source data are provided as a Source data file. HFD, high-fat diet; OLs, oligodendrocytes; OPCs, oligodendrocyte precursor cells.
Fig. 2
Fig. 2. Subcluster analysis indicated the difference in OLs of the hippocampus in db/db mice.
a Heat map showing well-established gene marker expression to identify oligodendrocyte subclusters. b t-SNE plot presenting the oligodendrocyte subclusters of the hippocampus. c Bar chart and (d) t-SNE plot presenting relative abundances of oligodendrocyte subclusters from the db/m and db/db mice. e Differentiation trajectories of these subclusters were analyzed using Slingshot. Violin plot showing the expression of myelin-related genes (f) Mbp, (g) Sox10, (h) Myrf and (i) Dlg4 in the oligodendrocyte subclusters. j Heat map showing presenting the representative KEGG enrichment pathways in oligodendrocyte subclusters. Data are analyzed by unpaired two-tailed Student’s t-tests for (fi) and hypergeometric test for (j). Source data are provided as a Source data file. COP, differentiation-committed oligodendrocyte precursors; KEGG, Kyoto Encyclopedia of Genes and Genomes; MFOL, myelin-forming oligodendrocytes; MOL, mature oligodendrocytes; NFOL, newly formed oligodendrocytes; OPC, oligodendrocyte precursor cell.
Fig. 3
Fig. 3. Myelination was reduced in the hippocampus of db/db mice.
a Representative images of LFB staining in db/m and db/db mice. Scale bar: 200μm (corpus callosum, hippocampus) and 50μm (cortex). b Representative immunofluorescence images of MBP expression in db/m and db/db mice. Scale bar: 200μm and 50μm (hippocampus), and 50μm (cortex). c Quantification of immunofluorescence images from (b), n = 4 mice per group. d Western blot analysis of the expression of MBP in db/m and db/db mice. e Quantification of protein bands from (d), n = 5 mice per group. f Western blot analysis of the expression of SOX10 in db/m and db/db mice. g Quantification of protein bands from (f), n = 5 mice per group. h Western blot analysis of the expression of PSD95 in db/m and db/db mice. i Quantification of protein bands from (h), n = 5 mice per group. Data are presented as mean ± SEM, and analyzed by unpaired two-tailed Student’s t-tests. Source data are provided as a Source data file. LFB, Luxol fast blue.
Fig. 4
Fig. 4. Myelination was reduced in the hippocampus of HFD-fed mice.
a Representative images of LFB staining in Chow or HFD-fed mice. Scale bar: 200μm (corpus callosum, hippocampus) and 50μm (cortex). b Representative immunofluorescence images of MBP expression in Chow or HFD-fed mice. Scale bar: 200μm and 50μm (hippocampus), and 50μm (cortex). c Quantification of immunofluorescence images from (b), (n = 4 mice per group). d Western blot analysis of the expression of MBP in Chow or HFD-fed mice. e Quantification of protein bands from (d), n = 5 mice per group. f Western blot analysis of the expression of SOX10 in Chow or HFD-fed mice. g Quantification of protein bands from (f), n = 5 mice per group. h Western blot analysis of the expression of PSD95 in Chow or HFD-fed mice. i Quantification of protein bands from (h), n = 5 mice per group. j Representative electron micrographs of myelinated axons of the hippocampus from different groups. Scale bar: 500 nm. k Bar chart showed sheath thickness from different groups. l Scatter plot showed g-ratio from different groups, n = 5 images from 5 mice per group. m Representative electron micrographs of synapses of the hippocampus from different groups. Scale bar: 500 nm and 200 nm. n Bar chart showed the numbers of asymmetric synapses from different groups, n = 5 mice per group. o Bar chart showed PSD thickness from different groups, n = 5 images from 5 mice per group. Data are presented as mean ± SEM, and analyzed by unpaired two-tailed Student’s t-tests. Source data are provided as a Source data file. HFD, high-fat diet; LFB, Luxol fast blue.
Fig. 5
Fig. 5. Differentiation and apoptosis of OLs were disturbed in the hippocampus of diabetic mice.
a Representative immunofluorescence images of CC1 and OLIG2-labeling OLs in db/m and db/db mice. Scale bar: 50μm (corpus callosum), 200μm and 50μm (hippocampus), 50μm (cortex). b Quantification of immunofluorescence images from (a), n = 4 mice per group. c Representative immunofluorescence images of CC1 and EdU-labeling new OLs in db/m and db/db mice. Scale bar: 50μm and 25μm (corpus callosum), 200μm and 25μm (hippocampus), 50μm and 25μm (cortex). d Quantification of immunofluorescence images from (c), n = 4 mice per group. e Representative immunofluorescence images of CC1 and TUNEL-labeling apoptotic OLs in db/m and db/db mice. Scale bar: 50μm and 25μm (corpus callosum), 200μm and 25μm (hippocampus), 50μm and 25μm (cortex). f Quantification of immunofluorescence images from (e), n = 4 mice per group. g Representative immunofluorescence images of mGFP-positive myelin in HFD-fed NG2-CreERT; Tau-mGFP mice. Scale bar: 50μm (corpus callosum), 200μm (hippocampus), 50μm (cortex). h Representative immunofluorescence images of mGFP-positive myelin in HFD-fed PLP-CreERT; mT/mG mice. Scale bar: 50μm (corpus callosum, hippocampus, cortex). Data are presented as mean ± SEM, and analyzed by unpaired two-tailed Student’s t-tests. Source data are provided as a Source data file. CA, cornu ammonis; DG, dentate gyrus; EdU, 5-ethynyl-2’deoxyuridine; HFD, high-fat diet; OLs, oligodendrocytes; OPCs, oligodendrocyte precursor cells; TMF, Tamoxifen.
Fig. 6
Fig. 6. SGK1 expression was upregulated in the hippocampus in db/db mice.
a t-SNE plot and (b) violin plot presenting the expression of Sgk1 in the different cell types from the db/m and db/db mice. c t-SNE plot and (d) violin plot presenting the expression of Sgk1 in the oligodendrocyte subclusters from the db/m and db/db mice. e Western blot analysis of the expression of SGK1 in control and diabetic mice. f Quantification of protein bands from (e), n = 5 mice per group. g Representative immunofluorescence images of SGK1 and PDGFRα expression in db/m and db/db mice. Scale bar: 200μm and 50μm (hippocampus), 50μm (cortex). h Quantification of immunofluorescence images from (g), n = 4 mice per group. i Representative immunofluorescence images of SGK1 and CC1 expression in db/m and db/db mice. Scale bar: 200μm and 50μm (hippocampus), 50μm (cortex). j Quantification of immunofluorescence images from (i), n = 4 mice per group. Data are presented as mean ± SEM, and analyzed by unpaired two-tailed Student’s t-tests. Source data are provided as a Source data file.
Fig. 7
Fig. 7. Specific SGK1 knockdown in OLs alleviated DACD in db/db mice.
a Schematic depicting the design of the AAV vector and the experimental timeline. b Fluorescence image of the section that expressed AAV in the hippocampus. Scale bar, 200μm. c Western blot analysis of the expression of SGK1 in different groups. d Quantification of protein bands from (c), n = 3 mice per group. e Representative immunofluorescence images of EGFP and cell markers (CC1, PDGFRα, NeuN, IBA1, GFAP) in db/db+shSgk1 groups. Scale bar: 20μm and 10μm. f Representative immunofluorescence images of SGK1 and CC1 in db/db+shNC and db/db+shSgk1 groups. Scale bar: 20μm and 10μm. MWM test parameters, (g) escape latency, (h) representative track plots in the learning phase, (i) time spent in the target quadrant, (j) times of mice passed through the platform location, (k) representative track plots in probe phase, n = 10 mice per group. Data are presented as mean ± SEM, and analyzed by one way ANOVA followed by the Bonferroni post hoc test. *p < 0.05, **p < 0.01, between db/m vs. db/db; #p < 0.05, between db/db+shNC vs. db/db+shSgk1; &p < 0.05, between db/db vs. db/db+Cle, in (g). Source data are provided as a Source data file. AAV, adeno-associated virus; Cle, clemastine; DACD, Diabetes-associated cognitive dysfunction; MWM test, Morris water-maze test; NOR test, novel object recognition test; OLs, oligodendrocytes.
Fig. 8
Fig. 8. Specific SGK1 knockdown in OLs reversed demyelination in db/db mice.
a Representative immunofluorescence images of MBP expression in different groups. Scale bar: 200μm and 50μm. b Quantification of immunofluorescence images from (a), n = 4 mice per group. c Western blot analysis of the expression of MBP in different groups. d Quantification of protein bands from (c), n = 3 mice per group. e Western blot analysis of the expression of PSD95 in different groups. f Quantification of protein bands from (e), n = 3 mice per group. g Representative electron micrographs of myelinated axons of the hippocampus from different groups. Scale bar: 500 nm. h Bar chart showed sheath thickness from different groups. i Scatter plot showed g-ratio from different groups. n = 5 images from 5 mice per group. j Representative electron micrographs of synapses of the hippocampus from different groups. Scale bar: 500 nm and 200 nm. k Bar chart showed the numbers of asymmetric synapses from different groups, n = 5 mice per group. l Bar chart showed PSD thickness from different groups, n = 5 images from 5 mice per group. Data are presented as mean ± SEM, and analyzed by one way ANOVA followed by the Bonferroni post hoc test. Source data are provided as a Source data file. Cle, clemastine; OLs, oligodendrocytes.
Fig. 9
Fig. 9. Specific SGK1 knockdown in OLs inhibited NDRG1 phosphorylation to promote myelination in db/db mice.
a Representative immunofluorescence images of PDGFRα/OLIG2-labeling OPCs and CC1/OLIG2-labeling OLs in db/db+shNC and db/db+shSgk1 groups. Scale bar: 200μm and 50μm. b Quantification of immunofluorescence images from (a), n = 4 mice per group. c Representative immunofluorescence images of CC1/Ki67-labeling new OLs, CC1/TUNEL-labeling apoptotic OLs, and CC1/CC3-labeling apoptotic OLs in db/db+shNC and db/db+shSgk1 groups. Scale bar: 200μm and 25μm. d Quantification of immunofluorescence images from (c), n = 4 mice per group. e Western blot analysis of the expression of p-NDRG1 and NDRG1 in different groups. f Quantification of protein bands from (e), n = 3 mice per group. g Representative immunofluorescence images of p-NDRG1 in CC1-labeling OLs in db/db+shNC and db/db+shSgk1 groups. Scale bar: 20μm and 10μm. h Quantification of protein bands from (g), n = 6 mice per group. i Western blot analysis of the expression of BDNF in different groups. j Quantification of protein bands from (i), n = 3 mice per group. k Schematic illustration elucidated the molecular mechanism underlying SGK1-related anti-demyelination efficacy in DACD. Data are presented as mean ± SEM, and analyzed by one way ANOVA followed by the Bonferroni post hoc test. Source data are provided as a Source data file. Cle, clemastine; DACD, diabetes-associated cognitive dysfunction; HFD, high-fat diet; MWM test, Morris water-maze test; NOR test, novel object recognition test; OLs, oligodendrocytes.

Similar articles

Cited by

References

    1. Khunti, K. et al. Diabetes and multiple long-term conditions: a review of our current global health challenge. Diab care46, 2092–2101 (2023). - PMC - PubMed
    1. Biessels, G. J. & Despa, F. Cognitive decline and dementia in diabetes mellitus: mechanisms and clinical implications. Nat. rev. Endocrinol.14, 591–604 (2018). - PMC - PubMed
    1. Li, Q. et al. Impaired lipophagy induced-microglial lipid droplets accumulation contributes to the buildup of TREM1 in diabetes-associated cognitive impairment. Autophagy19, 2639–2656 (2023). - PMC - PubMed
    1. Biessels, G. J. & Whitmer, R. A. Cognitive dysfunction in diabetes: how to implement emerging guidelines. Diabetologia63, 3–9 (2020). - PMC - PubMed
    1. Kullmann, S. et al. Brain insulin resistance at the crossroads of metabolic and cognitive disorders in humans. Physiol. Rev.96, 1169–1209 (2016). - PubMed

MeSH terms

Substances

LinkOut - more resources