

Prediction of alcohol intake patterns with olfactory and gustatory brain connectivity networks
- PMID: 39962224
- PMCID: PMC12089591
- DOI: 10.1038/s41386-025-02058-7
Prediction of alcohol intake patterns with olfactory and gustatory brain connectivity networks
Abstract
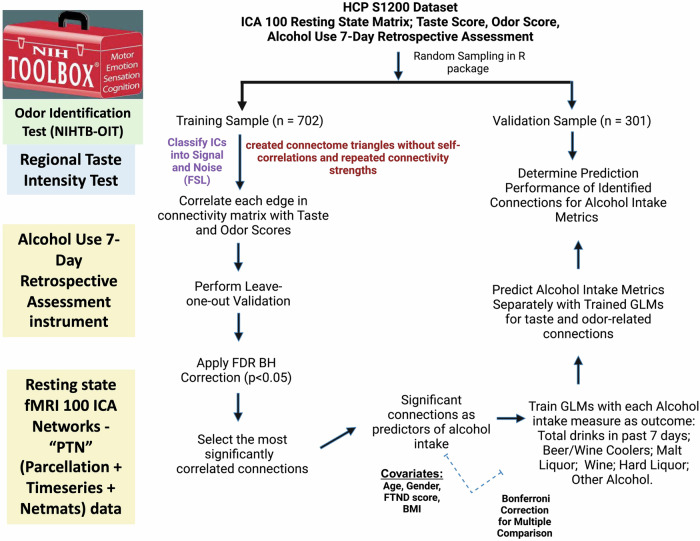
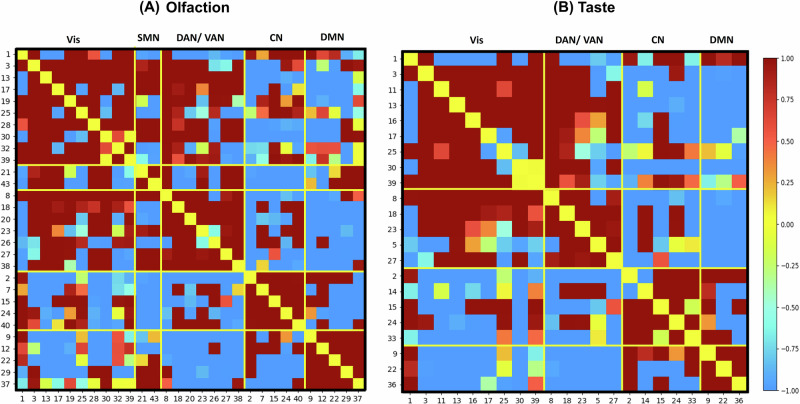
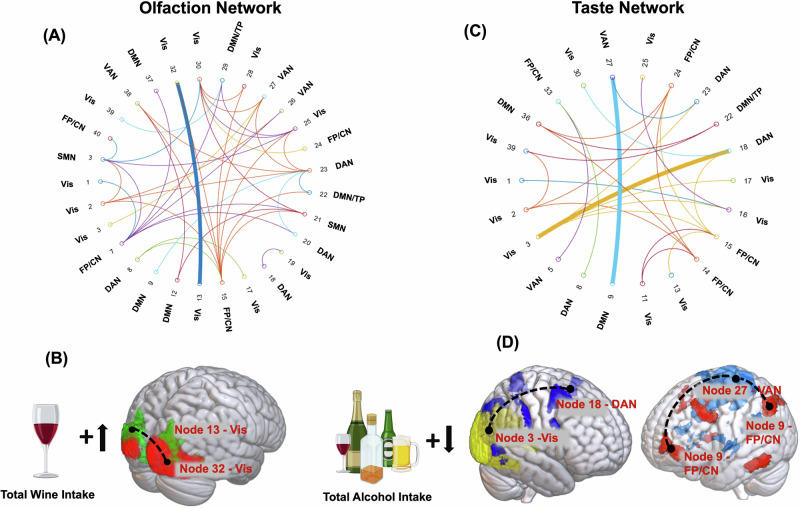
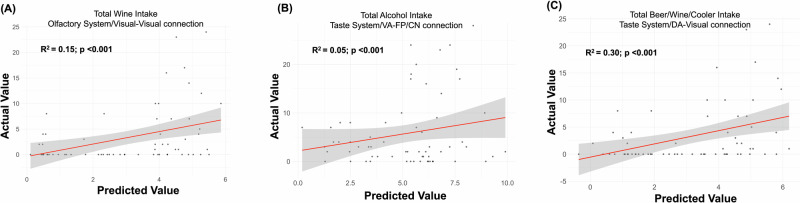
Craving in alcohol drinkers is often triggered by chemosensory cues, such as taste and smell, which are linked to brain network connectivity. This study aimed to investigate whether these brain connectivity patterns could predict alcohol intake in young adults. Resting-state fMRI data were obtained from the Human Connectome Project (HCP) Young Adult cohort, comprising 1003 participants. Functional connectomes generated from 100 independent components were analyzed, identifying significant connections correlated with taste and odor scores after applying a false discovery rate (FDR) correction using the Benjamini-Hochberg (BH) method. These significant connections were then utilized as predictors in general linear models for various alcohol intake metrics. The models were validated in an independent sample to assess their accuracy. The training sample (n = 702) and the validation sample (n = 117) showed no significant demographic differences. Out of 742 possible connections, 41 related to odor and 25 related to taste passed the significance threshold (P < 0.05) after FDR-BH correction. Notable predictors included visual-visual connectivity (node32-node13: β = 0.028, P = 0.02) for wine consumption and connectivity between the ventral attention network (VAN) and the frontal parietal/caudate nucleus (FP/CN) (node27-node9: β = -0.31, P = 0.04) for total alcohol intake in the past-week and maximum number of drinks per day in the past-year. The predictive models demonstrated strong accuracy, with root mean square error (RMSE) values of 5.15 for odor-related models and 5.14 for taste-related models. The F1 scores were 0.74 for the odor model and 0.71 for the taste model, indicating reliable performance. These findings suggest that specific patterns of brain connectivity associated with taste and olfactory perception may serve as predictors of alcohol consumption behaviors in young adults. Our study highlight the need for longitudinal research to evaluate the potential of taste- and smell-related brain connectivity patterns for early screening and targeted interventions, as well as their role in personalized treatment strategies for individuals at risk of AUD.
© 2025. This is a U.S. Government work and not under copyright protection in the US; foreign copyright protection may apply.
Conflict of interest statement
Competing interests: The authors declare no competing interests.
Figures
References
-
- CDC. Alcohol and Public Health: Alcohol-Related Disease Impact. [Table], Annual average for United States 2015–2019 alcohol-attributable deaths due to excessive alcohol use, all ages. 2023. https://www.cdc.gov/alcohol/facts-stats/index.html.
-
- Substance Abuse and Mental Health Services Administration, Center for Behavioral Health Statistics and Quality. National Survey on Drug Use and Health. Table 5.4B – Alcohol Use Disorder in Past Year among Persons Aged 12 or Older, by Age Group and Demographic Characteristics: Percentages, 2018 and 2019. Substance Abuse and Mental Health Services Administration. 2019. Accessed February 06, 2024. https://www.samhsa.gov/data/sites/default/files/reports/rpt39441/NSDUHDe....
-
- van Lier HG, Pieterse ME, Schraagen JMC, Postel MG, Vollenbroek-Hutten MMR, de Haan HA, et al. Identifying viable theoretical frameworks with essential parameters for real-time and real world alcohol craving research: a systematic review of craving models. Addiction Res Theory. 2018;26:35–51.
MeSH terms
Grants and funding
- 1K99AA031243/U.S. Department of Health & Human Services | NIH | National Institute on Alcohol Abuse and Alcoholism (NIAAA)
- Y1AA-3009/U.S. Department of Health & Human Services | NIH | National Institute on Alcohol Abuse and Alcoholism (NIAAA)
- Z01AA000135/U.S. Department of Health & Human Services | NIH | National Institute on Alcohol Abuse and Alcoholism (NIAAA)
LinkOut - more resources
Full Text Sources
Medical
Miscellaneous
