. 2025 Mar;26(6):1590-1619.
doi: 10.1038/s44319-025-00393-w. Epub 2025 Feb 17.

Tafazzin regulates neutrophil maturation and inflammatory response

Affiliations

Tafazzin regulates neutrophil maturation and inflammatory response

Przemysław Zakrzewski et al. EMBO Rep. 2025 Mar.

Abstract

Barth syndrome (BTHS) is a rare genetic disease caused by mutations in the TAFAZZIN gene. It is characterized by neutropenia, cardiomyopathy and skeletal myopathy. Neutropenia in BTHS is associated with life-threatening infections, yet there is little understanding of the molecular and physiological causes of this phenomenon. We combined bone marrow analysis, CRISPR/Cas9 genome editing in hematopoietic stem cells and functional characterization of circulating BTHS patient neutrophils to investigate the role of TAFAZZIN in neutrophils and their progenitors. We demonstrate a partial cell intrinsic differentiation defect, along with a dysregulated neutrophil inflammatory response in BTHS, including elevated degranulation and formation of neutrophil extracellular traps (NETs) in response to calcium flux. Developmental and functional alterations in BTHS neutrophils are underpinned by perturbations in the unfolded protein response (UPR) signaling pathway, suggesting potential therapeutic avenues for targeting BTHS neutropenia.

Keywords: Inflammation; Mitochondria; Neutropenia; Neutrophil; Tafazzin.


Conflict of interest statement

Disclosure and competing interests statement. The authors declare no competing interests.

Figures
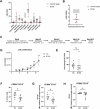
Figure 1
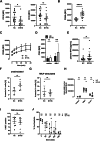
Figure 1. Impaired terminal differentiation and maturation of BTHS neutrophils ex vivo.
(A) Differential count of bone marrow aspirates from BTHS patients stained with Wright-Giemsa, n = 8 (BTHS). The normal range (grey) represents values for healthy children. Samples from the same patient, obtained at different ages, are marked in red. (B) Myeloid:erythroid ratio for samples analyzed in (A), n = 8 (BTHS). Samples from the same patient, obtained at different ages, are marked in red. (C) Simplified overview of culture protocol for deriving neutrophils from HSPC. (D) Growth curve of ex vivo HSPC-derived neutrophil, n = 9 (HC), 8 (BTHS). (E) Fold change of total cell count of HSPC-derived neutrophils from day 3 to day 17 of differentiation, n = 9 (HC), 8 (BTHS). (F) Percent of CD66b+CD15+ neutrophils in HSPC-derived cells at the end of differentiation, n = 8 (HC), 9 (BTHS); P = 0.0145. (G) CD11b surface expression of CD66b+CD15+ HSPC-derived neutrophils at the end of differentiation, relative to averaged CD11b expression of control cells on a same day, n = 8 (HC), 9 (BTHS); P = 0.0425. (H) CD16 surface expression of CD66b+CD15+ HSPC-derived neutrophils at the end of differentiation, relative to averaged CD16 expression of control cells on a same day, n = 8 (HC), 9 (BTHS). Data information: Data are presented as mean ± SD. ns—not significant, *P ≤ 0.05, assessed by unpaired t test. Source data are available online for this figure.
Figure 2
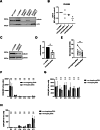
Figure 2. Tafazzin regulates neutrophil development.
(A) CD11b surface expression of control or tafazzin shRNA-treated CD66b+CD15+GFP+ HSPC-derived neutrophils at the end of differentiation, relative to non-targeting (n-t) shRNA control, n = 6 (biological repeats); P = 0.0337. (B) CD16 surface expression of control or tafazzin shRNA-treated CD66b+CD15+GFP+ HSPC-derived neutrophils at the end of differentiation, relative to n-t shRNA control, n = 5 (biological repeats). (C) Representative tafazzin western blot of CRISPR/Cas9-edited HSPC-derived neutrophils at the end of differentiation. (D) Growth curve of CRISPR/Cas9-edited HSPC-derived neutrophils, n = 4 (biological repeats). (E) CD11b surface expression of CD66b+CD15+ CRISPR/Cas9-edited HSPC-derived neutrophils at the end of differentiation, relative to non-targeting gRNA control, n = 10 (biological repeats); P = 0.0131. (F) CD16 surface expression of CD66b+CD15+ CRISPR/Cas9-edited HSPC-derived neutrophils at the end of differentiation, relative to non-targeting gRNA control, n = 10 (biological repeats); P = 0.026. Data information: Data are presented as mean ± SD. ns—not significant, *P ≤ 0.05, assessed by unpaired t test. Source data are available online for this figure.
Figure 3
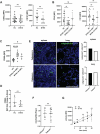
Figure 3. Characterization of peripheral blood neutrophils from BTHS patients.
(A) Surface expression of CD10 (left) and CD16 (right) in circulating neutrophils, n = 15 (HC, BTHS); P (CD10) = 0.0253. (B) Surface expression of CD66b in circulating neutrophils, n = 12 (HC), 15 (BTHS); P < 0.0001. (C) Time-course of CD66b surface expression in isolated neutrophils stimulated with Streptococcus pyogenes, MOI = 100, n = 9 (HC), 7 (BTHS). (D) Surface expression of CD63 in unstimulated (unstim) and fMLP-stimulated (300 nM) isolated neutrophils, n (unstim) = 29 (HC, BTHS), n (fMLP) = 31 (HC, BTHS); P = 0.0032. (E) MPO concentration in plasma, n = 20 (HC), 19 (BTHS); P = 0.0164. (F) Percentage of annexin V+ unstimulated neutrophils, n = 6 (HC, BTHS); P = 0.0344. (G) Percentage of annexin V+ neutrophils, after stimulation with 300 nM fMLP, n = 6 (HC, BTHS). (H) Area under the curve (AUC) quantification of ROS, detected by luminol, n (unstim, PMA) = 10 (HC), 12 (BTHS), n (ConA) = 8 (HC), 10 (BTHS). (I) NET release in response to 50 nM PMA, n = 7 (HC), 8 (BTHS). (J) Quantification of viable Streptococcus pyogenes bacteria relative to “serum only” control, after incubation with isolated neutrophils, n = 4 (HC, BTHS). Data information: Data are presented as mean ± SD. ns—not significant, *P ≤ 0.05, **P ≤ 0.01, ****P ≤ 0.0001, assessed by unpaired t test (A, B, EG, I, J) and two-way ANOVA (D, H). Source data are available online for this figure.
Figure 4
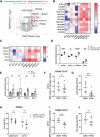
Figure 4. Mitochondrial perturbations in BTHS patient circulating neutrophils.
(A) Average MitoTracker median fluorescence of isolated BTHS patient circulating neutrophils normalized to HC (on the same day), n = 11 (HC, BTHS); P = 0.001. (B) Average percentage of neutrophils with low TMRE signal, n = 18 (HC), 17 (BTHS); P = 0.0349. (C) Average rates of ATP production, basal respiration, maximal respiration, and spare respiratory capacity, measured by Seahorse analyzer, n (ATP) = 6 (HC), 11 (BTHS), n (basal, maximal, spare respiration) = 4 (HC), 6 (BTHS). (D) Percentage of MitoSOX-positive neutrophils n = 13 (HC, BTHS). (E) Percentage of MitoSOX-positive neutrophils, after stimulation with 300 nM fMLP, n = 8 (HC), 9 (BTHS); P = 0.0084. Data information: Data are presented as mean ± SD. ns—not significant, *P ≤ 0.05, **P ≤ 0.01, ***P ≤ 0.001, assessed by unpaired t-test. Source data are available online for this figure.
Figure 5
Figure 5. Calcium homeostasis in BTHS neutrophils.
(A) Average median fluorescence of calcium dye X-Rhod-1, normalized to HC (on the same day), n = 11 (HC), 8 (BTHS); P = 0.0025. (B) Quantification of average median fluorescence of X-Rhod-1 in HSPC-derived BTHS neutrophils (D17), n = 3 (HC, BTHS); P = 0.0162. (C) NE concentration in medium released by CRISPR/Cas9-edited HSPC-derived neutrophils before and after stimulation with A23187 (2.5 μM) at 30 min post-stimulation, n = 3 (biological repeats); P = 0.0058. (D) MPO concentration in medium released by CRISPR/Cas9-edited HSPC-derived neutrophils before and after stimulation with A23187 (2.5 μM) at 30 min post-stimulation, n = 5 (biological repeats). (E) Quantification of NET release by CRISPR/Cas9-edited HSPC-derived neutrophils before or after stimulation with PMA (50 nM) at 4 h post-stimulation, n = 6 (biological repeats). (F) Calculation of NET release by CRISPR/Cas9-edited HSPC-derived neutrophils before or after stimulation with A23187 (10 μM) at 4 h post-stimulation, n = 6 (biological repeats); P = 0.0115. (G) Representative epifluorescence images showing anti-3D9 (green) and DAPI (blue) staining of CRSIPR/Cas9-edited HSPC-derived neutrophils at 4 h after stimulation with A23187 (10 μM) or not stimulated, scale bar = 20 μm. (H) Percentage of 3D9-positive cells after 4 h stimulation with A23187 (10 μM), n = 3 (biological repeats, at least 100 cells were counted in randomized fields of view); P = 0.0120. Data information: Data are presented as mean ± SD. ns—not significant, *P ≤ 0.05, **P ≤ 0.01, assessed by unpaired t test (A, B, H) and two-way ANOVA (CF). Source data are available online for this figure.
Figure 6
Figure 6. Elevated UPR signaling in BTHS neutrophils.
(A) Plot showing significantly upregulated (positive Z-score, red) and downregulated (negative Z-score, blue) IPA canonical pathways in circulating neutrophils from BTHS patients; n = 5 (HC), 5 (BTHS including n = 4 G-CSF-treated and n = 1 untreated, non-neutropenic patient). (B) Heat map depicting upregulated UPR-related proteins in circulating BTHS neutrophils, displayed as log2 fold change over averaged HC. (C) Heat map depicting upregulated mitochondrial UPR-related proteins in circulating BTHS neutrophils, displayed as log2 fold change over averaged HC. (B, C) BTHS5 - non-neutropenic BTHS patient. (D) Western blot of selected UPR-related proteins in HC or BTHS patient HSPC-derived neutrophils at the end of differentiation (D17), n = 3 (HC, BTHS); asterisks indicate nonspecific bands. (E) Western blot depicting the level of PERK expression and eIF2α phosphorylation during differentiation of HSPC-derived neutrophils and protein abundance quantification normalized to actin, n = 3 (PERK), 4 (p-eIF2α); asterisk indicate unspecific band. P (day 7) = 0.0306, P (day 10–17) < 0.0001. (F) Average percentage of HSPC-derived neutrophils (CD66b+CD15+) and mature neutrophils (CD66b+CD15+CD11b+) at D17, after treatment with PERK inhibitor (GSK2606414; 1 µM, added on day 3, 5, 7, 10, and 14 of culture) or vehicle control (DMSO), n = 9 (DMSO, PERKi); P = 0.0439. Data information: Data are presented as mean ± SD. ns—not significant, *P ≤ 0.05, **P ≤ 0.01, ***P ≤ 0.001, ****P ≤ 0.0001, assessed by Welch’s t test after log2 transformation (AC), unpaired t test (E) and two-way ANOVA (F). Source data are available online for this figure.
Figure EV1
Figure EV1. Additional analyses of BTHS neutrophils cultured ex vivo.
(A) Representative image of BTHS patient bone marrow aspirate stained with Wright-Giemsa. (B) Quantification of average percentage of apoptotic (Annexin V + PI-) HSPC-derived neutrophils at the end of differentiation, n = 2 (HC), 3 (BTHS). (C) Representative cytospins of HSPC-derived neutrophils (day 17). (D) Simplified differential count of cytospins of HSPC-derived neutrophils (day 17), n = 7 (HC), n = 7 (BTHS). (E) Gating strategy for HSPC-derived neutrophils (day 17). (F) Average number of CD66b+CD15+ neutrophils in HSPC-derived cells at the of differentiation (day 17) per 1000 of HSPC cells at the start (day 0), n = 8 (HC), 9 (BTHS). (G). Average percentage of CD66b+CD15+CD11+ cells in live population of HSPC-derived neutrophils at day 17, n = 8 (HC), 9 (BTHS); P = 0.0013. (H) Average percentage of CD66b+CD15+CD16+ cells in live population of HSPC-derived neutrophils at day 17, n = 8 (HC), 9 (BTHS); P = 0.0029. Data information: Data are presented as mean ± SD. ns—not significant, **P ≤ 0.01, assessed by unpaired t test (B, FH) and two-way ANOVA (D). Scale bar: 40 μm (A), 20 μM (B).
Figure EV2
Figure EV2. Further characterization of tafazzin-deficient cells.
(A) Representative western blot depicting level of tafazzin expression in PLB-985 cells transduced with lentivirus encoding non-targeting (n-t) or anti-TAFAZZIN shRNAs, n = 2 (experimental repeats). (B) Graph showing CD11b surface expression of PLB-985 cells transduced with lentivirus encoding non-targeting (n-t) or anti-TAFAZZIN shRNAs, n = 2 (experimental repeats). (C) Representative western blot depicting level of tafazzin expression level of GFP+ HSPC-derived neutrophils transduced with lentivirus encoding non-targeting (n-t) or anti-TAFAZZIN shRNAs, n = 3. (D) Graph depicting level of tafazzin expression level of GFP+ HSPC-derived neutrophils transduced with lentivirus encoding non-targeting (n-t) or anti-TAFAZZIN shRNAs, n = 3 (biological repeats); P = 0.0146. (E) Fold change of total cell count of CRISPR/Cas9-edited HSPC-derived neutrophils from day 3 to day 17 of differentiation matching TAFAZZIN knockout cells to their relative controls, n = 10 (biological repeats); P = 0.0154. (F) CD34 surface expression of HSPC-derived neutrophils (live population) during their differentiation in vitro, n = 3 (biological repeats). (G) CD33 surface expression of HSPC-derived neutrophils (live population) during their differentiation in vitro, n = 3 (biological repeats). (H) CD34 surface expression of HSPC-derived neutrophils (live population) during their differentiation in vitro, n = 3 (biological repeats). Data information: Data are presented as mean ± SD. ns—not significant, *P ≤ 0.05, assessed by unpaired t test (D, E) and two-way ANOVA (FH).
Figure EV3
Figure EV3. Additional analyses of peripheral blood neutrophils.
(A) Surface expression of CD62L (left) and CD101 (right) in circulating neutrophils, n = 15 (HC, BTHS). (B) Surface expression of CD10 (left) and CD16 (right) in circulating neutrophils stratified according to G-CSF therapy; n = 15 (HC), 11 (BTHS + G-CSF), 4 (BTHS − G-CSF). (C) Surface expression of CD66b in neutrophils stratified according to G-CSF treatment, n = 12 (HC), 10 (BTHS + G-CSF), 5 (BTHS − G-CSF); p (HC vs. BTHS + G-CSF) = < 0.0001, p (HC vs. BTHS-G-CSF) = 0.0187. (D) Fold change of CD66b surface expression in isolated neutrophils stimulated with Streptococcus pyogenes for 40 min, MOI = 100, n = 9 (HC), 7 (BTHS). (E) Representative epifluorescence images showing anti-calgranulin (green) and DAPI (blue) staining of mouse lung and spleen (left) and quantification of average number of calgranulin-positive cells per mm2 of section (right), n = 2 (mouse per genotype; the cells were counted from one transverse section through the middle part of the tissue); scale bar = 100 μm. (F) Absolute neutrophil counts in mouse whole blood, n = 7 (WT), 8 (KO). (G) Phagocytosis time-course, measured by pHrodo fluorescence in isolated neutrophils, n = 3 (HC, BTHS). Data information: Data are presented as mean ± SD. ns—not significant, *P ≤ 0.05, ****P ≤ 0.0001, assessed by unpaired t test (A, DG) and one-way ANOVA (B, C).
Figure EV4
Figure EV4. Additional mitochondrial analyses in BTHS neutrophils.
(A) Average rates of ATP production, basal respiration, maximal respiration, and spare respiratory capacity, measured by Seahorse metabolic flux analyzer and stratified according to G-CSF therapy; n = 4 (HC), 3 (BTHS + G-CSF), 3 (BTHS − G-CSF). (B) Gating strategy for MitoSOX+ circulating neutrophils. (C) Quantification of average MitoSOX median fluorescence of circulating neutrophils, n = 13 (HC, BTHS). (D) Quantification of average MitoSOX median fluorescence of circulating neutrophils stimulated with 300 nM fMLP, n = 8 (HC), 9 (BTHS). (E) Percentage of MitoSOX-positive HSPC-derived neutrophils at the end of differentiation (D17), n = 3 (HC, BTHS). (F) Percentage of MitoSOX-positive HSPC-derived neutrophils (D17), after stimulation with 300 nM fMLP, n = 3 (HC, BTHS). Data information: Data are presented as mean ± SD. ns—not significant, *P ≤ 0.05, assessed by one-way ANOVA (A) and unpaired t test (CF).
Figure EV5
Figure EV5. Elevated UPR signaling in BTHS neutrophils.
(A) Volcano plot comparing BTHS and HC circulating neutrophil protein abundances, displayed as −log10 P-value and log2 fold change, n = 5 (HC), 5 (BTHS including n = 4 G-CSF-treated and n = 1 untreated, non-neutropenic patient). (B) Heat map depicting upregulated oxidative phosphorylation proteins identified with IPA, displayed as log2 fold change over averaged HC. (C) Heat map depicting upregulated fatty acid oxidation proteins identified with IPA, displayed as log2 fold change over averaged HC. (B, C) BTHS5 - non-neutropenic BTHS patient. (D) Log2 normalized abundance of mtUPR-related proteins identified by proteomics in circulating neutrophils, n = 5 (HC), 5 (BTHS including n = 4 G-CSF-treated and n = 1 untreated, non-neutropenic patient); p (HSP60) = 0.0002, p (HSP10) = 0.0192, P (mt-HSP60) = < 0.0001, P (LONP1) = 0.0064. (E) Quantification of UPR-related protein expression in HSPC-derived neutrophils at D17 of differentiation, n = 3 (HC, BTHS); P (HPS60) = 0.0106. (F). Surface expression of CD11b in PERK-inhibited (GSK2606414; 1 µM) or vehicle control (DMSO-treated) HSPC-derived neutrophils at D17 of differentiation, relative to averaged control (on a same day), n = 9 (DMSO, PERKi). (G) Fold change in total cell count during HSPC differentiation, from day 3 to day 17, after treatment with PERK inhibitor (GSK2606414; 1 μM) or vehicle control (DMSO), n = 9 (DMSO, PERKi); P = 0.0064. (H) Average percentage of HSPC-derived neutrophils (CD66b+CD15+) and mature neutrophils (CD66b+CD15+CD11b+) at D17, after treatment with PERK activator (CCT020312; 1 µM, added on day 3, 7, 10, and 14 of culture) or vehicle control (DMSO), n = 6 (DMSO, PERKa). (I) Surface expression of CD11b in PERK-activated (CCT020312; 1 µM) or vehicle control (DMSO-treated) HSPC-derived neutrophils at D17 of differentiation, relative to averaged control (on a same day), n = 6 (DMSO, PERKa); P = 0.0054. (J) Fold change in total cell count during HSPC differentiation, from day 3 to day 17, after treatment with PERK activator (CCT020312; 1 µM) or vehicle control (DMSO), n = 7 (DMSO, PERKa). Data information: Data are presented as mean ± SD. ns—not significant, *P ≤ 0.05, **P ≤ 0.01, ***P ≤ 0.001, ****P ≤ 0.0001, assessed by Welch’s t test after log2 transformation (B, C), unpaired t test (DG, I, J) and two-way ANOVA (H).

References

    1. Amulic B, Cazalet C, Hayes GL, Metzler KD, Zychlinsky A (2012) Neutrophil function: from mechanisms to disease. Annu Rev Immunol 30:459–489 - PubMed
    1. Amulic B, Knackstedt SL, Abu Abed U, Deigendesch N, Harbort CJ, Caffrey BE, Brinkmann V, Heppner FL, Hinds PW, Zychlinsky A (2017) Cell-cycle proteins control production of neutrophil extracellular traps. Dev Cell 43:449–462.e445 - PubMed
    1. Apel F, Andreeva L, Knackstedt LS, Streeck R, Frese CK, Goosmann C, Hopfner KP, Zychlinsky A (2021) The cytosolic DNA sensor cGAS recognizes neutrophil extracellular traps. Sci Signal 14:eaax7942 - PubMed
    1. Barth PG, Scholte HR, Berden JA, Van der Klei-Van Moorsel JM, Luyt-Houwen IE, Van ‘t Veer-Korthof ET, Van der Harten JJ, Sobotka-Plojhar MA (1983) An X-linked mitochondrial disease affecting cardiac muscle, skeletal muscle and neutrophil leucocytes. J Neurol Sci 62:327–355 - PubMed
    1. Beres SB, Musser JM (2007) Contribution of exogenous genetic elements to the group A Streptococcus metagenome. PLoS ONE 2:e800 - PMC - PubMed

MeSH terms

Substances

LinkOut - more resources