. 2025 Apr;44(7):2002-2024.
doi: 10.1038/s44318-025-00384-6. Epub 2025 Feb 17.

Local weakening of cell-extracellular matrix adhesion triggers basal epithelial tissue folding

Affiliations

Local weakening of cell-extracellular matrix adhesion triggers basal epithelial tissue folding

Andrea Valencia-Expósito et al. EMBO J. 2025 Apr.

Abstract

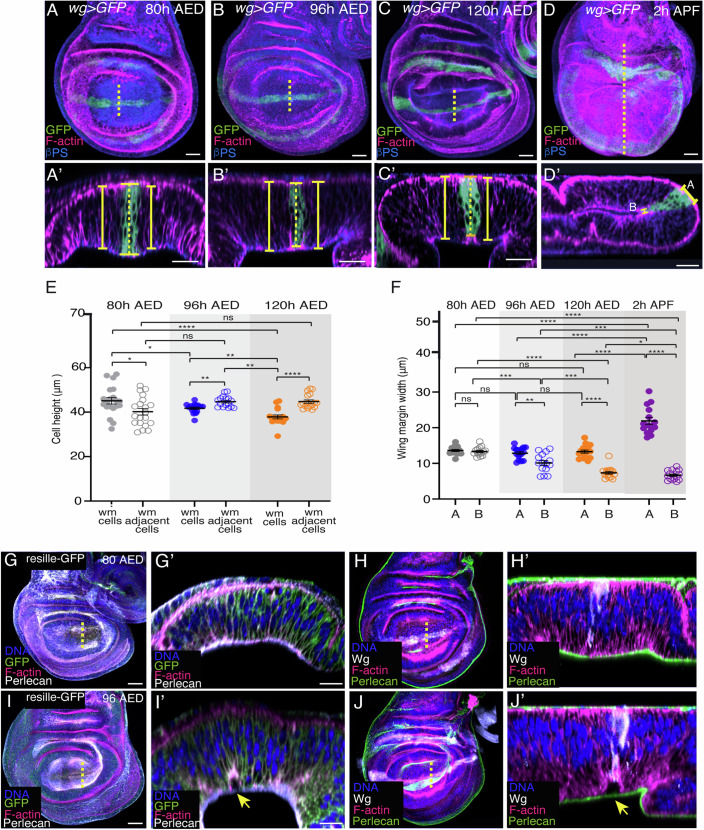
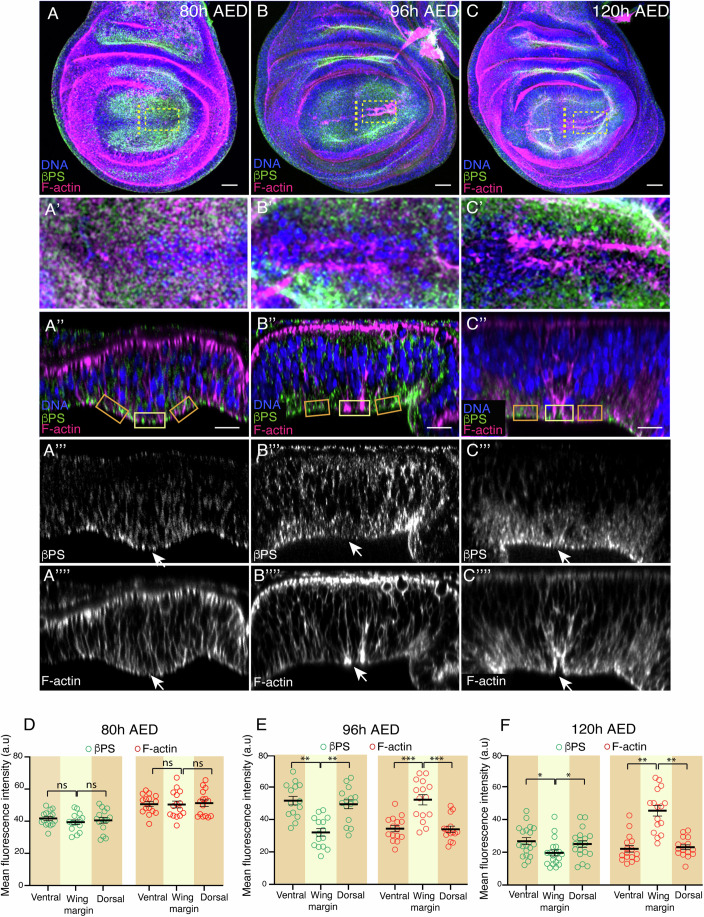
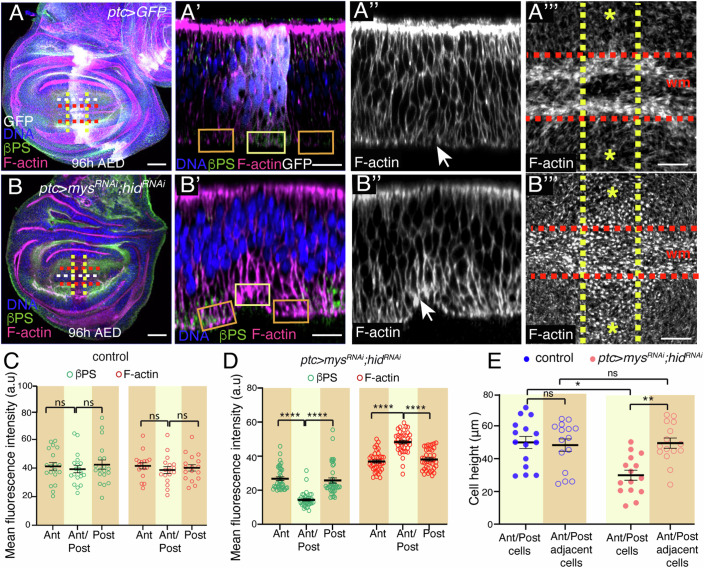
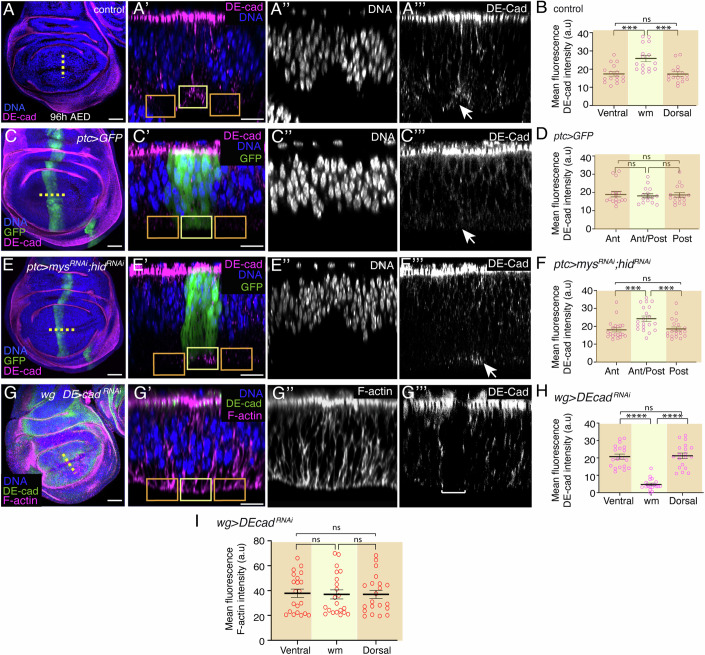
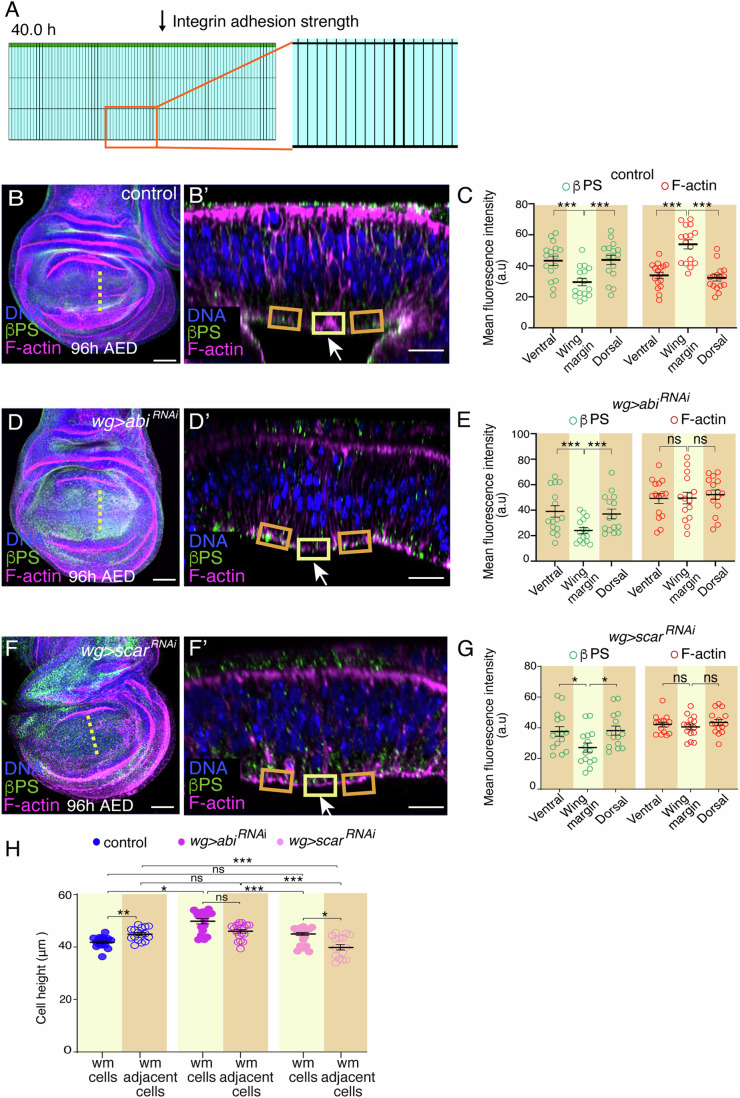
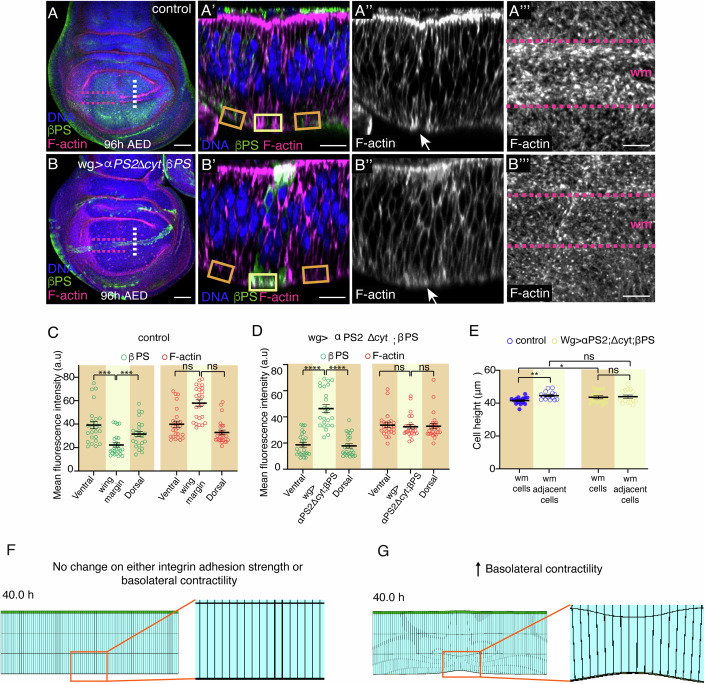
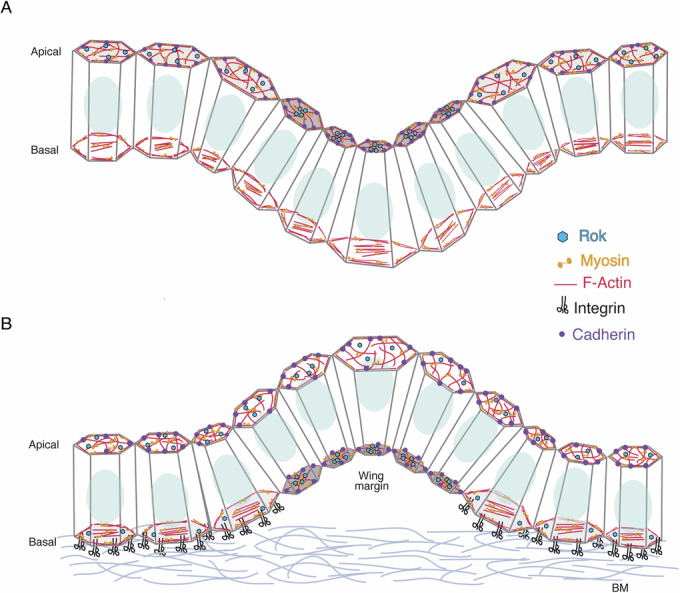
During development, epithelial sheets sculpt organs by folding, either apically or basally, into complex 3D structures. Given the presence of actomyosin networks and cell adhesion sites on both sides of cells, a common machinery mediating apical and basal epithelial tissue folding has been proposed. However, unlike for apical folding, little is known about the mechanisms that regulate epithelial folding towards the basal side. Here, using the Drosophila wing imaginal disc and combining genetic perturbations and computational modeling, we demonstrate opposing roles for cell-cell and cell-extracellular matrix (ECM) adhesion systems during epithelial folding. While cadherin-mediated adhesion, linked to actomyosin network, regulates apical folding, a localized reduction on integrin-dependent adhesion, followed by changes in cell shape and reorganization of the basal actomyosin cytoskeleton and E-Cadherin (E-Cad) levels, is necessary and sufficient to trigger basal folding. These results suggest that modulation of the cell mechanical landscape through the crosstalk between integrins and cadherins is essential for correct epithelial folding.

Keywords: Actomyosin; Cadherins; Constricting Forces; Integrins.


Conflict of interest statement

Disclosure and competing interests statement. The authors declare no competing interests.

Figures

Figure 1
Figure 1. Wing margin cells shorten and detach from the BM during development.
(AD’) Confocal views of wing imaginal discs throughout third-instar larvae (AC’) and at 2 h APF (D, D’), stained with anti-GFP (green), anti-βPS (blue) and the F-actin marker Rhodamine Phalloidin (magenta). (A’–D’) Confocal YZ cross-sections along the yellow dotted lines shown in (AD). Brackets indicate cell height in the wing margin (dotted line) and in ventral and dorsal domains (straight line). (E) Quantification of cell height of wing margin and adjacent cells, at different larval developmental stages. Multiple Mann–Whitney U test from left to right: *p = 0.0375, *p = 0.0432, ****p = 1.0e−4, **p = 0.003, **p = 0.0014, **p = 0.0032, ****p = 1.8e−5, ns not significant. Error bars represent the mean ± SEM. (F) Quantification of apicolateral (AL) and basolateral (BL) wing margin width at different developmental stages. Multiple Mann–Whitney U test from left to right: ***p = 0.00053, ****p = 6.2e−12, **p = 0.00309, ****p = 3.5e−13, ****p = 5.1e−13, ***p = 0.00235, ****p = 1.5e−7, ****p = 1.9e−10, ****p = 2.7e−7, ***p = 0.003, *p = 0.02414, ****p = 1.0e−10, ns not significant. Error bars represent the mean ± SEM. (GJ) Confocal views of wing discs expressing the membrane marker resille-GFP at 80 h AED (G, H) and 96 h AED (I, J) stained with anti-GFP (green in G, G’, I, I’), the F-actin marker Rhodamine Phalloidin (magenta), the nuclear marker Hoechst (DNA, blue), anti-perlecan (white in G, G’, I, I’ and green in H, H’, J, J’). (G’, I’, H’ and J’) Confocal YZ cross-sections along the white dotted lines shown in (G), (I), (H) and (J), respectively. Yellow arrows in (I’) and (J’) point to cell detachment from the BM in the wing margin region. Scale bar in all panels, 30 μm. At least 16 wing discs were assessed over three independent experiments. Source data are available online for this figure.
Figure 2
Figure 2. β-integrin and F-actin distribution in the wing margin changes over development.
(AC””) Confocal views of wing imaginal discs from early to late third-instar larvae stained with anti-βPS (green in AC”, white in A”’–C”’), the F-actin marker Rhodamine Phalloidin (magenta in AC”, white in A””–C””) and the nuclear marker Hoechst (DNA, blue in AC”). (AC) Maximal projections of control wing disc of 80 h AED (A), 96 h AED (B) and 120 h AED (C). (A’C’) Basal surface views of the regions specified in the yellow boxes in (AC). (A”C””) Confocal YZ cross-sections along the yellow dotted lines shown in (AC). White arrows in (A”’–C””) point to the wing margin region. (DF) Quantification of βPS and F-actin levels in control wing discs of the designated developmental time points in the regions framed in (A’’), (B’’) and (C’’), yellow and orange denote wing margin region and adjacent cells, respectively. Multiple Mann–Whitney U test from left to right: (D) ns not significant, (E) **p = 0.0083, **p = 0.0014, ***p = 1.6e−4, ***p = 1.5e−4, (F) *p = 0.037, *p = 0.0401, **p = 0.0025, **p = 0.0036. Error bars represent the mean ± SEM. Scale bar in all panels, 30 μm. At least 15 wing discs were assessed over three independent experiments. Source data are available online for this figure.
Figure 3
Figure 3. Integrin downregulation precedes F-actin changes in wing margin cells.
(A) Initial simulation at 0 h, showing a cross-section of the wing disc columnar epithelium perpendicular to the DV boundary. On the right, a close-up of the cross-section showing the apical actin layer (green), three cell body layers (cyan) and one integrin adhesion layer (greenish-brown). (B) Interpretive scheme of the integrin adhesion layer framed in orange in (A). Layers’ thickness in the scheme are not to scale. (C, D) Snapshot of simulation when basolateral contractility and reduction of integrin adhesion strength were applied simultaneously (C) or when the strength of the integrin adhesion was decreased prior to application of basolateral contractility (D). Magnifications of the region framed in the snapshots are also shown. (EF”) Confocal YZ cross-sections of control wing disc at 80 h AED (E) and 88 h AED (F) stained with anti-βPS (green in E, F and white in E’, F’), Rhodamine Phalloidin to detect F-actin (magenta in E, F and white in E”, F”) and the nuclear marker Hoechst (DNA, blue in E, F). (G, H) Quantification of βPS and F-actin levels in control wing discs of the designated developmental time points in the regions framed in E and F (orange and yellow boxes). Multiple Mann–Whitney U test from left to right: (G) ns not significant, (H) ***p = 8.8e−4, ***p = 9.3e−4, ns not significant. Error bars represent the mean ± SEM. Scale bar in all panels, 30 μm. At least 15 wing discs were assessed over three independent experiments. Source data are available online for this figure.
Figure 4
Figure 4. Ectopic reduction of integrin levels induces actin reorganization and cell shortening.
(AB”) Confocal views of third-instar wing imaginal discs stained with anti-GFP (white), anti-βPS (green), Rhodamine Phalloidin to detect F-actin (magenta in A, A’, B, B’, white in A”, A”’, B”, B”’) and the nuclear marker Hoechst (DNA, blue in A, A’, B, B’). (A) Control wing disc. (B) Wing disc co-expressing RNAis against mys and hid under the control of the ptcGal4 (ptc>mysRNAi;hidRNAi). (A’, A”, B’, B”) Confocal XZ cross-sections taken along the white dotted lines shown in (A, B). (A”’, B”’) Super-resolution images of XY sections taken in the region between the yellow and red dotted lines in (A, B). (C, D) Quantification of βPS and F-actin levels in the regions framed in (A’) and (B’) (orange and yellow boxes) in control (C) and ptc>mysRNAi;hidRNAi (D) wing discs. Multiple Mann–Whitney U test from left to right: (C) ns not significant, (D) ****p = 5.2e−14, ****p = 5.8e−9, ****p = 4.9e−12, ****p = 4.2e−10. Error bars represent the mean ± SEM. (E) Quantification of the height of wing margin and adjacent cells in control and ptc>mysRNAi;hidRNAi wing discs. Multiple Mann–Whitney U test from left to right: *p = 0.0183, **p = 0.007, ns not significant. Error bars represent the mean ± SEM. At least 15 wing discs were assessed over three independent experiments. Scale bar in all panels, 30 μm. Source data are available online for this figure.
Figure 5
Figure 5. Integrins regulate DE-cad localization.
(AG”’) Confocal views of 96 h AED third-instar wing discs of the designated genotypes, stained with anti-DE Cad (magenta in A, A’, C, C’, E, E’, green in G, G’ and white in A”’, C”’, E”’, G”’), the nuclear marker Hoechst (DNA, blue in A, A’, C, C’, E, E’, G, G’ and white in A”’, C”’, E”’), anti-GFP (green in C, C’, E, E’) and Rhodamine Phalloidin to detect F-actin (magenta in G, G’ and white in G”). Confocal YZ (A’A”’, G’–G”’) and XZ (C’–C”’, E’–E”’) cross-sections along the yellow dotted lines shown in A, C, E and G, respectively. White arrows in (A”’, C”’, E”’) and bracket in G”’ point to the wing margin region. (B, D, F, H) Quantification of anti-DE-Cad levels in controls and experimental wing discs in the regions framed in (A’), (C’), (E’) and (G’) (orange and yellow boxes). Multiple Mann–Whitney U test from left to right: (B) ***p = 0.00078, ***p = 0.00045, ns not significant, (D) ns not significant, (F) ***p = 0.00024, ***p = 0.00072, ns not significant, (H) ****p = 2.4e−5, ****p = 4.8e−6, ns not significant. Error bars represent the mean ± SEM. At least 15 wing discs were assessed over three independent experiments. Scale bar in all panels, 30 μm. Source data are available online for this figure.
Figure 6
Figure 6. Downregulation of F-actin levels abolishes basolateral accumulation of F-actin and cell shortening in the wing margin.
(A) Snapshot of a simulation where the integrin adhesion strength was reduced without inducing basolateral contractility. (BB’, DD’, FF’) Confocal views of wing imaginal discs of the indicated genotypes stained with anti-βPS (green), Rhodamine Phalloidin to detect F-actin (magenta) and the nuclear marker Hoechst (DNA, blue). (B, D, F) Maximal projections of control (B) and wing discs expressing an abiRNAi (D) or a scarRNAi (F) under the control of wgGal4. (B’, D’, F’) Confocal YZ cross-sections along the yellow dotted lines shown in B, D and F. (C, E, G) Quantification of βPS and F-actin levels in control (C), wg>abiRNAi (E) and wg>scarRNAi (G) wing discs in the regions framed in (B’), (D’) and (F’). Multiple Mann–Whitney U test from left to right: (C) ***p = 0.000138, ***p = 0.00098, ***p = 0.00069, ***p = 0.0002, (E) ***p = 0.00076, ***p = 0.00085, ns not significant, (G) *p = 0.016, *p = 0.015, ns not significant. Error bars represent the mean ± SEM. (H) Quantification of the height of wing margin and adjacent cells in control, wg>abiRNAi and wg>scarRNAi wing discs. Multiple Mann–Whitney U test from left to right: **p = 0.00186, *p = 0.049, ***p = 0.00023, ***p = 0.00038, ***p = 0.00049, *p = 0.02606, ns not significant. Error bars represent the mean ± SEM. Scale bar in all panels, 30 μm. At least 15 wing discs were assessed over three independent experiments. Source data are available online for this figure.
Figure 7
Figure 7. Maintenance of high levels of integrins in the wing margin blocks actin reorganization and cell shortening.
(AB”’) Confocal views of third-instar wing imaginal discs stained with anti-βPS (green), the F-actin marker Rhodamine Phalloidin (magenta in A, A’, B, B’, white in A”, A”’, B”, B”’) and the nuclear marker Hoechst (DNA, blue). (A) Control wing disc. (B) Wing disc co-expressing an active form of the αPS2 subunit (αPS2ΔCyt) and the βPS subunit under the control of wgGal4 (wg>αPS2ΔCyt; βPS). (A’, A”, B’, B”) Confocal YZ cross-sections taken along the white dotted lines shown in (A, B). (A”’, B”’) Super-resolution images of XY sections taken in the region between the magenta dotted line in (A, B). (C, D) Quantification of βPS and F-actin levels in control (C) and wg>αPS2ΔCyt; βPS (D) wing discs. Multiple Mann–Whitney U test from left to right: (C) ***p = 0.00011, ***p = 0.000434, ns not significant, (D) ****p = 3.1e−9, ****p = 2,7e−9, ns not significant. Error bars represent the mean ± SEM. (E) Quantification of the height of wing margin and adjacent cells in control and wg> αPS2ΔCyt; βPS wing discs. Multiple Mann–Whitney U test from left to right: **p = 0.01, *p = 0.0478, ns not significant. Error bars represent the mean ± SEM. Scale bar in all panels, 30 μm. At least 15 wing discs were assessed over three independent experiments. (F) Snapshot of a simulation where no integrin adhesion weakening or basolateral contractility was applied. (G) Snapshot of a simulation where only basolateral contractility was applied, without changing integrin adhesion strength. Magnifications of regions framed in the snapshots in (F) and (G) are also shown. Source data are available online for this figure.
Figure 8
Figure 8. Manipulation of integrin levels causes defects in wing disc folding and in the adult wing.
(A, C, E, G, I) Confocal views of 2 h APF wing imaginal discs of the indicated genotypes, stained with anti-βPS (green in E, E’, G, G’, I, I’), Rhodamine Phalloidin to detect F-actin (magenta) and the nuclear marker Hoechst (DNA, blue). (A, C, E) Maximal projections of control (A) and wing discs expressing an abiRNAi (C, wg>abiRNAi) or co-expressing an active form of the αPS2 subunit and the βPS subunit (E, wg>αPS2ΔCyt; βPS) under the control of wgGal4. (A’, C’, E’) Confocal cross-sections along the yellow dotted lines shown in (A, C, E). (B, D, F) Images of control (B), wg>abiRNAi (D) and wg>αPS2ΔCyt; βPS (F) adult wings. (G, I) Maximal projections of control (G) and wing discs co-expressing RNAis against mys and hid under the control of the ptcGal4, ptc>mysRNAi;hidRNAi (I). (G’, I’) Confocal cross-sections along the yellow dotted line shown in (G, I). (H, J) Images of control (H) and ptc>mysRNAi;hidRNAi (J) adult wings. Scale bar in all panels, 30 μm. Source data are available online for this figure.
Figure 9
Figure 9. Model illustrating the mechanisms of basal versus apical folding.
(A) During apical folding, apical constriction mediated by forces exerted by the cortical actomyosin network and the transmission of these forces to cadherin-based adherens junctions initiates folding. (B) On the basal side, folding is initiated by a reduction on integrin-mediated adhesion to the BM that triggers a basolateral reorganization of the actin cytoskeleton, the basal localization of cadherins and Rok and basal constriction.
Figure EV1
Figure EV1. F-actin and Myosin organization changes throughout development in wing margin cells.
(AD) Confocal views of third-instar wing discs stained with anti-mys-GFP (green in AA’, BB’, CC’, DD’ and white in A”, B”, C”, D”) and Rhodamine Phalloidin to detect F-actin (magenta in AA’, BB’, CC’, DD’ and white in A”’, B”’, C”’, D”’). (A, B, C, D) Maximal projections of 80 h AED (A, C) and 96 h AED (B, D) wing discs. (A’–A”’, B’–B”’, C’–C”’, D’–D”’) High resolution images of YZ sections taken at the region in the dotted square in (A, B, C, D), respectively. (E) Quantification of mys-GFP, sqh-GFP and F-actin levels in mid L3 wing discs at the regions framed in (A’, B’, C’, D’). Multiple Mann–Whitney U test from left to right: ***p = 0.0002, ***p = 0.0002, ***p = 0.0016, ***p = 0.0049, ***p = 0.0003, ***p = 0.0007. Error bars represent the mean ± SEM. Scale bar in all panels, 30 μm. At least 15 wing discs were assessed over three independent experiments. Source data are available online for this figure.
Figure EV2
Figure EV2. Integrin levels condition nuclear positioning.
Confocal YZ (AA”, CC”) and XZ (BB”) cross-sections of third-instar wing discs stained with anti-βPS (green in A, B, C and white in A’, B’, C’), Rhodamine Phalloidin to detect F-actin (magenta in A, B, C and white in A”, B”, C”) and the nuclear marker Hoechst (DNA, blue in A, B, C and white in A”’, B”’, C”’). (A) Control wing disc. (B) Wing disc co-expressing RNAis against mys and hid under the control of ptcGal4, ptc>mysRNAi; hidRNAi. (C) Wing disc co-expressing an active form of the αPS2 subunit and the βPS subunit under the control of wgGal4, wg>αPS2ΔCyt; βPS. (D) Quantification of the fractional nuclear position in wing margin and adjacent cells in control and experimental wing discs. Multiple Mann–Whitney U test from left to right: ***p = 0.000455, ****p = 1.62768E−05, ****p = 7.05405E−09, ns not significant. Error bars represent the mean ± SEM. Scale bar in all panels, 30 μm. 200 nuclei were analyzed in at least 15 wing discs over three independent experiments. Source data are available online for this figure.
Figure EV3
Figure EV3. Rok is found basally in wing cells with low integrin levels.
(AC) Confocal views of third-instar wing discs of the indicated genotypes, stained with Rhodamine Phalloidin to detect F-actin (magenta A, A’, B, B’, C, C’ and white in A”, B”, C”) and the nuclear marker Hoechst DNA (blue in A, A’, B, B’, C, C’). mNGROK signal is shown in green in A, A’, B, B’, C, C’ and in white in A”’, B”’, C”’ (AC). Maximal projections of a third-instar wing imaginal discs of the indicated genotypes. Confocal YZ (A’–A”’) and XZ (B’–B”’, C’–C”’) cross-sections along the yellow dotted lines shown in (AC). (DF) Quantification of mNGROK levels in controls and experimental wing discs along the white dotted lines in (A), (B) and (C). Multiple Mann–Whitney U test from left to right: (D) ***p = 0.002, ***p = 0.001, ***p = 0.0006, ***p = 0.00011, (E) ns not significant, (F) ***p = 0.0013, ***p = 0.00011, ***p = 0.00074, ***p = 0.00047. Error bars represent the mean ± SEM. Scale bar in all panels, 30 μm. At least 15 wing discs were assessed over three independent experiments. Source data are available online for this figure.
Figure EV4
Figure EV4. Integrins regulate pSqh levels in wing margin cells.
(AA”, CC”, EE”, GG”) Confocal views of third-instar wing discs of the designated genotypes stained with anti-βPS (green), anti-pSqh (magenta in A, A’, C, C′, E, E’, G, G’ and white in A”, C”, E”, G”), and the nuclear marker Hoechst DNA (blue in A, A’, C, C’, E, E’, G, G’). (A, C, E, G) Maximal projections of a third-instar wing imaginal discs of the indicated genotypes. Confocal YZ (A’, A”, G’, G”) and XZ (C’, C”, E’, E”) cross-sections along the yellow dotted lines shown in (A, C, E, G). (B, D, F, H) Quantification of βPS and pSqh levels in control and experimental wing discs in the regions framed in (A’, C’, E’, G’) (orange and yellow boxes). Multiple Mann–Whitney U test from left to right: (B) ***p = 0.00013, ***p = 0.0029, ****p = 1.1e−5, ****p = 1.1e−5, (D) ns not significant, (F) ****p = 4.4e−14, ****p = 6.1e−11, **p = 0.0024, **p = 0.0018, (H) ****p = 4.8e−14, ****p = 6.1e−11, ns not significant. Error bars represent the mean ± SEM. Scale bar in all panels, 30 μm. At least 15 wing discs were assessed over three independent experiments. Source data are available online for this figure.

Similar articles

References

    1. Brown NH (1993) Integrins hold Drosophila together. BioEssays 15:383–390 - PubMed
    1. Cetera M, Ramirez-San Juan GR, Oakes PW, Lewellyn L, Fairchild MJ, Tanentzapf G, Gardel ML, Horne-Badovinac S (2014) Epithelial rotation promotes the global alignment of contractile actin bundles during Drosophila egg chamber elongation. Nat Commun 5:5511 - PMC - PubMed
    1. Chalut KJ, Paluch EK (2016) The actin cortex: a bridge between cell shape and function. Dev Cell 38:571–573 - PubMed
    1. Christodoulou N, Skourides PA (2015) Cell-autonomous Ca(2+) flashes elicit pulsed contractions of an apical actin network to drive apical constriction during neural tube closure. Cell Rep 13:2189–2202 - PubMed
    1. Clarke DN, Martin AC (2021) Actin-based force generation and cell adhesion in tissue morphogenesis. Curr Biol 31:R667–R680 - PMC - PubMed

LinkOut - more resources