. 2025 Mar;28(3):602-615.
doi: 10.1038/s41593-025-01876-8. Epub 2025 Feb 17.

Compartmentalized dendritic plasticity in the mouse retrosplenial cortex links contextual memories formed close in time

Affiliations

Compartmentalized dendritic plasticity in the mouse retrosplenial cortex links contextual memories formed close in time

Megha Sehgal et al. Nat Neurosci. 2025 Mar.

Abstract

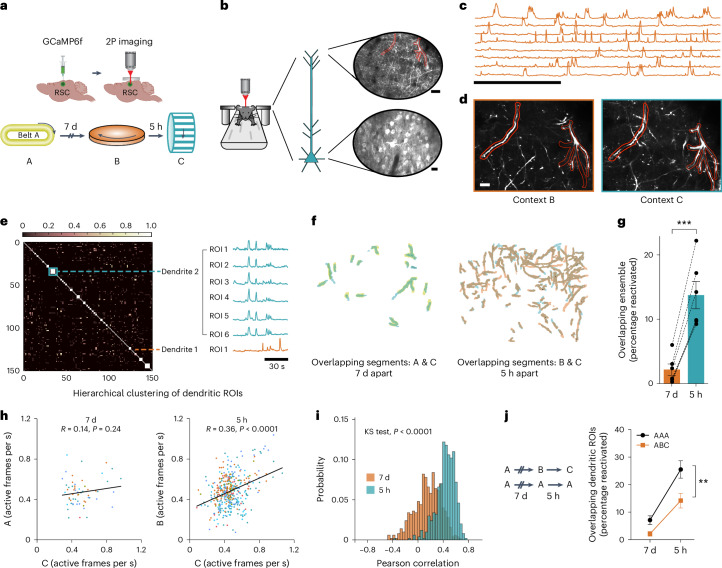
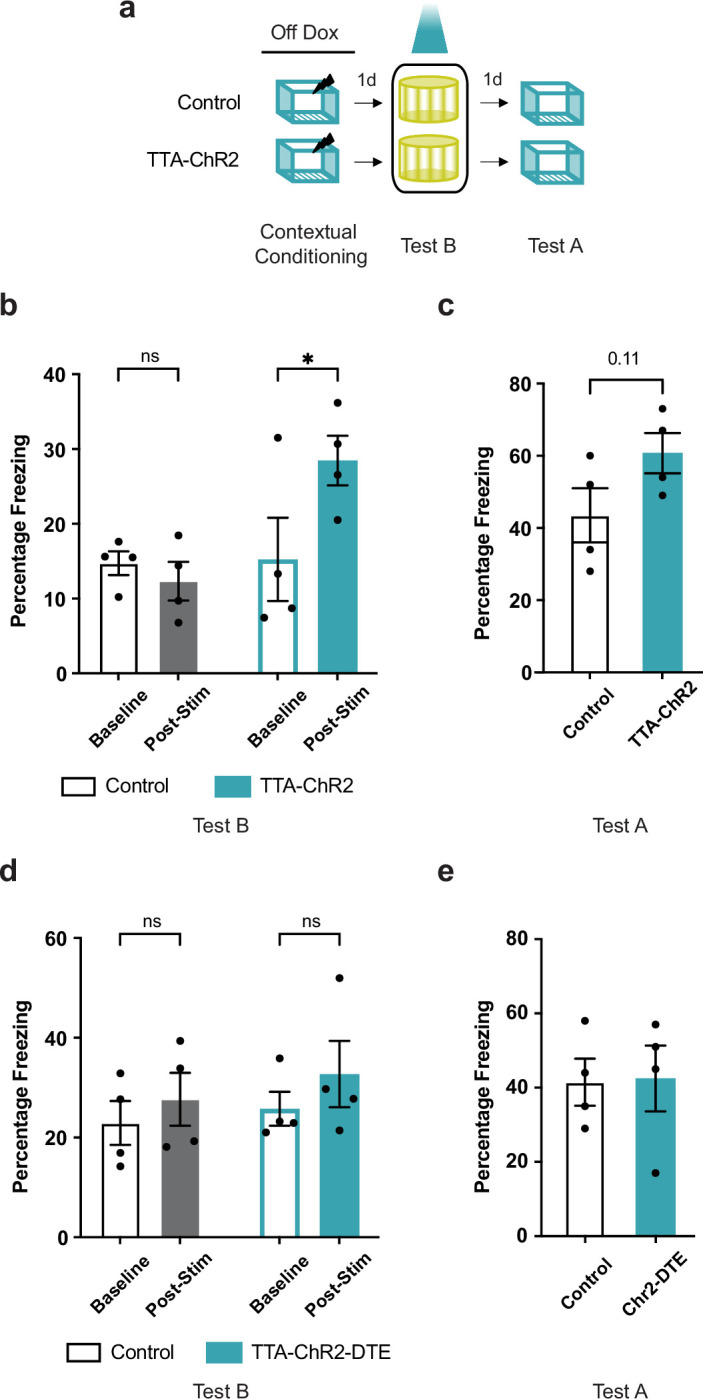
Events occurring close in time are often linked in memory, and recent studies suggest that such memories are encoded by overlapping neuronal ensembles. However, the role of dendritic plasticity mechanisms in linking memories is unknown. Here we show that memory linking is dependent not only on neuronal ensemble overlap in the mouse retrosplenial cortex, but also on branch-specific dendritic allocation mechanisms. The same dendritic segments are preferentially activated by two linked (but not independent) contextual memories, and spine clusters added after each of two linked (but not independent) contextual memories are allocated to the same dendritic segments. Importantly, we show that the reactivation of dendrites activated during the first context exploration is sufficient to link two contextual memories. Our results demonstrate a critical role for localized dendritic plasticity in memory integration and reveal rules governing how linked and independent memories are allocated to dendritic compartments.


Conflict of interest statement

Competing interests: The authors declare no competing interests.

Figures

Fig. 1
Fig. 1. Overlapping RSC ensembles are recruited to encode contextual memories acquired close in time.
a, Miniscope methodology. b, GCaMP6f expression within the RSC. Scale bars, 1 mm and 100 µm (inset). c, Example maximum intensity projection of processed calcium signals during context exploration. Scale bars, 50 µm and 50 µm (inset). d, Representative calcium traces from 15 putative RSC neurons from one mouse. Scale bar, 30 s. e, Overlapping RSC ensembles encode distinct memories acquired close in time. Top: mice were imaged while exploring three novel contexts (A, B and C) separated by 7 days or 5 h. Bottom left: overlapping neurons in RSC ensembles in a representative mouse when contexts were separated by 7 days and 5 h. Bottom right: RSC neuronal ensembles displayed greater overlap when contexts were separated by 5 h versus 7 days (n = 12 mice per group, paired t-test, t = 4.6, P = 0.0008). f, RSC neurons with a high frequency of calcium transients continued to fire at high rates when contexts were explored close in time. Left: frequency of calcium transients for all RSC neurons from one mouse (normalized to the frequency of calcium transients in context C). Right: population vector correlation (PVC) for normalized FRs (n = 9 mice per group; paired t-test, t = 5.1, P = 0.0009). g, An NB classifier is better at distinguishing two contexts explored 7 days versus 5 h apart. The area under the curve (AUC) for the binary NB classification was higher for sessions recorded 7 days apart (n = 9 mice per group; paired t-test, t = 3.5, P = 0.008). Dashed line indicates chance performance (AUC = 0.5). h, The stability of neuronal coactivity across sessions is represented as the absolute difference in PWCs between sessions. 50 cell pairs; higher numbers (darker color) indicate more stable coactivity patterns. i, The coactivity of neuronal pairs is more stable in two contexts explored 5 h versus 7 days apart (n = 9 mice per group; paired t-test, t = 3.4, P = 0.009). Data represent the mean ± s.e.m. and each data point. All t-tests were two tailed. **P < 0.01, ***P < 0.001. Source data
Fig. 2
Fig. 2. Overlap in RSC neuronal ensembles is sufficient to link contextual memories.
a, Schematic of the TetTag system: cFos-tTa or wild-type littermate mice were injected with the TRE-hChR2-mCherry virus. b, ChR2-mCherry expression in the RSC 1 day after fear learning. Scale bar, 100 µm. c, Optogenetic reactivation of an RSC ensemble underlying a fearful context is sufficient for fear expression: top, experimental setup; middle, optogenetic stimulation protocol; bottom, during test B, TTA-ChR2 mice displayed more freezing compared to the control group during the post-baseline stimulation and non-stimulation epochs (n = 4 mice per group; two-way repeated-measures (TWRM) analysis of variance (ANOVA), FInteraction (2, 12) = 6.95, P = 0.009, uncorrected Fisher’s least significant difference). d, Optogenetic reactivation of an RSC ensemble underlying a linked memory is sufficient for fear expression: top, experimental setup; bottom, reactivation of the RSC neuronal ensemble tagged during the linked context exploration (context A) increased freezing in cFos-tTa mice during the post-stimulation period, while the freezing in the control group remained unchanged (n = 16 and 14 mice for control and cFos-tTa groups; TWRM ANOVA, FInteraction (1, 28) = 12.5, P = 0.001; Sidak’s test; baseline freezing (control versus TTA-ChR2: P = 0.99); post-stim freezing (control versus TTA-ChR2: P = 0.046); TTA-ChR2 (baseline versus post-stim freezing: P < 0.0001). e, Reactivation of the RSC ensemble underlying the first context memory extends the temporal window for memory linking: RSC ensemble tagged during context A was reactivated on the day between the two context exposures separated by 2 days. While control mice did not link the two contexts, reactivation of the first context ensemble led to contextual memory linking in the experimental group: freezing in both previously explored contexts was higher than freezing in a novel context (n = 14 mice per group; TWRM ANOVA, FInteraction (2, 52) = 3.3, P = 0.04; Dunnett’s test; novel versus test B: P = 0.046 and 0.0003; novel versus test A: P = 0.68 and 0.007 for control and TTA group respectively). Data represent the mean ± s.e.m. and each data point. *P < 0.05, **P < 0.01, ***P < 0.001. Dox, doxycycline; HC, home cage; NS, not significant; Post-stim, post-stimulation; Imm shock, immediate shock. Source data
Fig. 3
Fig. 3. Overlapping dendritic segments encode memories of two contexts explored close in time.
a, Experimental setup. b, RSC neurons and dendritic segments were tracked across 7 days. Maximum intensity projection from one imaging session showing apical dendritic segments (top, scale bar, 20 μm) and layer V RSC neurons (bottom, scale bar, 10 μm). c, Representative calcium traces from eight putative RSC dendritic segments. Scale bar, 2 min. d, Dendritic segments from b tracked across two imaging sessions 5 h apart. Scale bar, 10 μm. e, Hierarchical clustering of RSC dendritic ROIs: Sorted cosine similarity matrix of 150 ROI pairs from one animal. Blue box and line depict the correlated calcium activity of 6 ROIs clustered as a single dendrite. Orange line indicates a single ROI that was not clustered with any other ROI. f, Example of reactivated (overlapping) dendritic segments from one mouse. g, The same dendritic segments are more likely to be activated when context exposures are 5 h apart versus 7 days apart (paired t-test; t = 9.2; P = 0.0003; n = 6 mice). h, Dendritic activity is more correlated when dendrites are reactivated 5 h (P < 0.0001) versus 7 days (P = 0.24) apart. Scatterplot of the FRs of all reactivated ROIs in context A (7 days) and context B (5 h) as a function of FRs in context C. Lines represent least-squares linear regression. Data from each mouse are represented in a different color. i, To confirm the differences in the number of reactivated dendrites for two context exposures 7 days or 5 h apart did not affect our results in h, data from h were subsampled (30 ROI pairs, 500×) to generate a probability distribution of Pearson correlations (Kolmogorov–Smirnov (KS) test, P < 0.0001). j, Dendritic overlap is greater when mice explore the same context versus distinct contexts (TWRM ANOVA, FContext (1, 11) = 8.5, P = 0.01; Sidak’s test; AAA (5 h versus 7 days), P < 0.0001; n = 6 and 7 for ABC and AAA groups. Data represent the mean ± s.e.m. and each data point. All comparisons were two tailed. **P < 0.01, ***P < 0.001. Source data
Fig. 4
Fig. 4. Spines are added to overlapping dendritic segments following memory linking.
a, Apical RSC dendrites of Thy1-YFP mice were imaged through a cranial window. b, Experimental setup. c, Representative example of spine dynamics during longitudinal imaging showing clustering of new spines following linked memory formation. Gained spine indicated by a white arrowhead. HC: last baseline imaging session; A, B and C: exposure to contexts A, B and C, respectively. Scale bar, 1 μm. d, Schematic of various spine dynamics (spine addition, elimination and clustering) measured. e, New spines are likely to be added to the same dendritic segments when contexts are explored close in time. Left: number of new spines added to a dendritic segment following context A and B exposure 7 days apart are not correlated (ρ = 0.09, P = 0.55). Right: number of new spines added to a dendritic segment following context B and C exposure 5 h apart are correlated (ρ = 0.37, P = 0.01). Spearman’s correlation (n = 45 dendrites, 6 mice); alpha level was adjusted to 0.025 to account for multiple comparisons. f, Mutual information between new spines added at 7 days or 5 h apart was higher for spines added following context exposures 5 h versus 7 days apart. Observed values (red line) were compared to the z-score of a chance distribution (n = 45 dendrites; 6 mice). g, For HC controls, the numbers of new spines added to a dendritic segment were not correlated whether imaging sessions are separated by either 7 days (right, ρ = 0.22, P = 0.15) or 5 h (left, ρ = 0.14, P = 0.38; n = 5 mice). Spearman’s correlation (n = 42 dendrites, 5 mice); alpha level was adjusted to 0.025 to account for multiple comparisons. h, Mutual information between new spines added at 7 days or 5 h was unchanged in control mice. Observed values (red line) were compared to the z-score of a chance distribution (n = 42 dendrites, 5 mice). Box plots represent the median as the central mark, 25th and 75th percentiles as box edges and whiskers extend to the most extreme data points; all comparisons were two tailed. Horizontal dashed line in f and h represents the cutoff for significance at z-score = 2. Source data
Fig. 5
Fig. 5. Overlapping dendritic segments gain spine clusters following memory linking.
a, Clustered spine positions following one imaging session were randomly distributed on the dendritic segment. Percentage of clustered spines co-allocated to the same dendritic segments following contexts explored 7 days (left) and 5 h (right) apart; n = 6 mice; 10,000 permutations. b, New spines following context exposures 5 h, but not 7 days, apart are formed close to one another (KS test, P < 0.0001). Inset: average distance between newly formed spines following context exposures 7 days versus 5 h apart; (n = 46 and 60 spine pairs for 7 day and 5 h conditions, 6 mice; Mann–Whitney, P < 0.0001). c, For HC controls, the percentage of clustered spines that were added to segments also containing clustered spines in a previous imaging session (7 days or 5 h prior) were at chance levels; n = 5 mice; 10,000 permutations. d, New spines formed in control mice did not co-cluster 5 h or 7 days apart (KS test, P = 0.6). Inset: average distance between newly formed spines in home cage controls 7 days or 5 h apart. Mann–Whitney test, P = 0.8; n = 53 and 76 spine pairs for 7 day and 5 h conditions, n = 5 mice. Cumulative frequency distribution and the average distance between nearest neighboring spines are different between the experimental and HC groups for imaging sessions performed 5 h apart (KS test, P < 0.0015 and Mann–Whitney, P = 0.02, respectively). eg, Forty dendritic branches for each condition were randomly subsampled (10,000×) to calculate a cumulative distribution of Spearman’s rho (ρ) (e), mutual information (f) and percentage of clustered spines (g). Insets demonstrate that Spearman’s rho (ρ) (e), mutual information (f) and the probability of gaining a clustered spine on a segment (g) already containing a clustered spine during a previous session (all P values < 0.0001), is higher for resampled experimental versus HC group at the 5 h interval. Data points were resampled from the same distributions and hence are not independent of one another. In the box plots, the central mark represents the median, box edges indicate the 25th and 75th percentiles, whiskers indicate the most extreme data points, each data point. All comparisons were two tailed. Exp, experimental. Source data
Fig. 6
Fig. 6. Optogenetic reactivation of RSC dendritic ensembles links contextual memories.
a, TRE-hChR2-mCherry-DTE virus was injected into cFos-tTa mice to express Channelrhodopsin in the recently activated dendritic segments of cFos-expressing neurons. b, Representative RSC images of cFos-tTa mice injected with TRE-hChR2-mCherry-DTE and TRE-hChR2-mCherry showing selective expression of Channelrhodopsin in dendritic segments in the presence of DTE. White arrowheads indicate somatic expression of hChR2. Scale bar, 20 µm. c, Whole-cell patch-clamp recordings from RSC neurons of cFos-tTa mice tagged using TRE-ChR2 or TRE-ChR2-DTE constructs. Representative waveforms showing optogenetic stimulation of RSC neurons from TTA-ChR2 and TTA-ChR2-DTE mice resulted in action potentials and transient depolarizations, respectively. Scale bars, 20 mV (top), 1 mV (bottom); 250 ms. Inset shows a magnified view of the first optogenetic stimulation showing response latencies of the stimulus onset. Scale bar, 25 ms. d,e, Average number of action potentials (APs) elicited (d) and response amplitudes (e) in TTA-ChR2 and TTA-ChR2-DTE mice. (Mann–Whitney test, P = 0.0025; TTA-ChR2: n = 7 cells (3 mice) and TTA-ChR2-DTE: n = 5 cells (3 mice) for d and e). f, Experimental setup: top, mice explored two contexts 2 days apart. On the day between the two context exposures, the dendrites activated during the first context exposure were reactivated. Bottom: reactivation of context A dendrites, on the day between exposures to contexts A and B, resulted in high freezing in both the previously explored contexts (context A: linked context and context B: shock context) relative to freezing in a novel context. The control mice froze similarly in context A and a novel context, but the freezing in context B (shock context) was higher than freezing in context A or a novel context (n = 10 mice each for control and cFos-tTa groups; TWRM ANOVA, Ftime (2, 36) = 14.11, P < 0.0001; Dunnett’s multiple-comparisons test). Box plots represent the median as the central mark, 25th and 75th percentiles as box edges, the whiskers extend to the most extreme data points, each data point is presented. Column graphs represent the mean ± s.e.m. and each data point. All comparisons were two tailed; *P < 0.05, ***P < 0.001. Source data
Fig. 7
Fig. 7. Dendritic mechanisms are necessary for linking memories acquired close in time in a spiking network model.
a, Spiking network model: network consists of two-layer excitatory neurons (gray) with dendritic subunits, and subpopulations of dendrite-targeting and soma-targeting interneurons (black). b, Details of the learning-related plasticity mechanisms within the two network models: memory formation results in increases in somatic and dendritic excitability, and synapses are more likely to be potentiated in the presence of preexisting potentiated synapses on the same dendrite. Learning-related changes in dendritic excitability and probability of synaptic potentiation are eliminated in the linking model without dendritic mechanisms. ce, Neuronal overlap (c), overlap between dendritic branches containing potentiated synapses (d) and overlap between dendritic branches containing newly added clustered spines (e) for encoding of two memories acquired 5 h, 2 days or 7 days apart. When dendritic mechanisms are removed from the model, overlap between these measures is reduced when memories are acquired 5 h apart. f, Co-recall of two memories as measured by neuronal overlap during recall. Without dendritic mechanisms, neuronal overlap during recall is similar whether memories are acquired 5 h, 2 days or 7 days apart, indicating a lack of memory linking. TWRM ANOVA, FInteraction (2,36) = 17.8 (c), 54.7 (d), 344.4 (e) and 61.9 (f); all P values < 0.0001, Dunnett’s post hoc test. For simplicity, only comparisons within the linking model without dendritic mechanisms are presented. g, Dendritic overlap allows somatic overlap and co-recall of memories. Inputs representing context A and B impinge on overlapping or separate dendrites (dendritic overlap is eliminated). During encoding and recall, the neuronal overlap was reduced between groups at 5 h but not 2 day and 7 day time intervals (Sidak’s post hoc test, P < 0.0001). When memories are encoded by nonoverlapping dendrites, neuronal overlap is similar between 5 h, 2 day and 7 day groups (TWRM ANOVA, encoding: FInteraction (2, 36) = 25.49, recall: FInteraction (2, 36) = 66.2; all P values < 0.0001, Dunnett’s post hoc test). Neuronal overlap represents the percentage above chance overlap. Data represent the mean ± s.e.m. of ten simulation trials. ****P < 0.0001. Source data
Extended Data Fig. 1
Extended Data Fig. 1. Stability of imaging and neuronal registration across days.
(a) Top: Images of mean fluorescence from each session from a representative mouse. Scale: 50 µm. These images from each session were cross-registered with each other (see Methods). Bottom: Description of imaging paradigm and RSC ensemble segmented from a mouse. (b) RSC ensemble size remains stable across hours and days when different contexts are imaged (4599 putative RSC neurons, 132.9 ± 11.6 neurons per session, One-way repeated measures ANOVA, F (1.08, 11.9) = 0.52, p = 0.5, n = 12 mice per group). Please note that although the size of these ensembles remains unchanged, the neurons participating in these ensembles may change. (c) Spatial correlation and centroid distance were calculated for all cell pairs from all mice. Ensemble overlap using a range of criteria from spatial correlation ≥ 0.6-0.95 and centroid distance ≤ 3-9 pixels is shown in Supplementary Table 1. (d) Example cross-registration of neurons in a mouse from sessions 7 days and 5 hours apart. Red cross indicates matched cells. Cross-registration criteria: spatial correlation = 0.9 and centroid distance = 4 pixels. (e) Representational drift over a week: Mice were exposed to the same context (AAA) five hours or seven days apart. RSC neuronal ensembles display greater overlap when mice experience the same context 5 hours vs. 7 days apart. (n = 11 mice per group; paired t-test, t = 3.9, p = 0.003). (f) Neuronal ensemble stability over a week: Mice were exposed to two different (AB) or the same context (CC) seven days apart. All context presentations were counterbalanced. RSC neuronal ensembles display greater overlap when mice experience the same context 7 days apart vs. distinct contexts. (n = 11 mice per group, paired t-test, t = 4.07, p = 0.002). Data represent mean ± s.e.m. and each data point; all comparisons were two-tailed. Source data
Extended Data Fig. 2
Extended Data Fig. 2. Neuronal activity is more correlated when two contexts are explored closer in time.
(a, b) Scatter plot of the firing rate of all neurons from one mouse in context A (a, 7 days apart) and context B (b, 5 hours apart) as a function of firing rate in context C highlights that neuronal firing rate is maintained when two contexts are explored close in time. Lines represent least-squares linear regression. (c) Naive Bayes (NB) classifier is more accurate at distinguishing imaging sessions recorded 7 days vs. 5 hours apart irrespective of bin size. AUC (area under the curve) for the binary NB classification between sessions recorded 7 days (7d) apart or 5 hours (5h) apart using neuronal activity indicates that neuronal activity can be used to distinguish between contexts explored 7 days apart more accurately than contexts explored 5 hours apart. Spike probabilities were binned for non-overlapping intervals ranging from 0.5 to 60 seconds (step size 0.5 s; TWRM ANOVA for AUC by bin size; FGroup (1, 16) = 6.2, p = 0.02, n = 9 mice per group). Data represent mean ± s.e.m. Chance Levels performance of the AUC = 0.5. Source data
Extended Data Fig. 3
Extended Data Fig. 3. Neuronal activity is correlated with the probability of neuronal overlap.
(a) The top 10% high-activity cells in context B are likely to be the top 10% high-activity cells in context C 5 h later. Probability of overlap between high-activity cells in context A (7d) or context B (5h) and high-activity cells in context C. Left: Probability of overlap between subsets of cells with different levels of activity during previous context exploration session (A or B) across time in C. Color bars refer to normalized probabilities (chance = 1). Cumulative values were used for x and y-axes (for example, for x-axis, 300 s means 0–300 s; for y-axis, 40 refers to the neurons within the top 40% of high activity). Values represent averages across mice. Right: the distribution of SEM across mice for the figures on the left. Numbers (in the probability of overlap figures) represent the maximum SEM from each plot. (b) Similar to figure (a) but for AAA condition. (c, d) Similar to figures (a) and (b) respectively but the probability of overlap between low-activity cells in contexts experienced 7 d or 5 h before and high-activity cells in the third context is presented under ABC (c) and AAA (d) conditions. (e) Cells were sorted from high to low activity in contexts A or B with a 10% sliding window, 2% steps. Plots show the probability of overlap between subsets of cells (10% ensemble size) from context A (7d) or B (5h) and the top 10% high FR cells from context C. The probability values were z-scored with respect to a null distribution created by randomly subsampling 10% of cells from contexts A or B, 10,000x (that is, results are represented as standard deviation (SD) from the mean of the null distribution). Dashed line: 2 SD and 3 SD thresholds. (f) Same comparison as (e) but for the AAA condition. (ABC, AAA: n = 9 mice each). Source data
Extended Data Fig. 4
Extended Data Fig. 4. High and low firing rate neurons make differential contributions to representational similarity to regulate memory linking and discrimination.
(a) Euclidean distance (ED) between correlation maps. For each animal, the ED was calculated for all possible combinations to create an ED map. For each map, all the distances were normalized by the maximum distance. Normalized ED maps were then averaged across animals to produce the plots (ABC, right, AAA, left, n = 9 each). ED between correlation maps in the 5 h interval is lower than for the 7 d interval for the ABC (right) or the AAA (left) contexts conditions. (b) Cells were sorted from high to low activity in context C (x-axis) with a 10% sliding window and 2% steps. Correlation maps were calculated by excluding 10% of cells belonging to each of these sliding windows and the ED (y-axis) between contexts explored 7 d or 5 h apart under ABC (right) or AAA (left) condition was calculated. ED values were normalized with to a null distribution created by randomly subsampling 10% of cells from context C, 10,000x (that is, results are represented as standard deviation (SD) from the mean of the null distribution). The 2 SD threshold is labeled with a dashed line. Plots on the bottom of each image show the average ED across animals for the 7 d and 5 h intervals when the following groups of cells are excluded: 0-10%, 30-40%, 60-70%, and 90-100%. Note that the ED for the 5 h interval is always lower than for the 7 d interval. For AAA, the exclusion of any batch of 10% cells does not significantly affect the ED. However, for the 5 h interval in ABC, the top 10% FR cells, when excluded, significantly change the ED. Therefore, the top 10% FR cells are critical for the similarity between correlation maps when different contexts are explored but the contribution of these top 10% FR cells is not significant when the same context is explored at the same time intervals. (c) Plots show the average normalized correlation maps across animals during context exploration in ABC (top) or AAA (bottom) conditions. For each animal, cells were sorted from high to low firing rate (based on the last context exploration). The neuronal population was then split into 10% non-overlapping groups. Average Pearson correlation between groups was calculated. A correlation map of the average correlation between groups was constructed and normalized to the maximum average correlation value for each animal. Plots show the average of these normalized correlation maps across all animals. The top FR cells have the highest correlation values for all conditions and sessions. Importantly, for AAA, all correlation maps are similar despite the session. However, for ABC, the maps show larger differences, and the similarity between correlation values between contexts B and C, which are 5 h apart, seem to be higher for the high FR cells, as shown previously. Source data
Extended Data Fig. 5
Extended Data Fig. 5. RSC neuronal ensemble (and not dendritic ensemble reactivation) following contextual fear conditioning results in fear expression.
(a) Experimental setup: cFos-tTa (TTA-ChR2) mice and their wildtype littermates (Control) underwent bilateral viral injections (TRE-ChR2-mCherry) and optic cannula implants. Mice were taken off doxycycline chow (three days before contextual fear conditioning in context A: 2 footshocks, 2 s, 0.7 mA) to allow c-fos promoter-driven tTA and Channelrhodopsin (ChR2) expression. Following contextual fear conditioning, mice were tested in a novel context (Test B) while the previously tagged neurons were activated. The following day mice were retested without any optogenetic manipulation in the training context (Test A). (b) During Test B, freezing during the two post-stimulation conditions (with laser and without laser stimulation) was not different. Therefore, freezing during this period is presented together as post-stimulation freezing (TWRM ANOVA, group X time interaction, F (1, 6) = 11.93, p = 0.01, Sidak’s post hoc tests, n = 4 each group)). (c) During Test A, the TTA-ChR2 mice display comparable freezing to the control mice (t = 1.85, df=6, p = 0.11, n = 4 each group). (d) Reactivation of previously activated dendrites is not sufficient for fear memory expression: Experimental set up is the same as (a), but animals were injected with TRE-hChR2-mCherry-DTE or TRE-mCherry-DTE virus in the RSC to reactivate dendritic segments active during contextual fear conditioning. Both groups display similar freezing during baseline and post-stimulation epochs while testing in a novel context (TWRM ANOVA, group X time interaction, F (1, 6) = 0.26, p = 0.6, Sidak’s post hoc tests, n = 4 each group)). (e) Both groups (injected with TRE-hChR2-mCherry-DTE or TRE-mCherry-DTE virus in the RSC) display similar freezing during test in Context A (t = 0.09, df=6, p = 0.9, n = 4 each group). Data represent mean ± s.e.m. and each data point, * p < 0.05, ns = not significant; all comparisons were two-tailed. Source data
Extended Data Fig. 6
Extended Data Fig. 6. Optogenetic activation of a randomly labeled ensemble does not result in memory linking.
(a) Mice received a bilateral injection CamKII-Cre::DIO-ChR or CamKII-Cre::DIO-GFP to label a small subset of RSC ensemble. (b) Representative image of WT mice injected with CamKII-Cre::DIO-ChR-GFP in the RSC. Scale: 20 µm. (c) Control (CamKII-Cre::DIO-GFP, n = 15) as well as experimental (CamKII-Cre::DIO-ChR, n = 9) mice display low levels of freezing in a novel as well as the previously explored neutral (Context A) context but freeze more in the training context (Context B). (TWRM ANOVA, Ftime (1.9, 42.4) = 9.8, p = 0.0004, Tukey’s multiple comparisons test). Data represent mean ± s.e.m. and each data point, * p < 0.05. Source data
Extended Data Fig. 7
Extended Data Fig. 7. Chemogenetic manipulation of the neuronal ensemble overlap is sufficient to link two distinct contextual memories.
(a) All mice received a bilateral injection of lentivirus DREADD hM3Dq-T2A-EGFP which infects a sparse population of RSC neurons. Representative images demonstrating hM3Dq-T2A-EGFP infection of RSC neurons from two mice on the left. Scale: 100 and 20 µm. (b) All mice explored two different contexts 2 days apart and were subsequently shocked in one of these contexts. Neuronal excitability was increased in a small subset of RSC neurons by administering a CNO (0.5 mg/kg) injection 45 mins before each context exploration. The control mice only received the CNO injection before the second context exploration. (c) Control mice display low levels of freezing in a novel as well as the previously explored neutral (Context A) context but freeze more in the training context (Context B). In contrast, mice from the experimental group display memory linking: Both the previously explored contexts (Context A and B) elicit high freezing relative to the freezing in a novel context. (TWRM ANOVA, Ftime (1.8, 44.9) = 28.45, p < 0.0001; Dunnett’s multiple comparisons test; Saline-CNO, n = 15, CNO-CNO, n = 12,). The physical contexts presented were counterbalanced to minimize any effect of context similarity. Data represent mean ± s.e.m. and each data point, * p < 0.05, ** p < 0.01, *** p < 0.001. Source data
Extended Data Fig. 8
Extended Data Fig. 8. Reactivation of dendritic ensembles is accompanied by overlap in neuronal ensemble in head-fixed mice and requires NMDA receptor activation.
(a, b) Experimental setup: Head-fixed mice experienced three distinct contexts either 7 days or 5 hours apart while calcium transients from layer V RSC neurons were imaged. (c) Mean frames from three imaging sessions from a mouse. Scale: 40 µm. (d) Overlapping neuronal ROIs reactivated when contexts are separated by 7 days (left) or 5 hours (right) from one mouse. (e) The same neuronal ensemble is more likely to be activated in a head-fixed setting when context exposures are 5 hours (5 h) apart vs. 7 days (7 d) apart. (paired t-test; t = 5.6; p = 0.01; n = 4 mice). (f-h) NMDA receptor activation is required for the reactivation of dendritic ensembles. Dendritic overlap was measured as described in Fig. 3. Mice were administered NMDA receptor antagonist, MK801, 30 minutes prior to the first context exposure. (i) NMDA receptor antagonist, MK801, impairs reactivation of dendritic ensembles following two context exposures 5 hours (5 h) apart (unpaired t-test; t = 2.7; p = 0.02; n = 5 and 6 mice in control and MK-801 group each). Data represent mean ± s.e.m. and each data point; all comparisons were two-tailed. Source data
Extended Data Fig. 9
Extended Data Fig. 9. Spine dynamics within the RSC following context exposure.
(a) Thy1-YFP mice were imaged every two days (baseline), and the same RSC dendrites were tracked to measure contextual exposure-related spine dynamics. Following two baseline imaging sessions, mice were left in the home cage or exposed to a novel context. (b) Spine addition, spine loss, and spine turnover is not altered within the RSC apical dendrites following context exposure (TWRM ANOVA; Sidak’s post hoc tests;). Control: n = 44 dendrites (5 mice); Experimental: n = 46 dendrites (6 mice). (c) Clustered spine addition following context exposure is greater than chance: The histogram shows percent clustering from 1000 simulations of randomized new spine positions, where the percent of new spines within 5 µm of each other was calculated. Yellow line: Percentage spine clustering observed from the data. The percentage of clustered spines is more than that expected by chance for the experimental group (Right, n = 6; p = 0.009) whereas the percentage of clustered spines is at chance levels for the control group (Left, n = 5; p = 0.14). Control: n = 44 dendrites (5 mice); Experimental: n = 46 dendrites (6 mice). Data represent mean ± s.e.m. Source data
Extended Data Fig. 10
Extended Data Fig. 10. DTE-mediated targeting labels recently activated dendritic segments.
(a) Dendritic segments labeled using DTE-mediated strategy are enriched in Arc mRNA. Top: Experimental Design: Control group was designed to label a small but random subset of dendrites (CamKII-Cre::DIO-GFP in WT mice), and the DTE group used a low titer injection to label activated dendrites sparsely (cFos-tTa mice, TRE-Opsin-GFP-DTE). Bottom: Regions of interest (ROI) were manually delineated to specifically isolate the fluorescent signal within dendrites (to exclude somatic regions). GFP and Arc signals within these ROIs were automatically segmented. A 1-5 fold dilation of the GFP signal was applied, and the volume of overlap between the dilated GFP signal and the Arc signal was quantified to determine the extent of their colocalization. Arc mRNA was enriched in labeled dendrites in the DTE vs. Control group (Control: n = 3, DTE: n = 5; TWRM ANOVA, FGroup (1, 6) = 10.08, p = 0.02, Sidak’s multiple comparisons test). Scale: 10 µm. (b) Dendritic segments labeled using DTE-mediated strategy are preferentially reactivated upon reexposure to the original labeling context. Top: Experimental Design. Bottom Left: PSD-95 puncta on DTE labeled dendrites displayed more pCofilin labeling (n = 8 slices, 4 mice); Wilcoxon test, p = 0.008. Bottom Middle: Similarly, PSD-95 puncta that were classified as positively labeled for pCofilin (pCofilin+ PSD-95 + ) displayed higher fluorescence intensity when present on mCherry-labeled dendrites than neighboring pCofilin+ PSD-95+ puncta (TWRM ANOVA, FGroup (3, 21) = 137.7, p < 0.0001, Sidak’s multiple comparisons test). Bottom right: Representative image depicting pCofilin-positive puncta (magenta) on PSD-95 (green) and mCherry-positive dendrite (red). White and black arrows represent pCofilin-positive, PSD-95-postive puncta on mCherry-positive dendrites and neighboring regions respectively. Scale: 10 µm, Inset Scale: 2 µm. Data represent mean± s.e.m. and each data point, * p < 0.05. Source data

References

    1. Rogerson, T. et al. Synaptic tagging during memory allocation. Nat. Rev. Neurosci.15, 157–169 (2014). - PMC - PubMed
    1. Sehgal, M. et al. Memory allocation mechanisms underlie memory linking across time. Neurobiol. Learn. Mem.153, 21–25 (2018). - PMC - PubMed
    1. Cai, D. J. et al. A shared neural ensemble links distinct contextual memories encoded close in time. Nature534, 115–118 (2016). - PMC - PubMed
    1. Yokose, J. et al. Overlapping memory trace indispensable for linking, but not recalling, individual memories. Science355, 398–403 (2017). - PubMed
    1. Rashid, A. J. et al. Competition between engrams influences fear memory formation and recall. Science353, 383–387 (2016). - PMC - PubMed