. 2025 Feb;16(1):e13742.
doi: 10.1002/jcsm.13742.

Cachexia Alters Central Nervous System Morphology and Functionality in Cancer Patients

Affiliations

Cachexia Alters Central Nervous System Morphology and Functionality in Cancer Patients

Estefania Simoes et al. J Cachexia Sarcopenia Muscle. 2025 Feb.

Abstract

Background: Cachexia is a clinically challenging multifactorial and multi-organ syndrome, associated with poor outcome in cancer patients, and characterised by inflammation, wasting and loss of appetite. The syndrome leads to central nervous system (CNS) function dysregulation and to neuroinflammation; nevertheless, the mechanisms involved in human cachexia remain unclear.

Methods: We used in vivo structural and functional magnetic resonance imaging (Cohort 1), as well as postmortem neuropathological analyses (Cohort 2) in cachectic cancer (CC) patients compared to weight stable cancer (WSC) patients. Cohort 1 included treatment-naïve adults diagnosed with colorectal cancer, further divided into WSC (n = 12; 6/6 [male/female], 61.3 ± 3.89 years) and CC (n = 10; 6/4, 63.0 ± 2.74 years). Cohort 2 was composed by human postmortem cases where gastrointestinal carcinoma was the underlying cause of death (WSC n = 6; 3/3, 82.7 ± 3.33 years and CC n = 10; 5/5, 84.2 ± 2.28 years).

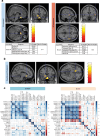
Results: Here we demonstrate that the CNS of CC patients presents regional structural differences within the grey matter (GM). Cachectic patients presented an augmented area within the region of the orbitofrontal cortex, olfactory tract and the gyrus rectus (coordinates X, Y, Z = 6, 20,-24; 311 voxels; pFWE = 0.023); increased caudate and putamen volume (-10, 20, -8; 110 voxel; pFWE = 0.005); and reduced GM in superior temporal gyrus and rolandic operculum (56,0,2; 156 voxels; pFWE = 0.010). Disrupted functional connectivity was found in several regions such as the salience network, subcortical and temporal cortical areas of cachectic patients (20 decreased and 5 increased regions connectivity pattern, pFDR < 0.05). Postmortem neuropathological analyses identified abnormal neuronal morphology and density, increased microglia/macrophage burden, astrocyte profile disruption and mTOR pathway related neuroinflammation (p < 0.05).

Conclusions: Our results indicate that cachexia compromises CNS morphology mostly causing changes in the GM of cachectic patients, leading to alterations in regional volume patterns, functional connectivity, neuronal morphology, neuroglia profile and inducing neuroinflammation, all of which may contribute to the loss of homeostasis control and to deficient information processing, as well as to the metabolic and behavioural derangements commonly observed in human cachexia. This first human mapping of CNS cachexia responses will now pave the way to mechanistically interrogate these pathways in terms of their therapeutic potential.

Keywords: central nervous system; grey matter; human cachexia; neuroimaging; neuroinflammation; neuropathology.


Conflict of interest statement

The authors declare no conflicts of interest.

Figures

FIGURE 1
FIGURE 1
Flowchart for the in vivo neuroimaging study in patients and for the postmortem neuropathological analysis in cadaver samples.
FIGURE 2
FIGURE 2
Morphometric alterations in human cachectic brain detected by VBM analyses. (a) (i) Increased grey matter regions in CC; (ii) decreased grey matter regions in CC. Coloured bar represents the T‐value (post‐hoc tests) for the voxel of maximum statistical significance within each cluster. x, y, z: coordinates; Nb, number; Vx, voxel; R, right; L, left; Med, medial; Sup, superior; Inf, inferior. (b) Increased ROIs in CC patients; (c) nonparametric Spearman correlation analysis between biological variables and ROIs: (i) correlations in WSC patients and (ii) correlations in CC patients. Each scatterplot on the panel corresponds to the pair of variables indicated on the labels on the horizontal and vertical axes. The value of the Spearman coefficient (ρ) is indicated by colour according to the colour scale on the right. BM, body mass; CC, cancer cachexia, n = 10; CRP, c‐reactive protein; IL: interleukin; L, left; ORF, orbitofrontal cortex; R, right; WSC, weight stable cancer; n = 12.
FIGURE 3
FIGURE 3
Disrupted functional connectivity in cachectic human brain assessed with rsfMRI. The FC maps display the parametric statistics (Gaussian random field theory) cluster threshold: p < 0.05 cluster‐size p‐FDR corrected; voxel threshold: p < 0.001 p‐uncorrected. AC, anterior cingulate gyrus; Ant. or a, anterior; FG, frontal gyrus; FG oper, frontal gyrus pars opercularis; FG tri, frontal gyrus pars triangularis; FO, frontal operculum; FP, frontal pole; i, inferior; IC, insular cortex; left; ICC, intracalcarine cortex; ITG, inferior temporal gyrus; ; LG, lateral gyrus; L or l, left; LH, hemisphere; LOC, lateral occipital cortex; Mid, middle; LiG, lingual gyrus; MTG, middle temporal gyrus; OFC, orbitofrontal cortex; OFG, occipital fusiform gyrus; PaCiG, paracingulate gyrus; PC, posterior cingulate gyrus; PCu, precuneous; PreCG, precentral gyrus; Post or p, posterior.; PostCG, postcentral gyrus; R or r, right; RH, right hemisphere; RPFC, right prefrontal cortex; s, superior; SFG, superior frontal gyrus; SMG, supramarginal gyrus; SPL, superior parietal lobule; WM, white matter.
FIGURE 4
FIGURE 4
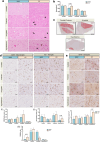
Neuropathological analyses in postmortem human brain reveals differences in cachexia. 400x magnification optic microscopy images. Significant differences between the groups were tested using unpaired T‐test. WSC, weight stable cancer, n = 6; CC: Cancer Cachexia, n = 10. (a) H&E staining in human brain, → showing altered neuronal structures; (b) Neuronal density (neurons/mm2) data in Cohort 2; (c) automated quantification in the regions of interest using Qupath v.0.1.2; (d) left panel: CD68 staining in ROIs; right panel: Iba1 staining in ROIs; lower panel: T‐test statistics of CD68 and Iba1 staining; (e) GFAP staining analyses in ROIs.
FIGURE 5
FIGURE 5
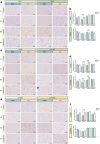
Semiquantitative mTOR pathway analyses in human brain tissue. 400x magnification optic microscopy images. Data expressed as mean ± SEM. Significant differences between the groups were tested using unpaired T‐test. WSC, weight stable cancer, n = 4–6; CC, cancer cachexia, n = 6–10. (a, b) Upstream mTOR pathway‐TSC1 and TSC2 staining and statistics in ROIs; (c, d) mTOR pathway core‐ mTOR and p‐mTOR staining and statistics in ROIs; (e, f) downstream mTOR pathway‐p70S6K and p‐p70S6K staining and statistics in ROIs; mTOR, mechanistic targeting pathway of rapamycin; p70S6K, ribosomal protein S6 kinase; p‐p70S6K, phosphorylated p70S6K; p‐mTOR, phosphorylated mTOR; TSC1, hamartin; TSC2, tuberin.

References

    1. Evans W. J., Morley J. E., Argilés J., et al., “Cachexia: A New Definition,” Clinical Nutrition 27 (2008): 793–799. - PubMed
    1. Fearon K., Strasser F., Anker S. D., et al., “Definition and Classification of Cancer Cachexia: An INTERNATIONAL Consensus,” Lancet Oncology 12 (2011): 489–495. - PubMed
    1. Porporato P. E., “Understanding Cachexia as a Cancer Metabolism Syndrome,” Oncogene 5 (2016): e200. - PMC - PubMed
    1. Burfeind K., Michaelis K. A., and Marks D. L., “The Central Role of Hypothalamic Inflammation in the Acute Illness Response and Cachexia,” Seminars in Cell and Developmental Biology 54 (2016): 42–52, 10.1016/j.semcdb.2015.10.038. - DOI - PMC - PubMed
    1. Olson B., Diba P., Korzun T., and Marks D. L., “Neural Mechanisms of Cancer Cachexia,” Cancers (Basel) 13, no. 13 (2021): 3990. - PMC - PubMed