

IgA displays site- and subclass-specific glycoform differences despite equal glycoenzyme expression
- PMID: 39962487
- PMCID: PMC11834270
- DOI: 10.1186/s12964-025-02088-0
IgA displays site- and subclass-specific glycoform differences despite equal glycoenzyme expression
Abstract
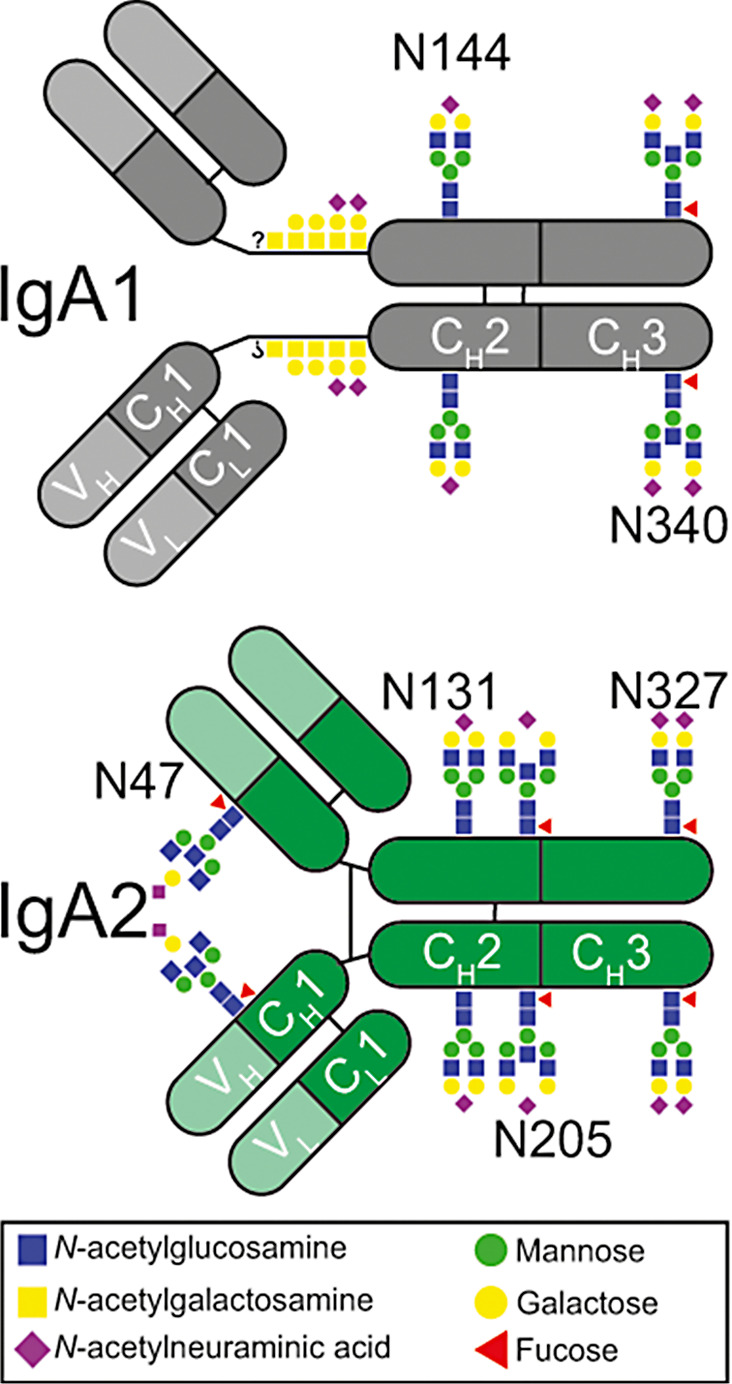
Background: Glycosylation is an important posttranslational modification of proteins and in most cases indispensable for proper protein function. Like most soluble proteins, IgA, the second most prevalent antibody in human serum, contains several N- and O-glycosylation sites. While for IgG the impact of Fc glycosylation on effector functions and inflammatory potential has been studied intensively, only little is known for IgA. In addition, only glimpses exist regarding the regulation of IgA glycosylation. We have previously shown that IgA1 and IgA2 differ functionally and also show differences in their glycosylation pattern. The more pro-inflammatory IgA2 which is linked to autoimmune diseases displays decreased sialylation, galactosylation, fucosylation and bisection as compared to IgA1. In the present study, we aimed to investigate these differences in glycosylation in detail and to explore the mechanisms underlying them.
Methods: IgA1 and IgA2 was isolated from serum of 12 healthy donors. Site specific glycosylation was analyzed by mass spectrometry. In addition, human bone marrow plasma cells were investigated using single cell mRNA sequencing, flow cytometry and ELISpot.
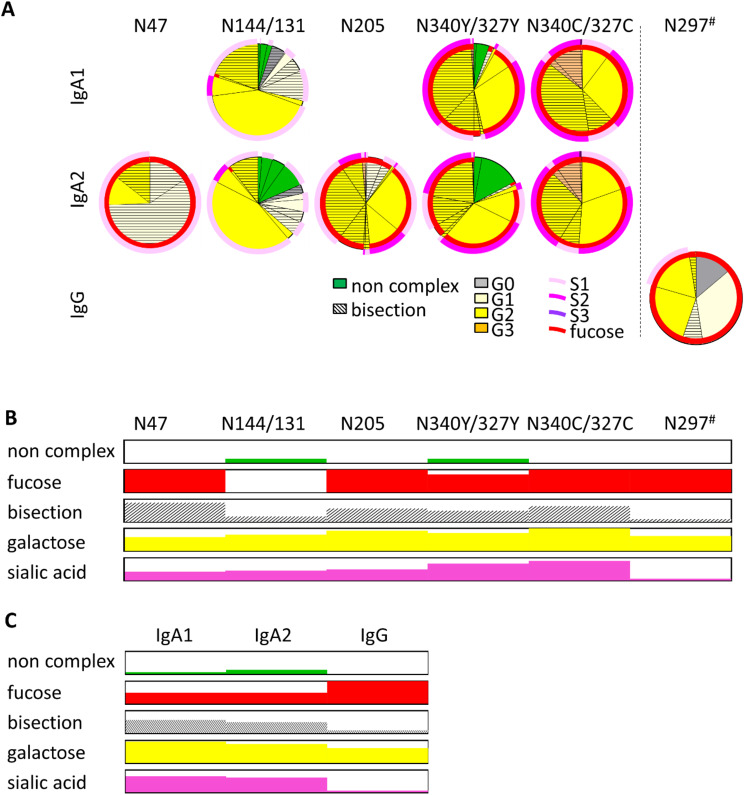
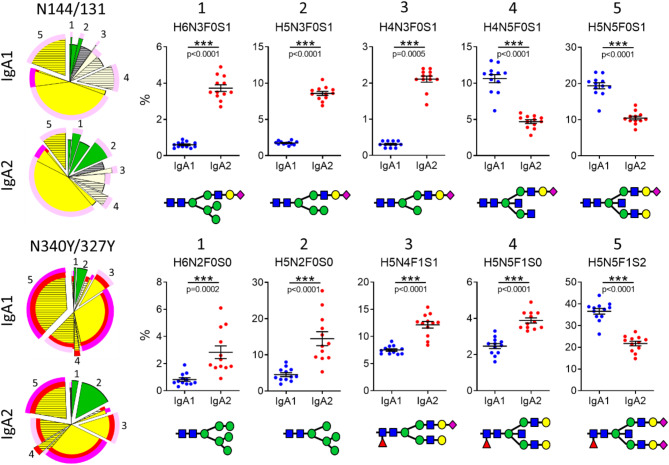
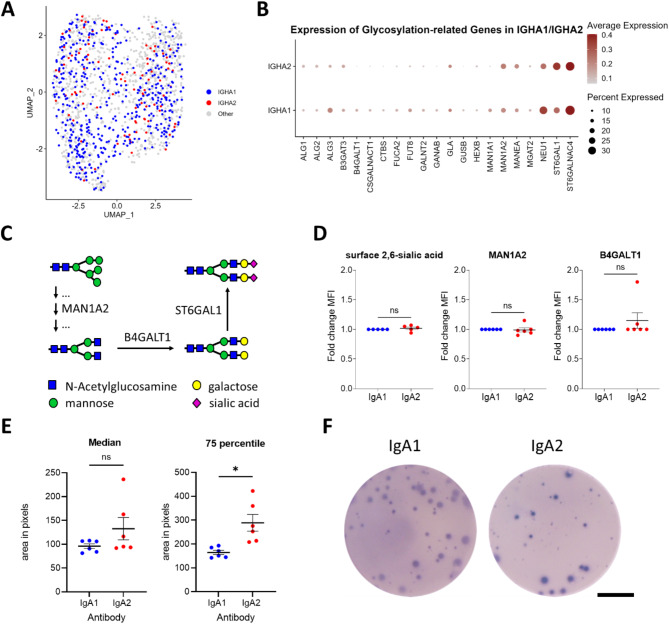
Results: We found that certain glycoforms greatly differ in their abundance between IgA1 and IgA2 while others are equally abundant. Overall, the IgA2 glycans displayed a more immature phenotype with a higher prevalence of oligomannose and fewer fully processed glycans. Of note, these differences can't be explained by differences in the glycosylation enzyme machinery as mRNA sequencing and flow cytometry analysis showed equal enzyme expression in IgA1 and IgA2 producing plasma cells. ELISpot analysis suggested a slightly increased antibody production rate in IgA2 producing plasma cells which might contribute to its lower glycan processing rates. But this difference was only minor, suggesting that further factors such as steric accessibility determine glycan processing. This is supported by the fact that glycans at different positions on the same IgA chain differ dramatically in fucosylation, sialylation and bisection.
Conclusion: In summary, our detailed overview of IgA1 and IgA2 glycosylation shows a class, subclass, and site-specific glycosylation fingerprint, most likely due to structural differences of the protein backbones.
Keywords: Glycoenzyme; Glycoform; Glycosylation; IgA; Plasma cells.
© 2025. The Author(s).
Conflict of interest statement
Declarations. Ethics approval and consent to participate: All analyses were performed in accordance to the Declaration of Helsinki principles, the institutional guidelines and with the approval of the Ethical Committee of the University Clinic of Erlangen (Permit 277_17 B). All individuals provided informed consent prior to participation in the study. Consent for publication: not applicable. Competing interests: The authors declare no competing interests.
Figures
References
-
- Eichler J. Protein glycosylation. Curr Biol. 2019;29(7):R229–31. - PubMed
-
- Zacchi LF, Schulz BL. N-glycoprotein macroheterogeneity: biological implications and proteomic characterization. Glycoconj J. 2016;33(3):359–76. - PubMed
-
- Nimmerjahn F, Vidarsson G, Cragg MS. Effect of posttranslational modifications and subclass on IgG activity: from immunity to immunotherapy. Nat Immunol. 2023;24(8):1244–55. - PubMed
MeSH terms
Substances
LinkOut - more resources
Full Text Sources
Miscellaneous
