

Prediction of depressive disorder using machine learning approaches: findings from the NHANES
- PMID: 39962516
- PMCID: PMC11834192
- DOI: 10.1186/s12911-025-02903-1
Prediction of depressive disorder using machine learning approaches: findings from the NHANES
Abstract
Background: Depressive disorder, particularly major depressive disorder (MDD), significantly impact individuals and society. Traditional analysis methods often suffer from subjectivity and may not capture complex, non-linear relationships between risk factors. Machine learning (ML) offers a data-driven approach to predict and diagnose depression more accurately by analyzing large and complex datasets.
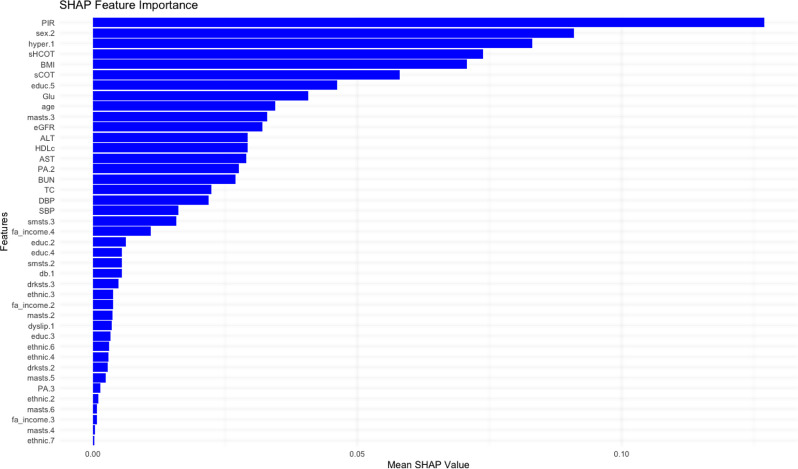
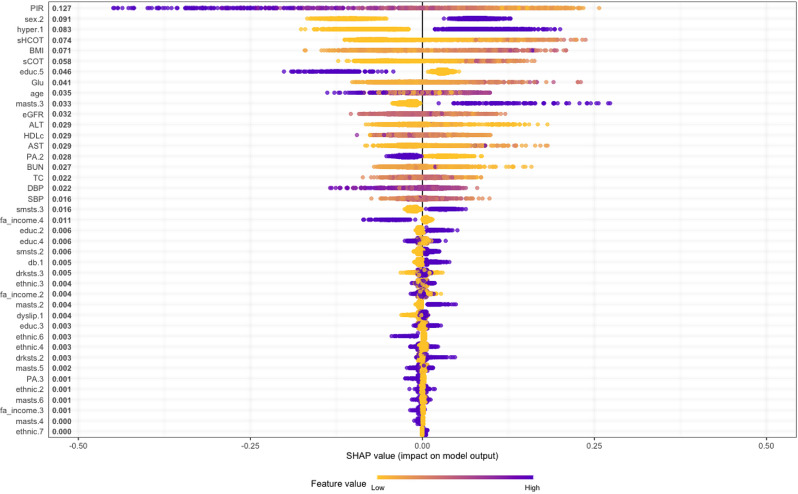
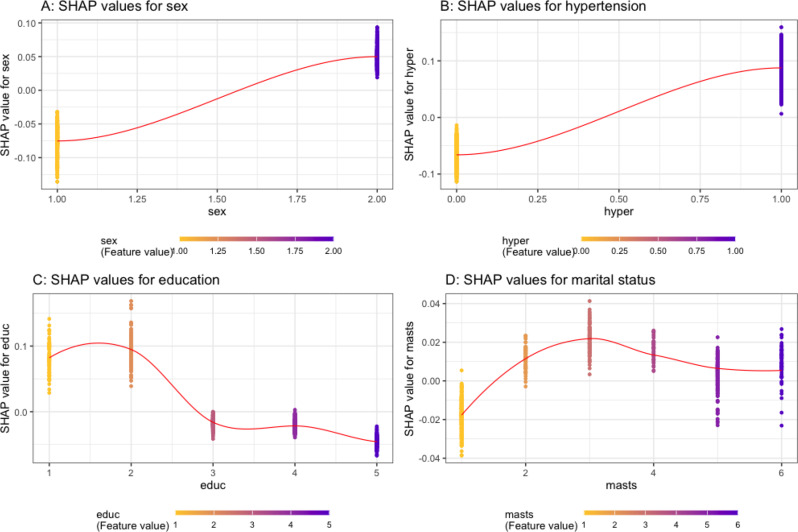
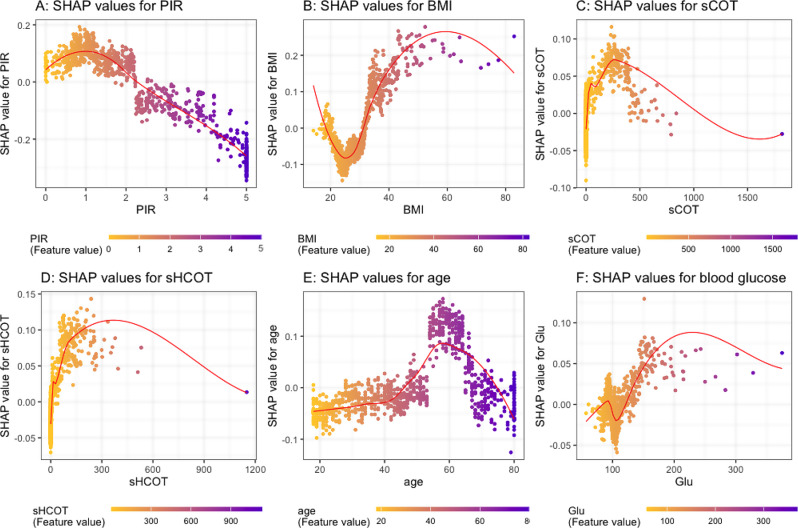
Methods: This study utilized data from the National Health and Nutrition Examination Survey (NHANES) 2013-2014 to predict depression using six supervised ML models: Logistic Regression, Random Forest, Naive Bayes, Support Vector Machine (SVM), Extreme Gradient Boost (XGBoost), and Light Gradient Boosting Machine (LightGBM). Depression was assessed using the Patient Health Questionnaire (PHQ-9), with a score of 10 or higher indicating moderate to severe depression. The dataset was split into training and testing sets (80% and 20%, respectively), and model performance was evaluated using accuracy, sensitivity, specificity, precision, AUC, and F1 score. SHAP (SHapley Additive exPlanations) values were used to identify the critical risk factors and interpret the contributions of each feature to the prediction.
Results: XGBoost was identified as the best-performing model, achieving the highest accuracy, sensitivity, specificity, precision, AUC, and F1 score. SHAP analysis highlighted the most significant predictors of depression: the ratio family income to poverty (PIR), sex, hypertension, serum cotinine and hydroxycotine, BMI, education level, glucose levels, age, marital status, and renal function (eGFR).
Conclusion: We developed ML models to predict depression and utilized SHAP for interpretation. This approach identifies key factors associated with depression, encompassing socioeconomic, demographic, and health-related aspects.
Keywords: Depression; Depressive disorder; Light Gradient Boosted Machine (Light-GBM); Logistic regression; Naïve bayes; Random forest; Shapley Addictive exPlanations (SHAP); Supervised machine learning; Support Vector Machine (SVM); eXtreme Gradient Boost (XGBoost).
© 2025. The Author(s).
Conflict of interest statement
Declarations. Ethics approval and consent to participate: Ethics approval for this study was granted by the National Centre for Health Statistics Research Ethics Review Board (Protocol # 2013-14). Since this study involves secondary data analysis, the original informed consent provided during primary data collection included permission for secondary use, eliminating the need for additional participant consent. Participants’ privacy was protected by anonymizing or de-identifying the data to prevent identification. Further details on NHANES ethics approval are available on the CDC’s official website: https://www.cdc.gov/nchs/nhanes/about/erb.html?CDC_AAref_Val=https://www.cdc.gov/nchs/nhanes/irba98.htm . Consent for publication: Not applicable. Relevant guidelines and regulations: Not applicable. Competing interests: The authors declare no competing interests.
Figures
References
-
- World Health Organization. https://www.who.int/news-room/fact-sheets/detail/depression.
MeSH terms
Grants and funding
LinkOut - more resources
Full Text Sources
Research Materials
Miscellaneous
